Simplified amino acid alphabets based on deviation of conditional probability from random background
Abstract
The primitive data for deducing the Miyazawa-Jernigan contact energy or BLOSUM score matrix consists of pair frequency counts. Each amino acid corresponds to a conditional probability distribution. Based on the deviation of such conditional probability from random background, a scheme for reduction of amino acid alphabet is proposed. It is observed that evident discrepancy exists between reduced alphabets obtained from raw data of the Miyazawa-Jernigan’s and BLOSUM’s residue pair counts. Taking homologous sequence database SCOP40 as a test set, we detect homology with the obtained coarse-grained substitution matrices. It is verified that the reduced alphabets obtained well preserve information contained in the original 20-letter alphabet.
PACS number(s): 87.10.+e,02.50.-r
1 Introduction
Experimental investigation has strongly suggested that protein folding can be achieved with fewer letters than the 20 naturally occurring amino acids [1, 2]. The native structure and physical properties of the protein Rop is maintained when its 32-residue hydrophobic core is formed with only Ala and Leu residues [3]. Another example is the five-letter alphabet of Baker’s group for 38 out of 40 selected sites of the SH3 chain [4]. The mutational tolerance can be high in many regions of protein sequences. Heterogeneity or diversity in interaction must be present for polypeptides to have protein-like properties. However, the physics and chemistry of polypeptide chains consisting of fewer than 20 letters may be sufficiently simplified for a thorough understanding of the protein folding.
A central task of protein sequence analysis is to uncover the exact nature of the information encoded in the primary structure. We still cannot read the language describing the final 3D fold of an active biological macromolecule. Compared with the DNA sequence, a protein sequence is generally much shorter, but the size of the alphabet is five times larger. A proper coarse graining of the 20 amino acids into fewer clusters is important for improving the signal-to-noise ratio when extracting information by statistical means.
Based on Miyazawa-Jernigan’s (MJ) residue-residue statistical potential [5], Wang and Wang (WW) reduced the alphabet [6]. They introduced a ‘minimal mismatch’ principle to ensure that all interactions between amino acids belonging to any two given groups are as similar to one another as possible. The knowledge-based MJ potential is derived from the frequencies of contacts between different amino acid residues in a set of known native protein structure databases. Murphy, Wallqvist and Levy (MWL) [7] approached the same problem using the BLOSUM matrix derived by Henikoff and Henikoff [8]. The matrix is deduced from amino acid pair frequencies in aligned blocks of a protein sequence database, and is widely used for sequence alignment and comparison.
The problem of alphabet reduction may be viewed as cluster analysis, which is a well developed topic [9, 10]. WW used the mismatch as an objective function without any resemblance measure. MWL adopted a cosine-like resemblance coefficient (with a non-standard normalization) from the BLOSUM score matrix without any objective function, and took the arithmetic mean of scores to define the cluster center. It is our purpose to propose an algorithm for selecting a reduced alphabet based on deviation of conditional probability from random background, and to compare results obtained from different schemes of reduction.
2 Reduction of amino acid alphabets
Either the MJ contact energies or BLOSUM score matrices are deduced from the primitive frequency counts of amino acid pairs. Taking the BLOSUM matrix as an example for specificity, following Henikoff and Henikoff [8], we denote the total number of amino acid , pairs by . It is convenient to introduce another set of with for and , which defines a joint probability for each , pair
| (1) |
The probability for the amino acid to occur is then
| (2) |
Each amino acid may be described by the conditional probability vector with . This conditional probability has been used as the attribute of amino acids in an entropic cluster analysis [11].
We introduce a vector to characterize amino acid . This vector has its components
| (3) |
being the logarithmic odds describing the deviation of the conditional probability from the ‘random background’ , the probability of occurrence for amino acid . ( is essentially the BLOSUM score.) A group of several amino acids may be described by the weighted average vector
| (4) |
where the summation is taken over the amino acids in the group.
Regarding as the group center, the distance of amino acid in the group from the center may be described by . When we divide the 20 amino acids into clusters, we may measure the quality of clustering with the following weighted sum of distances
| (5) |
which will be called the error function of clustering. For the original 20 amino acids with each forming a cluster, we have simply . when amino acids are further clustered into fewer clusters, increases. For a fixed total number of clusters, the best clustering is obtained when value is minimized.
Starting with the amino acid pair counts of the MJ and BLOSUM matrices, we perform simulated annealing for minimization of . The results for reduced alphabets derived from MJ and BLOSUM counts are shown in Tables I and II, respectively.
3 Homology detection with reduced alphabets
It is well known that there is no generally accepted ‘best’ method among many existing algorithms for clustering. To evaluate the validity of the above scheme for reduction of amino acid alphabets, we examine whether the reduced alphabets still preserve homology of proteins.
An element of the BLOSUM matrices or BLOSUM score is defined as . Once a reduced amino acid alphabet is found, its coarse-grained BLOSUM scores may be calculated similarly by
| (6) |
which is the analogue of for clusters and . Using such coarse-grained BLOSUM50 substitution matrices, we perform all-against-all sequence alignment on SCOP40 database [12, 13] with Blast2.0 [14, 15]. The gap insertion and elongation parameters used for alignment are set to 11/1. Filter option is closed. Detection of homology, i.e. identification of the superfamily for each sequence in the database, is illustrated by coverage as a function of errors per query for a set of expectation value thresholds. The coverage is defined as the number of homologous pairs detected divided by the total number of homologous pairs present in the database. The error per query is defined as the total number of non-homologous protein sequences detected with expectation value equal to or greater than the threshold divided by the total number of aligned sequence pairs. By varying the expectation value cutoff of Blast2.0, the error per query value is calculated for each clustering scheme and adjusted to 0.001 to identify homologous sequences. The coverage as a function of the number of amino acid clusters is shown in Fig. 1. To compare with Ref. [7], in the figure the coverage obtained with the MWL scheme is also shown. In general, our coverage values are superior to those of MWL.
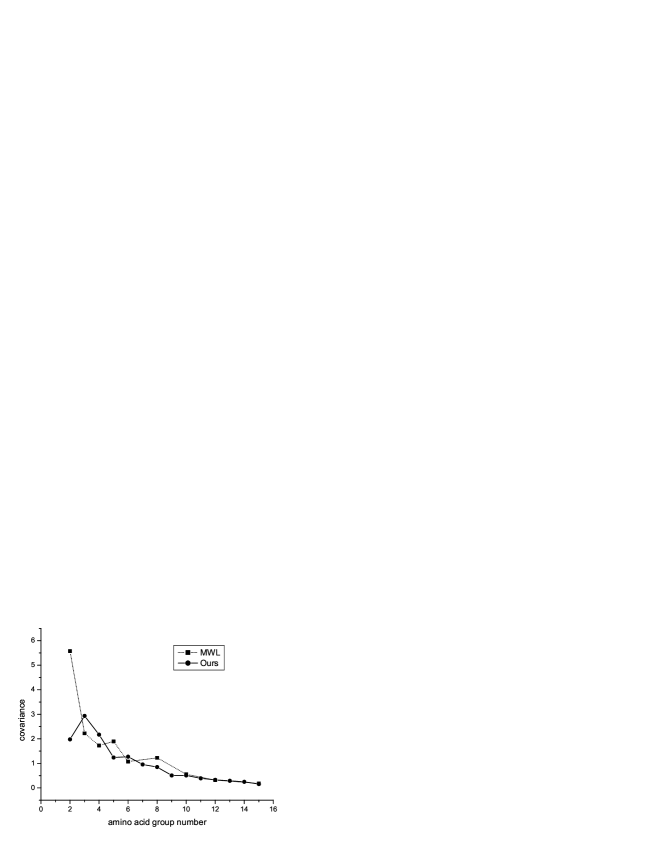
We further study the linear regression between alignment scores and for homologous pairs obtained by searching with the original and coarse-grained BLOSUM50 matrices, respectively. We calculate the correlation coefficient and covariance
| (7) |
with
| (8) |
where is the sample size. The obtained correlation coefficient and covariance as a function of number of amino acid clusters are shown in Figs. 2 and 3, respectively. Results from the MWL scheme are also shown for comparison.
4 Discussion
In the above we have proposed a scheme for amino acid alphabet reduction based on the deviation of conditional probability from random background. We have detected homology of sequences in SCOP database with the derived coarse-grained BLOSUM similarity matrices.
From Tables 1 and 2, we see that the clustering using residue pair counts of either MJ or BLOSUM is not completely hierachical. That is, clusters formed in an early step need not be preserved in a latter step. Such a reversal case exists for both MJ and BLOSUM, but is rare for both.
The clustering based on MJ shows evident discrepancy from that based on BLOSUM. For example, Tyr(Y) groups with Phe(F) in an early stage (12 clusters) for BLOSUM, while Tyr is still separated until the stage of 2 clusters. Another example is Val(V) and Ala(A). The MJ data take each residue in a structure into account, whereas the BLOSUM data focus more on aligned blocks. From the way that the pair frequency counts are obtained, the BLOSUM data are more related to the evolutional difference of residues, while the MJ data are related to structure difference. However, for both MJ and BLOSUM the separation of hydrophobic and hydrophilic groups is rather clear.
It is observed that the MJ contact energies can be largely attributed to hydrophobicity of the residue pair involved [16]. We see a strong correlation between our classification based on MJ and hydrophobic values of amino acids [17] as shown in the example
Furthermore, we do see Baker’s five representative letters (AIGEK) [4] and Schafmeister’s seven letters [18], except for an additional cluster consisting of the extraordinary single member Cys(C).
Our results of homology recognition with reduced alphabets indicate that there is no significant drop in the coverage as long as the number of letters is not smaller than 9. The percentage coverage retained is reduced by only 10% for 9 letters. The correlation coefficient and covariance calculated from the linear regression between the alignment scores obtained with the original and coarse-grained BLOSUM matrices agree with this very well. A strong correlation in scores is seen for number of letters not less than 9. The correlation coefficient and covariance are still reasonable even though the number of clusters is as small as 5. We may conclude that the 9-letter alphabet preserves most information of the original 20-letter alphabet, and the 5-letter alphabet is still a reasonable choice.
This work was supported in part by the Special Funds for Major National Basic Research Projects and the National Natural Science Foundation of China.
References
- [1] H.S. Chan, Nature Struct. Biol., 6, 994 (1999).
- [2] K.W. Plaxco, D.S. Riddle, V.P. Grantcharova, and D. Baker, Curr. Opin. Struct. Biol., 8, 80 (1998).
- [3] M. Munson, R. O’Brien, J.M. Sturtevant, and L. Regan, Protein Sci., 3, 2015 (1994).
- [4] D.S. Riddle, J.V. Santiago, S.T. Bray-Hall, N. Doshi, V.P. Grantcharova, Q. Yi, and D. Baker, Nature Struct. Biol., 4, 805 (1997).
- [5] S. Miyazawa, and R.L. Jernigan, J. Mol. Biol., 256, 623 (1996).
- [6] J. Wang, and W. Wang, Nature Struct. Biol., 6, 1033 (1999).
- [7] L.R. Murphy, A. Wallqvist, and R.M. Levy, Protein Eng., 3, 149 (2000).
- [8] S. Henikoff and J.G. Henikoff, Proc. Natl. Acad. Sci. (USA), 89, 10915 (1992).
- [9] H.C. Romesburg, Cluster Analysis for Researchers, (Lifetime Learning Publications, Belmont, 1984).
- [10] H. Späth, Cluster Dissection and Analysis: Theory, FORTRAN Program, Examples, (Ellis Horwood, New York, 1985).
- [11] W.M. Zheng, http://arxiv.org/format/physics/0106074.
- [12] S.E. Brenner, C. Chothia, and J.P. Hubbard, Proc. Natl. Acad. Sci. (USA), 95, 6073 (1998).
- [13] A.G. Murzin, S.E. Brenner, T. Hubbard, and C. Chothia, J. Mol. Biol., 247, 536 (1995).
- [14] S.F. Altschul, T.L. Madden, A.A. Schäffer, J. Zhang, Z. Zhang, W. Miller, and D.J. Lipman, Nucleic Acids Res., 25, 3389 (1997).
- [15] S.F. Altschul, J. Mol. Biol., 219, 555 (1991).
- [16] A. Godzik, A. Koliński, and J. Skolnick, Protein Sci., 4, 2107 (1995).
- [17] B. Carl and T. John, Introduction to Protein Structure, p.210 (Garland Publishing,Inc., 1991).
- [18] C.E. Schafmeister, S.L. LaPorte, L.J.W. Miercke, and R.M. Stroud, Nature Struct. Biol., 4, 1039 (1997).
Table I. Reduced amino acid alphabets based on the residue pair counts for MJ matrix. The first column indicates the number of amino acid groups.
 2 MFILVAW      CYQHPGTSNRKDE
 3 MFILVAW      CYQHPGTSNRK        DE
 4 MFILV    ACW  YQHPGTSNRK        DE
 5 MFILV    ACW  YQHPGTSN       RK DE
 6 MFILV    A C WYQHPGTSN       RK DE
 7 MFILV    A C WYQHP   GTSN    RK DE
 8 MFILV    A C WYQHP   G TSN   RK DE
 9 MF ILV   A C WYQHP   G TSN   RK DE
10 MF ILV   A C WYQHP   G TSN   RK D E
11 MF IL  V A C WYQHP   G TSN   RK D E
12 MF IL  V A C WYQHP   G TS  N RK D E
13 MF IL  V A C WYQHP   G T S N RK D E
14 MF I L V A C WYQHP   G T S N RK D E
15 MF IL  V A C WYQ H P G T S N RK D E
16 MF I L V A C WYQ H P G T S N RK D E
Table II. Reduced amino acid alphabets based on the residue pair counts for BLOSUM50 matrix. The first column indicates the number of amino acid groups.
 2 IMVLFWY     GPCASTNHQEDRK
 3 IMVLFWY     GPCAST    NHQEDRK
 4 IMVLFWY     G PCAST   NHQEDRK
 5 IMVL  FWY   G PCAST   NHQEDRK
 6 IMVL  FWY   G P CAST  NHQEDRK
 7 IMVL  FWY   G P CAST  NHQED RK
 8 IMV L FWY   G P CAST  NHQED RK
 9 IMV L FWY   G P C AST NHQED RK
10 IMV L FWY   G P C A STNH    RKQE  D
11 IMV L FWY   G P C A STNH    RKQ E D
12 IMV L FWY   G P C A ST  N  HRKQ E D
13 IMV L F WY  G P C A ST  N  HRKQ E D
14 IMV L F WY  G P C A S T N  HRKQ E D
15 IMV L F WY  G P C A S T N H RKQ E D
16 IMV L F W Y G P C A S T N H RKQ E D