Effect of Cooling Water on Stability of NLC Linac Components
Abstract
Vertical vibration of linac components (accelerating structures, girders and quadrupoles) in the NLC has been studied experimentally and analytically. Effects such as structural resonances and vibration caused by cooling water both in accelerating structures and quadrupoles have been considered. Experimental data has been compared with analytical predictions and simulations using ANSYS. A design, incorporating the proper decoupling of structure vibrations from the linac quadrupoles, is being pursued.
1 Introduction
As the limit for the next generation of collider is again pushed further, alignement of components and their stability are critical. As part of the R&D effort for the Next Linear Collider (NLC), a program has developed to study the vibrations induced by cooling water on the NLC linac components [1] [2]. Similar studies are also underway at CERN for the Compact Linear Collider (CLIC) [3].
An adequate flow of cooling water to the accelerating structures is required in order to maintain the structure at the designated operating temperature. This flow may cause vibration of the structure and its supporting girder. The acceptable tolerance for vibration of the structure itself is rather loose . However our concern is that this vibration can couple to the linac quadrupoles, where the vibration tolerance is 10 nm, either via the beam pipe with its bellows or via the supports.
In this paper we will review the results obtained for the NLC RF structure and girder, those obtained for an electro magnetic (EM) quadrupole when fed with water and finally the results of coupling between the structure and the quadrupole when only the structure is fed with water.
2 Experimental setup
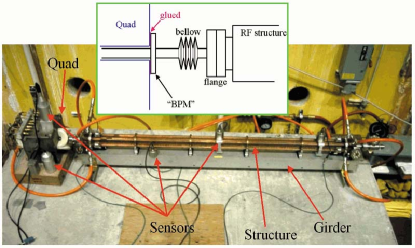
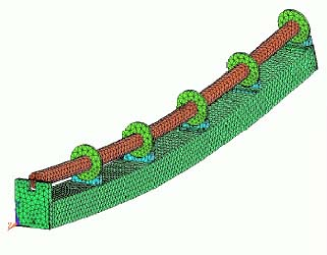
The structure studied, DDS standing for Damped and Detuned structure, is 1.8 m long, weight 100 kg and is supported by a “strongback” (hollow aluminum box beam 4x6 inches) of the same length, Fig.1 and 2. In the design, it was assumed that 3 such structures would be mounted on a single 6 m long girder [4]. It should be noted that the NLC currently plans to use shorter RF structures than the one studied [5], probably 90 cm . The required water flow (at 70MV/m loaded gradient) is about 1 /s for each structure (in total, through four cooling copper tubes). The rise in temperature in copper, is given approximatively by :
The power loss in the structure has been computed to be 4.5 kW/m and the required flow to obtain a , between RF on & RF off for the structure, of 1 ∘C is . For a filling time of 100 ns, a raise of 0.5 ∘C is equivalent to a 4∘ phase shift at the structure output. This phase shift will induce less than a half % of energy variation for the beam (%) if not compensate, and is acceptable. This 0.5 ∘C range is the temperature tolerance for the entire LINAC water cooling system [6].
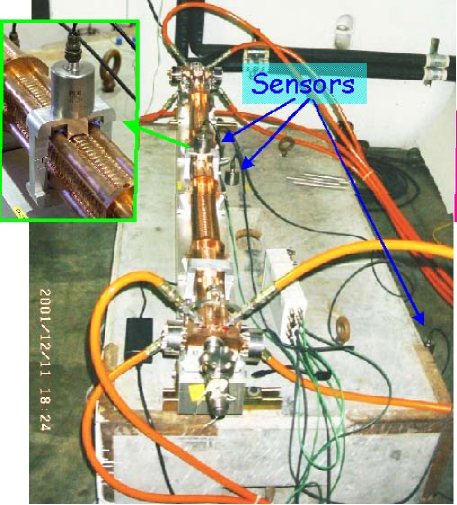
In the first set of experiments, we measured the vibration induced by different flow rates passing through the structure-girder system, as shown in Fig. 1. The water was the same as supplied to the NLC Test Accelerator (NLCTA) area. The RF structure was mounted to a concrete block of 2225 kg. The block was installed on rubber balls (14Hz resonance) to isolate it from the noisy floor of NLCTA. Vibration was monitored by four piezo-accelerometers (PCB Piezotronics, INC model # 393B31) and one piezo-transducer (PCB model # 112A21) was used to measure water pressure fluctuations. The diameter of each of the four cooling pipes were 1.9 cm (OD). The flow of water and the pressure were measured by a Venturi tube and by two manometers installed at the input and output supply.
The second set of experiments were designed to study the vibration caused only by internal turbulence. The structure-girder was in a quieter place on the floor of the SLD (SLAC Large Detector) collider hall and the cooling water was gravity-fed from a tank located 18 m above. The structure-girder was bolted to a 26T concrete block initially placed on a rubber mat and then on sand (in the first configuration the block had resonance at 35Hz which was decreased in the second case). The maximum water flow through the structure was limited to about 1.1 /s. The structure-girder was connected to the quad with a bellows, and a simple mock-up of a BPM was connected (glued) to the quadrupole Fig.2. A primary vacuum, sufficient for our tests, of Torr could be obtain in the vacuum pipe.
In each experiment, it was possible to feed the water to the structure either by using the 4 tubes in parallel or by feeding only 2 tubes at one end which were then connected in series to the adjacent tubes at the other end. In the latter case, the flow in 2 tubes was in countered flow.
3 Vibration of RF Structure
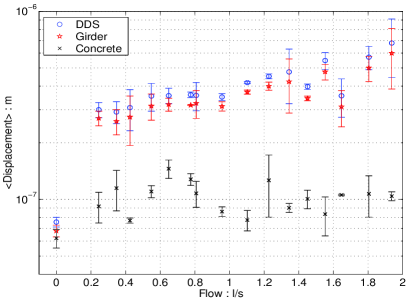
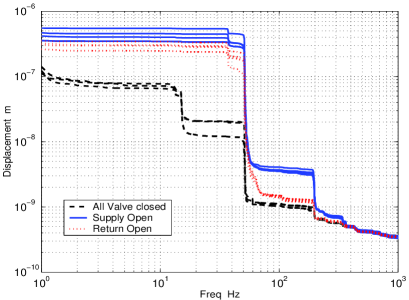
Fig.3 displays the results obtained in measuring the vertical vibration induced by different flow rates passing through the structure-girder system shown in Fig.1. Note that the system considered is above the turbulence threshold (Re2000) when the flow 0.1 /s. In Fig.3 the water was supplied by the NLC Test Accelerator (NLCTA) water system. In this case, the displacement of the structure-girder is weakly dependant of the flow in the structure because vibration is dominated by hydraulic noise from water supply pumps. The supplying cooling water has significant fluctuations of pressure in it (external turbulence). Fig.4 shows that vibration is not dominated by water flow. Displacement is largest when cooling inlet or outlet is open to supply pump but outlet or inlet is closed (no flow). Merely opening either the supply or the return valve, with the other valve closed, produced an integrated displacement of 0.4 m, equal to the maximum displacement observed at nominal flow 1 /s.
Quantitatively, the incoming water can be characterized by the spectrum of its pressure fluctuations. The integrated spectrum was measured by a pressure piezo-transducer in the NLCTA setup as shown in Fig.5. The incoming pressure causes vibration of the RF structure through the force it exerts on the surface of the cooling pipes (usually equal to cross-section of the pipe). It is interesting to note that the spectrum of the incoming NLCTA water is rather smooth and does not contain sharp peaks typically associated with the rotational frequencies of pumps. This indicates that the turbulence itself, and not the pumps, was the cause of the pressure fluctuations.
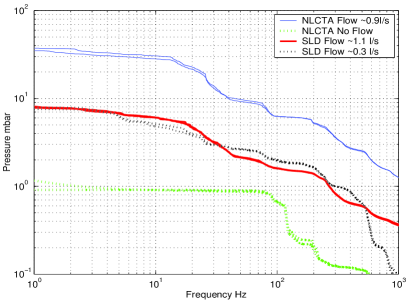
The NLC cooling system will be designed so that pressure fluctuations in the cooling water will be limited (if necessary, by use of passive devices as typically done in industry [7]), internal turbulence will then dominate. Thus, aiming to understand the contribution to vibration from internal turbulence occurring inside the structure itself, we conducted the second set of experiments.
4 Vibration of RF structure and Coupling to Quadrupole
Using the setup of Fig.2 we have studied the vibration of RF structure versus flow, and the coupling of vibration from the RF structure to the EM quadrupole in the case when RF structure is cooled with gravity-fed water.
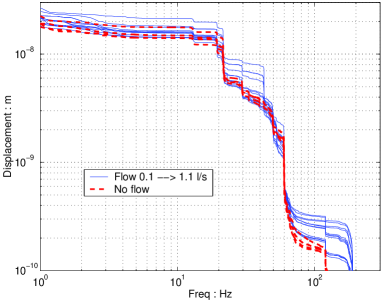
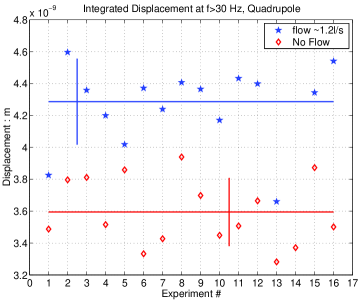
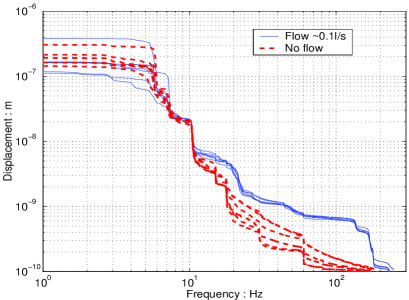
Vibration of the RF structure versus flow is shown in Fig.6. In this case, vibrations are caused mostly by the internal turbulence occurring in the RF structure. At nominal flow 1 , vibration of the structure is 110nm, compared to 350nm obtained with NLCTA cooling water Fig.3. Additional vibrations of the quadrupole are small. Performing multiple measurements with and without flow, and analyzing spectra of quadrupole vibration (Fig.7), we found that the additional vibration of the quadrupole due to cooling of RF structure above 30Hz is 2.4nm (obtained as , assuming vibrations are uncorrelated), see Fig.8. Taking a lower cut frequency would be statistically uncertain, due to high background noise of the concrete block at lower frequency. These results suggest that coupling from RF structure to the quadrupole is about 2% in the current configuration. We also investigated influence of vacuum in the RF structure (and possible stiffening of the bellow) on this coupling. No noticeable difference was observed with or without vacuum (the results displayed in Fig.6 are obtained with a primary vacuum of about 10-1 Torr in the structure-quadrupole system). However, we have not yet studied how much coupling is due to the bellows connection and how much due to transmission via support and concrete.
One should also note that the present set up is simplified. In particular, the quadrupole was placed on a small granite stand (with shims to adjust the height), which was placed on concrete block (without rigid connections). Such system had amplification – the quadrupole vibration is higher than the concrete as seen in Fig.6. This can be avoided in the real system.
5 Simulation and theory
We have shown in [1] that the vibration spectrum of the girder-structure system exhibits a vertical resonance at 52Hz Fig.4. The natural first resonant frequency for such design, obtain through simulation with ANSYS, is about 49 Hz. This calculated result is in good agreement with measurements, and corresponds to simplest vertical bending mode Fig.9. These simulations also indicate that the second and the third modes are the horizontal dipole at 69 Hz and vertical two-nodes mode at 117 Hz, while the fourth resonance is torsional 146 Hz.
The driving forces (ground motion, water pressure and flow, ) decrease rapidly with frequency. One possibility to further reduce the vibration of the structure-girder system is to design a girder which has a higher first resonant frequency. For further studies, we have set a goal of increasing the lowest resonance frequency to 130 Hz and performed simulations to understand what modifications this would require. One way to stiffen the girder is to increase its dimensions. Simulations have shown that keeping the same material and design but increasing the girder size (6”x4” to 10”x10”) and the wall thickness (from 0.25” to 1”) lead to a lowest natural frequency of 120 Hz. Such big increase of the resonance frequency may not be necessary, but the studies have shown that significant improvement is possible with simple modification of the girder design.
In parallel with the experiments and ANSYS analysis, a semi analytical model is currently under development [8]. Based on this model, an estimation of the vibration caused by the flowing water has been computed for several cases. Results are displayed in Fig.10.
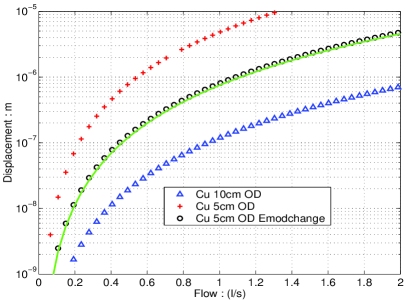
The model assumes a single pipe rigidly supported at each end, with inner diameter (ID) equal to the ID of a cooling pipe, but with a different thickness (OD). The actual OD of the structure is 5cm. In order to scale to a system with 4 pipes, rather than multiplying the result by 4, we assume that turbulence in different pipes is independent. The total amplitude can be estimated by multiplying the results by the square root of the number of pipes. This vibrational analysis model is based on a combination of observed and analytical techniques. The forcing function [8] is measured in experimental model tests and using this as input, the rms (root mean square) responses are estimated based on probabilistic methods. In order to estimate quantitatively the turbulence-induced vibrations, some empirical data have been used. The mechanical damping factor of the structure is taken equal to 0.01. The amplitude of vibrations is inversely proportional to the square root of the damping factor. The Reynolds number and boundary layer thickness relations are based on empirical data. Depending on whether the flow has a cavitating source or not, the appropriate empirical equations for turbulent power spectral density need to be employed as well.
Since our model (single pipe) is simpler than the real structure-girder system, we adjust the external diameter of the modelling pipe to match at least the main mechanical characteristics to those of the real system. In particular, we match the first resonance frequency. This can be done by either changing the OD or the Young modulus of the modelling pipe. The 3 resonant frequency for the curves in Fig.10 are respectively for the cross 47.97 Hz, for the circles 24.78 Hz and for the triangles 49.55 Hz. By artificially multiplying the Young modulus by a factor 4, we are able, for a 5cm OD structure, to obtain the right resonant frequency. We suppose that the best representation, by our semi analytical model, of the system copper structure - aluminium girder is given by taking the right dimension of the structure (5 cm) and adjusting the elastic modulus.
The theoretical results should be compared with the experimental
data obtained when the structure is fed with ”quiet” water
Fig.6. The comparison between the circles, and the
experimental results for the structure (labelled DDS), shows that
the semi-analytical model overestimates the vibration induced by
the flow, by a factor 8 at nominal flow 1 . There is
agreement for flows between 0.2 and 0.4 . It is
interesting to see that those curves can be fitted by a simple
power law :
Displacement = * Flow ;
Applying this fit on our model, Fig.10 circles,
with the chosen parameters gives :
Displacement = * Flow2.6
We also did compare our theoretical results with the analytical
formula suggested in [9]. In this case we use
the formula assuming that the frequency is equal to the the
resonance f of the mechanical system. The frequency f is not
dependent of the flow as in [9].
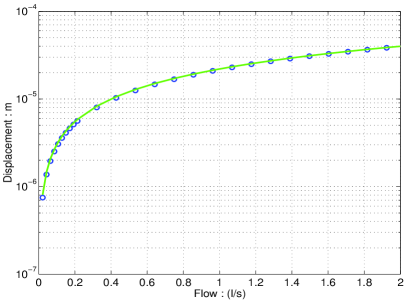
Fig.11 is the results at a 50 Hz resonant
frequency. The simple theory derived from [9]
gives a total displacement which is 200 times higher than
the reality at nominal flow ( m at 1 ,
Fig.6. Again the theory can be fitted with a power
law (green curve) :
Displacement = *
Flow0.86
In both cases, the power law fits theoretical estimation
which are derived from more complex formulae. However, the meaning
of the parameters and are not understood. We applied
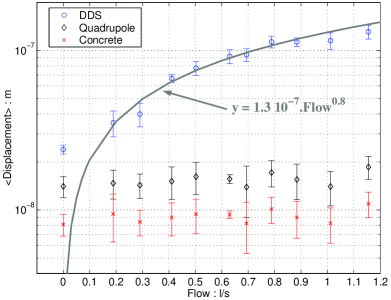
this last power fit to our structure data (DDS),
Fig.6 gray curve, and by barely changing
parameters and reducing by a factor 150, we were able to fit
them. It seems that the dependance of the vibration versus the
flow is a function with a square root dependency (0.8) rather than
a power dependency (2.5). In short, one theory predicts better the
amplitude, while the other better predicts the dependence on the
flow, and neither can be fully trusted.
6 Vibration of EM Quadrupole
The NLC project calls for maximal use of permanent magnet (PM) quadrupoles which will not need cooling water. The electromagnet quadrupoles (EM) however are also prototyped for NLC and we studied vibration caused by cooling water in such an EM quadrupole. The EM quadrupole was fed by a standard water supply at a nominal flow of 0.1 obtained with pressure difference of 8.5 bar. The quadrupole was installed on a granite table Fig.12. The table was installed on rubber pads to isolate the table from the high frequency vibration in the noisy environment where measurements were performed. This reduced the high frequency background, but significantly amplified frequencies below 6-9 Hz, making it possible to study the effect of cooling water on quadrupole vibration only above about 10Hz.
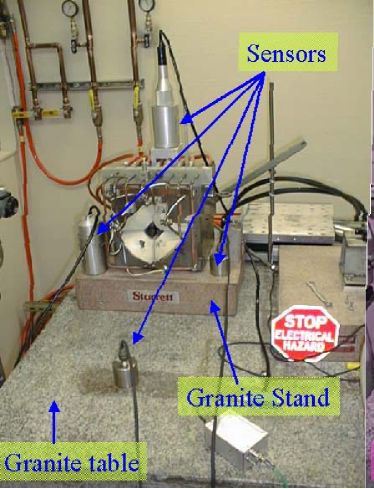
For f20Hz, the vibration induced by the flow of 0.1 in the quad is roughly 3.5 nm0.25 nm while 1 nm0.25 nm at rest (averaged on several measurements). Assuming that the additional vibration is uncorrelated, the effect due to cooling water itself is: = 3.35 nm. The result is similar if a lower cut off frequency (e.g. 15Hz) was considered, until below 10Hz where statistical error becomes too big. Note that earlier studies of FFTB quadrupole stability [10] have shown that the effect of the cooling water is on a nanometer level as well, for quadrupoles that were (in contrast to our study) also properly placed on movers.
7 Discussion
With these data, we can estimate that in the pessimistic case, if the cooling water will be similar to NLCTA (with similar pressure fluctuations), vibration of the quadrupoles will scale to about 7.6nm (2.4nm*(350nm/110nm)) due to coupling to the RF structures. In the case of EM quadrupoles, there will be about 3.3nm additional due to cooling of the quadrupoles themselves, which in total amounts to = 8.3nm. This value is below the tolerance but has little margin. However, simple design optimizations of girder or use of passive devices, such as damping materials placed in or on the girder as well as in between the water supply system and the structures in order to reduce the fluctuations of pressure P seen in the supply system, are expected to reduce these numbers considerably.
Among further studies of RF structure and quadrupole vibration planned at FNAL and SLAC are: performing measurements in a quieter place, quantifying lower frequency range; studying the case of quadrupole placed on movers and realistic independent supports; and continuing optimization of the system as a whole.
8 Conclusion
Cooling water can cause vibration of an accelerating structure
both through internal turbulence in the cooling pipes on the
structure, and through pressure fluctuations in the supply water
(external turbulence) [1]. The latter does not
depend on the flow rate through the structure and can be the
dominant source of vibration in practical situations.
For the case studied, mechanical resonances of the structure-girder
assembly explain the measured amplitudes. Optimization of design
to increase resonance frequencies is expected to reduce vibration.
Coupling from RF structure to linac quadrupoles can occur via
bellows and the support, and was measured to be at the percent
level. Present studies suggest that the vibration tolerances for
the NLC linac quadrupoles are met, but without much margin.
Optimization of the girder design to improve its vibration
properties is highly desirable and will be pursued.
9 Acknowledgments
We would like to thank C. Adolphsen, R. Assmann, M. Breidenbach, T. Raubenheimer, S. Redaelli, J. Sevilla, N. Solyak and C. Spencer for help and useful discussions.
References
- [1] F. Le Pimpec et al. Vibrational Stability of NLC Linac accelerating structure. In EPAC, Paris June, 2002.
- [2] F. Le Pimpec et al. Vibration stability of NLC linac accelerating structures and quadrupoles. In LINAC 2002, Korea, 2002. SLAC-PUB-9525 .
- [3] S. Redaelli ,R.W. Amann, W. Coosemans, W. Schnell. The Effect of Cooling Water on Magnet Vibrations. Technical report, CERN CLIC Note 531, 2002. Also at EPAC 2002.
- [4] NLC ZDR Design Group. Technical report, SLAC Report-474, 1996.
- [5] C. Adolphsen et al. Review of Superconducting vs. Conventional Accelerating Systems for Linear Colliders. In EPAC, Paris June, 2002.
- [6] C. Adolphsen Private comunication.
- [7] http://www.pulseguard.com.
- [8] S. Adiga. Turbulence Induced Vibration: Theory and Application to the Next Linear Collider. Technical report, LCC-Note-0094 To be published, 2002.
- [9] W. Schnell. Cooling and vibration in the CLIC main accelerating structure. Technical report, CERN-CLIC-NOTE-468, 2001.
- [10] R. Fenn, T. Slaton, and M. Woods. Quadrupole vibration measurements for qm1b and qc3 in the final focus test beam at slac. 2000. LCC-Note 0036.