Citation Networks in High Energy Physics
Abstract
The citation network constituted by the SPIRES data base is investigated empirically. The probability that a given paper in the SPIRES data base has citations is well described by simple power laws, , with for less than 50 citations and for 50 or more citations. Two models are presented that both represent the data well, one which generates power laws and one which generates a stretched exponential. It is not possible to discriminate between these models on the present empirical basis. A consideration of citation distribution by subfield shows that the citation patterns of high energy physics form a remarkably homogeneous network. Further, we utilize the knowledge of the citation distributions to demonstrate the extreme improbability that the citation records of selected individuals and institutions have been obtained by a random draw on the resulting distribution.
I Introduction
Recently, the study of networks has become a part of statistical physics. This connection between sociology, where social networks have been studied since the late sixties milgram:67 , and statistical physics, has arisen because the methods of statistical physics have proven to be valuable tools when analyzing a variety of complex systems; amongst these are complex networks albert:99 ; barthelemy:99 ; newman:99b ; menezes:00 ; newman:00d ; barabasi:99a ; cohen:00 ; callaway:00 ; moore:00 ; newman:00c ; barrat:00 ; moukarzel:99 ; dorogovtsev:00 ; krapivsky:00a ; dorogovtsev:00a ; kulkarni:00 ; kleinberg:00 ; watts:98 ; barabasi:99 ; kumar:00 . The real world networks that have been studied by physicists include the world wide web albert:99 ; kumar:99 ; broder:99 , the internet (the physical connections between computers) faloutsos:99 ; yook:01 ; pastor:01 , email networks newman:02 , phone call networks aiello:01 , movie actor collaboration networks newman:00c ; barabasi:99 , metabolic networks jeong:00 , the power grid of the united states watts:98 , and numerous others. Closer to the subject of the network of citations, the properties of scientific co-author networks have been studied in newman:01 ; newman:01a and modelled in barabasi:02 .
The present paper focuses on the topology of the network of citations of scientific publications. In this network every paper is a node, and an edge (i.e. a link between two nodes) arises when one paper is cited by another. Clearly, this is a directed network, that is, every edge has a direction; normally a reference from one paper to another actually rules out a reference in the other direction (reciprocity ). The data presented in this paper is the number of citations accumulated by each paper; we do not have access to the list of references for each paper. Therefore, we will mainly be concerned with the in-bound degree (citation) distribution of papers in the SPIRES data base.
In addition to the pure theoretical interest in complex networks, the subject matter of this paper should be of interest to physicists for a completely different reason. It has been recognized since the early 1970s that citations can provide a quantitative measure of scientific excellence isi:02 . Many studies (e.g., adam:02 and references therein) have shown that this tool must be used with considerable care. Different scientific environments have different publishing and citation habits, and these differences must be reconciled before comparisons can be made across field boundaries. Nevertheless, citation studies have become a standard measure for the evaluation of journal impact or of the quality of university departments. Just as a study of email networks can enlighten us about the spread of computer viruses, and a study of the structure of the internet can be used to estimate the amount of damage caused by router breakdown, the study of citation networks can help us understand and quantify scientific excellence.
Past investigations
Given the level of interest in complex networks and citation data, surprisingly few serious studies of citation networks have been performed by physicists. In 1957 Shockley shockley:57 argued that the publication rate for the scientific staff at Brookhaven National Laboratory was described by a log-normal distribution. In 1998, Laherrere and Sornette Laherrere:98 suggested that the number of authors with total citations, , of the 1120 top-cited physicists from 1981 to 1997 is described by a stretched exponential (, ). Note however that this study focuses on the total number of citations of topcited authors and not on the distribution of citations of publication as is the case in the present paper. Also in 1998, Redner redner:98 considered data on papers published in 1981 in journals catalogued by the ISI as well as data from Phys. Rev. D vols. 11-50 and concluded that the large- citation distribution is described by a power-law such that with .
In the present paper, the statistical material is of a much higher quality than in the papers mentioned above; we present the results of a study of the SLAC SPIRES data base 111http://www.slac.stanford.edu/spires/hep. The ISI data set studied in redner:98 is materially larger (783,339 papers) than SPIRES data set. However, the ISI data used by Redner contains papers published in a single year in a variety of scientific disciplines (including medicine, biology, chemistry, physics, etc.). There are neither a priori arguments nor data to indicate that citation patterns in these fields are sufficiently uniform to justify their treatment as a single data set. The SPIRES hep data is collected from a well-defined area within physics, i.e. high energy physics, and has been accumulated systematically by the SLAC library since 1962 oconnell:02 .
To be specific, the data used below was retrieved from the SPIRES mirror at Durham University on August 14, 2002. We will henceforth refer to this as the SPIRES data base. Since the SPIRES data base is dedicated to papers in high energy physics, it is natural to assume that it is relatively homogeneous. One of the purposes of the present work is to determine the extent to which citation patterns in the categories of theory, phenomenology, experiment, instrumentation, and reviews are in fact comparable. We will then present the citation probability for the SPIRES data base.
II The citation distribution
Basic statistics
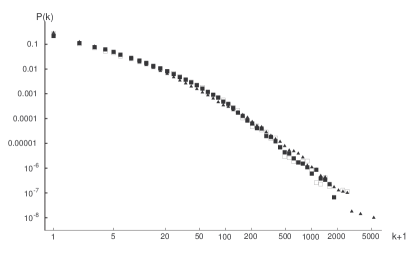
The SPIRES data base contains 501,531 papers. Of these papers there are 196,432 non-journal papers (e.g. preprints and conference proceedings) for which citation information is not available. A fraction of the remaining papers seem to have been removed from the data base. In other cases, subfield designations are not available. Thus, we have restricted our attention in the following to the network of 281,717 papers (i.e. roughly 56% of the SPIRES data base) for which both citation information and subfield designations are available. Table 1 shows the probability, , of a SPIRES paper having citations for . An “atomic” histogram of the full citation data is shown in Figure 1.
| Theory | 0.2884 | 0.1226 | 0.0815 | 0.0590 | 0.0472 |
|---|---|---|---|---|---|
| Phenomenology | 0.2150 | 0.1103 | 0.0762 | 0.0618 | 0.0488 |
| Experiment | 0.2677 | 0.1023 | 0.0704 | 0.0518 | 0.0441 |
| Instrumentation | 0.6169 | 0.1206 | 0.0622 | 0.0385 | 0.0267 |
| Review Articles | 0.2167 | 0.1038 | 0.0670 | 0.0496 | 0.0403 |
| Total | 0.2901 | 0.1171 | 0.0775 | 0.0574 | 0.0458 |
One of the most striking features of this data set is the large number of papers (some 29%) which are uncited. Note that we have not applied any correction for self-citation. The removal of self-citations would make the fraction of uncited papers materially higher. In the same vein, 74% of the papers in our network have 10 or less citations. In contrast, 6.2% of the papers have 50 citations or more and only 131 papers () are cited 1000 times or more. The mean number of citations in this sample is 14.6, which is considerably larger than the median of 2.3 citations, implying that a paper with the average number of citations is substantially more cited than the “average” paper. The large factor between mean and median citations suggests that the citation distribution has a very long tail with a small fraction of highly cited papers accounting for a significant fraction of all citations. This is indeed the case. Approximately 50% of all citations are generated by the top 4% of the all papers; the lowest 50% of papers generates only 2% of all citations. The rates of citation production by these two parts of the data set differ by a factor of approximately 310. These observations regarding citations in SPIRES suggest that the citation distribution follows a power law. As we shall see, this is qualitatively correct.

Figure 1 shows a log-log representation of the distribution of citations in the SLAC SPIRES data base. The data suggest that this citation distribution is remarkably well described by two power laws. The distribution, , is approximately proportional to for and to for . Before turning to a more quantitative description, we consider the homogeneity of the SPIRES data.
Homogeneity of the data base
Even though the SPIRES data base is devoted exclusively to papers in high energy physics, it is relatively easy to imagine mechanisms which could lead to different citation patterns and thus different network topologies in the five different subfields into which the SPIRES data base is divided; these fields are theory, experiment, phenomenology, reviews, and instrumentation. Experiments in high energy physics are expensive and manpower intensive. Program committee approval is tantamount to a pre-review of the work. The number of co-authors is large. Under such conditions, it might be reasonable to expect rather fewer minimally cited papers. By contrast, the number of co-authors of papers in the theory and phenomenology sections of SPIRES is far smaller, and the relatively low cost of such work permits the production of papers which might not survive pre-reviewing. In short, theory and phenomenology subfields might have a larger probability for minimal citation. Similarly, one could argue that review papers, which are often “commissioned” by journals and frequently written by recognized experts, might enjoy higher citation rates—just as one could conceive of mechanisms such that the instrumentation subfield might include more minimally cited papers. With such a priori expectations, it is of obvious importance to determine citation distributions separately for each subfield. Fortunately, SPIRES is well-suited for such a study.
Some indications of the differences between the five categories can be seen from Table 1. The probability of having citations is , , , , and % for theory, experiment, phenomenology, reviews, and instrumentation, respectively. While the fraction of minimally cited review papers is clearly smaller than that for the full data set, this effect is not dramatic. Instrumentation papers, however, stand out. The probability that an instrumentation paper will receive citations is almost times smaller than that for the full data. The differences between citation probabilities in theory, experiment and phenomenology are surprisingly small. These trends are supported by the full data set. We find, for example, that only 146 of the 19,637 instrumentation papers () have 50 or more citations. This is to be compared with 6.2% for the full data set. By contrast, approximately % of review papers have citations. The % of review papers with citations is significantly larger than the probability of % for the complete data set. In short, instrumentation and review papers, which account for some 9% of the full data set, clearly follow different citation distributions. This can reflect a different underlying dynamical picture for citations in these categories; it can also be an indication that review papers have a higher average quality and instrumentation papers a lower. Whatever the explanation, we choose to exclude these two small categories from further consideration. Any decision to use citation data as a measure of scientific “quality” should not be made so lightly. Ultimately, however, it must be based on a subjective evaluation of the relative quality and importance of papers published in the various categories.
The homogeneity of citation patterns in the categories of theory, experiment and phenomenology is supported by the binned histograms show in Figure 2. Given the logarithmic scale of this figure, the three citation distributions are essentially indistinguishable over the full range of to citations. This agreement is remarkable in view of the fact that it persists over almost seven orders of magnitude. Phenomenology and experiment are in the best agreement with a maximum discrepancy of some % found in the vicinity of . The maximum discrepancy of approximately % between theory and the other two categories is also found in the vicinity of with materially smaller discrepancies for other values of . It would be valuable to know if these differences are “statistically significant”. To this end, it is tempting to assign errors in each bin proportional to the square root of the number of papers in each bin and perform a fit. This temptation should be resisted. The assumption required for such an exercise to be meaningful is, of course, that the data in the various bins is statistically independent. This assumption, which can be demonstrated to be false, is in evident contradiction with our reason for studying citation distributions in the first place: We believe that there is a positive correlation between the intrinsic quality of a scientific paper and the number of citations which it receives, and we also believe that “good” papers are produced by “good” scientists. The consistency of these three data sets is, however, sufficient for many applications. In the following, we will work with this final data set of 257,022 articles. The resulting distribution is shown in Figure 3.
There is another and quite different potential source of inhomogeneity in the SPIRES data base. The distribution of the number of authors who have written papers is a monotonically decreasing function of . Approximately % of the individual authors in the theory data set have written a total of less than 20 papers. Presumably, this effect is due to the large number of young physicists who leave academic physics either immediately following their PhD or relatively soon after. Thus, we have also considered citation probabilities for papers collected author-by-author. The reason we have solely considered the theory subset is that the author-by-author data unavoidably weighs papers by the number of coauthors. As we have noted earlier the theory subset has fewer authors per paper (typically 1-3) than for instance the experiment subset where some papers have as many as 1500 authors. For the theory data, the resulting distribution is similar to that of Figure 3, but not identical. The virtue of such an author-by-author approach is that it allows us to exclude authors on the basis of the total number of papers they have produced. For example, we have compared the citation distributions of papers by all authors with that of papers written (or co-written) by authors with more than 20 total papers. The differences are extremely small (i.e., similar to those seen in Figure 2) and again indicated the striking homogeneity of the SPIRES data base.
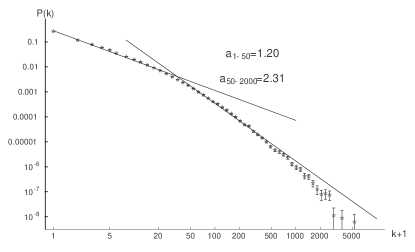
The form of the distribution
Having established the homogeneity of the bulk of the data base or equivalently the homogeneity of sub-network topologies, we now turn to a closer look at the form of the distribution. It is clear from the figures that the distribution cannot be described by a single power law over the entire range of citations. It is, however, approximated well by two independent power laws in the low () and high () domains. Thus, in each region with and . If we insist on a relative normalization such that the two forms are equal at and chose the global normalization to ensure that the total probability is , the data is reproduced with surprising accuracy.
We believe that these different power laws probably reflect differences in the underlying dynamics of citations in the high and low citation regions. That different dynamics rule the two regimes seems clear. The bulk of the papers in the minimally cited part of the distribution are “dead” in the sense that they have not been cited within the last year or more (and will probably never be cited again). Of course, this part of the distribution also contains vigorous young papers of high quality whose citation count is increasing. However, dead papers vastly outnumber the live population. In the highly cited region, virtually all papers are still alive, with even the oldest of them acquiring new citations regularly. It seems highly likely that citation patterns for such papers are quite different from those of minimally cited papers that are most often cited only by the author and close colleagues. Further considerations regarding the temporal evolution of citation networks can be found in redner:98 and for the SPIRES hep data base in particular, in a forthcoming paper by the present authors.
The asymptotic tail
We now consider the large- tail of the distribution. Data is too sparse for a direct analysis in the region of 2000–5000 citations. Thus, in redner:98 a Zipf plot is used to highlight this section of the distribution. A Zipf plot is a plot of the th ranked paper versus the number of citations of this paper, . (The most cited paper is assigned rank .) The intuitive reason why the Zipf plot is well suited for analyzing the large- data is that it provides much higher resolution of the high citation end of the distribution. On a doubly logarithmic scale, the high citation data is placed at the beginning and is not as compressed as in the plots of versus shown in Figures 1–3. Figure 4 is a Zipf plot of the final data set.

In reference redner:98 a similar Zipf plot is used to argue that the large- tail of the ISI citation distribution for scientific papers appeared to be governed by a power law, . This is not the case for the SPIRES data. Indeed, Figure 4 indicates that the large- tail of this highly homogeneous data set is not described by any asymptotic power-law. The same conclusion can be drawn from Figure 3, where a simple power law in the high citation region tracks the data accurately through four decades until the data begins to cut off. Although the high- data is sparse, one can present more quantitative indications of this cut off. If the power-law seen in figure 3 applied for arbitrarily large , as proposed by redner:98 , we would expect to find 33 papers with more citations than the maximum 5242 citations actually found in the data set. The most cited of these papers should have approximately 55,000 citations. Assuming an asymptotic power-law, the probability of drawing 257,022 papers at random with no paper having more than 5242 citations is approximately .
There is a simple explanation for the large- data which seems reasonable for a data set like SPIRES, which contains a significant number of truly important papers. Papers of high quality and lasting importance can literally be ‘canonized’ and pass into the received wisdom of physics which no longer requires citation. Many theoretical physicists publish about ‘Goldstone bosons’, but few feel the need to cite the original papers. Indeed, the careful reader will stop to think what special point is being made when Einstein is cited on special relativityeinstein:05 . Since only “mortals” are cited, the power law must end. In the absence of such a cut off, reference einstein:05 should have been cited by 20% of the papers in SPIRES. This does not seem unreasonable.
Ambiguity of representation
Because of the cut-off for the high-citation data, there is a certain ambiguity in determining which mathematical representation should be chosen for the citation distribution. This ambiguity can be illustrated by an example. We have modelled the citation distribution using modifications of the scale free model proposed by Barabási and Albert barabasi:99 . Model starts out with papers with one citation (one incoming edge). At each time step a paper is added that has one citation and references (outbound edges). Each of these references link to a paper already in the data base with probability , proportional to the number of inbound edges of node , raised to some power , that is, .
To solve model analytically, one can for instance use the rate equation approach proposed in krapivsky:00a . The solution that is relevant for our data is valid in the regime and in the limit of many time steps; solving the rate equation under these constraints yields the in-degree distribution
| (1) |
where is defined (implicitly) by . This probability is well approximated by
| (2) |
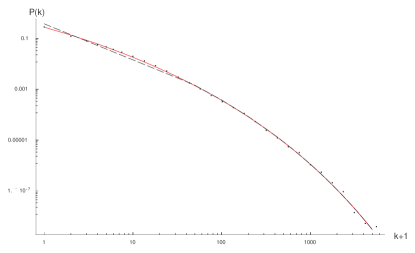
In Figure 5, we have plotted the binned data from the theory subset along with the exact solution (Eq. (1); solid line) and the approximation (Eq. (2); dashed line). The fit is excellent.
Now, let us look at another variation of the model from before, model . In this version, each paper comes with “ghost citations” and references as before; we set , so that . Proceeding as in the case above, model can be solved to yield (with the ghost citations subtracted)
| (3) |
for the citation distribution in model .
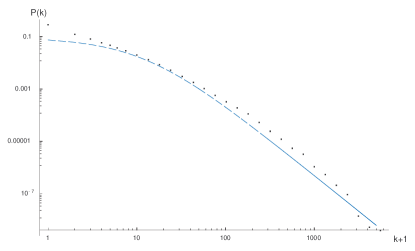
The probability is an asymptotic power law; in the limit , we have that , where . The fit to the data is not as compelling as for model , but it precisely illustrates the ambiguity in deciding on how to represent the data. We have two representations of the data with very different mathematical properties (the stretched exponential and the asymptotic power law). Within the range of ’s available before the cut-off sets in, it is difficult (quantitatively) to discern the power law from the stretched exponential representation when comparing with the data—especially so on a log-log scale. In the highly cited regime, where the exponential begins to dominate Equation (2), and the differences of the two representations begin to manifest themselves, the presence of the cut-off makes us unable to draw any conclusions on which representation to choose, as is amply underlined by Figures 5 and 6.
We believe that the mechanisms behind the cut-off are real, but on the basis of the data available to us at the moment, it is impossible to estimate its impact on the citation distribution. In the same vein, we find it probable that the two power laws reflect different dynamics in the high and low citation regime, but as it is reflected in the minimal models described above, it is of course also possible to take a different stand and claim that the distribution of citations has stretched exponential nature. Using arguments similar to those of the last section, drawing on the probability distribution defined by Equation (2), we would expect to find a little less than 1 paper with more than citations, if this distribution applied to arbitrarily large ; with a data set of papers, we would expect the maximally cited paper to have about 4,700 citations. Again, this fidelity to the data is alluring, but with the data available to us at the moment it is impossible to draw decisive conclusions either way.
This conundrum has been frequently encountered in the literature. In the case of distributions of citations, ref. Laherrere:98 found the distribution of citations of scientists to be a stretched exponential, whereas it was argued in redner:98 that the citation distribution of papers was described by an asymptotic power law. The same data was attempted fitted to a curve in a later paper tsallis:99 . As demonstrated above, our data is of a much higher quality than the ISI and PRD data sets discussed in these two papers, but it seems to be the case that even with access to the highly homogeneous SPIRES data base, the cut-off mechanism still leaves room for speculation as to the topology of the citation distribution. Arguments regarding the “microscopic” citation mechanisms will have to be made before any model of the citation network based on the data presently available can be taken seriously.
Proceeding to a more general arena, the very same problem also appears in other complex networks. For instance, Newman describes the distribution of the number of collaborators per publication in different data bases (amongst these, SPIRES) as a stretched exponential newman:01c , but having acquired more statistical material, the very same distribution is tentatively described as two power laws newman:01 (after inspiration from barabasi:02 ). In conclusion: For the range of ’s available to us, both the two-power-law structure and the stretched exponential are reasonable fits to the data.
III An application
Having determined the form of the distribution of the SPIRES data base and demonstrated its homogeneity, it is interesting to show that it can be put to practical use. Here, we present one such application. The “citation summary” option in the SPIRES data base returns the number of papers for a given author with citations in each of six intervals. These intervals and the probabilities revealed by our analysis that papers will fall in these bins are given in Table 2. The probability, , that an author’s actual citation record of papers was obtained from a random draw on the citation distribution is readily calculated by multiplying the probabilities of drawing the author’s number of citations in the different categories, , and correcting for the number of permutations.
| Paper category | Citations | Probability |
|---|---|---|
| Unknown papers | 0 | |
| Less known papers | 1–9 | |
| Known papers | 10–49 | |
| Well-known papers | 50–99 | |
| Famous papers | 100–499 | |
| Renowned papers | 500+ |
If a total of papers were drawn at random on the citation distribution, the most probable result, , would correspond to papers in each bin. The quantity
is a useful measure of this probability which is relatively independent of the number of bins chosen. Since provides completely objective information about the probability of drawing a given citation record at random given knowledge of citation patterns in that field, it is particularly well-suited for comparisons between fields. It is equally meaningful to calculate for authors who publish in several fields. The leap from the improbability of a given author’s citation record to conclusions regarding author quality requires certain assumptions which cannot be tested. For example, to compare citation records in the instrumentation category with those in the remainder of our data set, it is necessary to make some a priori assumption about the relative intrinsic quality of the two data sets. While the “democratic” assumption of equal intrinsic quality is easiest, it may or may not be accurate. (In a Bayesian sense, it is necessary to establish a prior distribution.)
Consider the following two authors in the SPIRES data base. Author A has a total of 200 publications with 17, 70, 82, 23, 8, and 0 publications in each of the bins above and an average of 26 citations per article. Author B has a total of 176 publications with 18, 79, 57, 10, 9, and 3 publications in each bin and an average of 46. A simple calculation reveals that for Author A and for Author B. The minimum value of is evidently . The maximum value of in the current data set is found for Author C, who has a total of 217 publications with 5, 14, 38, 30, 97, and 33 publications in each of the bins above and an average of 259 citations per article. This leads to vastly improbable value of . With a total of 56224 citations, Author C accounts for more than 1.5% of all citations in the data set. There are also indications of less favorable correlations. Author D has a total of 41 publications with 18, 23, 0, 0, 0, and 0 in each of the bins above and an average of citation per article. This resulting value of underscores the fact that an improbable citation record is not necessarily a “good” one.
Given the total population of authors in SPIRES, these numbers offer an objective indication of the extreme improbability that the citation records of Authors A, B, and C were drawn at random. These examples are far from exceptional. There are strong correlations in the citation data, and they merit quantitative study. The differences between the Authors A and B can appear surprising at first glance and emphasize the importance of a priori criteria. Although Author B has an average citation rate almost twice that of Author A, his citation record is more probable by a factor of . This is a natural consequence of the power law distribution which makes it far more improbable to have 10 papers with 100 citations each than one paper with 1000 citations. The question of which of these options is “better” requires a subjective answer, and it is unlikely that any single quantitative measure will satisfy everyone. Thus, although the interpretation of non-statistical fluctuations in individual citation records is subjective, the likely presence of such fluctuations can be identified with ease and objectivity.
It is as easy to calculate the for departments as for individual authors. Physics Department , which includes Author C, published a total of 1309 papers from 1980 to 2000, distributed with 81, 324, 474, 175, 216, 39 papers in the citation summary bins. This results in a . Physics Department , which includes Authors A and B, published a total of 1309 papers during the same period with , , , , , . This yields the somewhat smaller value of . Such information can be of practical value since it is seems likely that the “most improbable” departments will have the greatest success in attracting the “most improbable” authors.
IV Summary and Conclusions
We have considered the citation distribution of for 257,022 articles in the SPIRES data base and demonstrated the homogeneity of topologies in the categories of theory, experiment and phenomenology. The resulting data set can be reasonably described by a simple power law with different exponents in the low and high citation regions or a stretched exponential. Power law behavior is a trait that the SPIRES data base shares with many other real world networks, most notably the www albert:99 ; kumar:99 ; broder:99 . It is clear that the structures of these two networks are similar in many ways, with scientific papers corresponding to .html documents. There are differences, however. For example, because scientific papers are printed, links are rarely bi-directional (reciprocity ); this is not the case for the www, where a non-vanishing fraction of web-pages are bi-directional in spite of the directed nature of hyperlinks.
The most striking features of the data include the extremely large number of minimally cited papers and the fact that a remarkably small number of papers (4%) account for half of the citations in the data set. While it is a truism that progress in physics is driven by a few great minds, it can be disturbing to confront this quantitatively. The picture which emerges is thus a small number of interesting and significant papers swimming in a sea of “dead” papers. This has the practical consequence that any study seeking to understand the dynamics of interesting papers will be forced to discard most papers and accept the greatly increased statistical uncertainties. In the case of the SPIRES data set, this would amount to roughly 10,000 papers.
In fact, the situation is even more dramatic due to the strong correlations in the data set when considered as a function of individual authors or individual institutions. As we have seen in the case of Author C above, a single author accounts for more than 1.5% of all citations in the SPIRES data set. Seven authors, not necessarily the highest cited, account for 6% of all the citations. We have suggested the measure of “unlikelihood”, , defined above as a useful indicator of the presence of such correlations. Further, this measure offers a tool for comparing citation records in different fields with a known and controllable bias. (Any comparison across field boundaries must necessarily involve unsupported assumptions and biases. It is best to make such assumptions visible and to discuss them.) It would be extremely valuable to perform “longitudinal” studies of citation data collected as separate events. (An “event” here would be the citation record of a single individual or single institution.) This would permit a far more systematic study of the nature of the statistically independent correlations and the probabilities with which they occur. These strong correlations in the network separates this particular network from many other small-world networks, and constitute yet another difference between the www and the network of scientific citations.
We emphasize that no single measure, such as our or the more traditional average number of citations per paper, can claim to capture the richness of either the full citation data set or individual citation records. While this is obvious from the presence of strong correlations in the data, it is also supported by the dramatic difference between the mean and median number of citations in the global distributions reported here. For this reason, we believe that the value of large data bases such as SPIRES and ISI would be greatly enhanced if global citation distributions, such as that given in Figure 3 above, were collected by subfield and made available to the users of these data bases.
Acknowledgements.
The authors would like to thank the helpful staff at the SPIRES data base and its DESY and Durham mirrors, especially Heath O’Connell and Travis C. Brooks at SLAC and Mike Whalley at Durham University.References
- (1) S. Milgram. The small world problem. Psychology Today, 2:60–67, 1967.
- (2) A. Albert, H. Jeong, and A.-L. Barabási. Diameter of the world-wide web. Nature, 401:130–1, 1999.
- (3) M. Barthélémy and L.A.N. Amaral. Small–world networks: Evidence for crossover picture. Physical Review Letters, 82(15):3180–3, 1999.
- (4) M. E. J. Newman and D. J. Watts. Scaling and percolation in the small–world network model. Physical Review E, 60(6):7332–42, 1999.
- (5) M. A. de Menezes, C. F. Moukarzel, and T. J. P. Penna. First-order transitions in small-world networks. Europhysics Letters, 50(5):574–79, 2000.
- (6) M. E. J. Newman, C. Moore, and D. J. Watts. Mean–field solution of the small–world network model. Physical Review Letters, 84(14):3201–4, 2000.
- (7) A-. L. Barabási, R. Albert, and H. Jeong. Mean-field theory for scale-free random networks. Physica A, 272:173, 1999.
- (8) R. Cohen, et al. Resilience of the internet to random breakdowns. Physical Review Letters, 85(21):4626–8, 2000.
- (9) D. S. Callaway, M. E. J. Newman, S. H. Strogatz, and D. J. Watts. Network robustness and fragility: Percolation on random graphs. Physical Review Letters, 85(25):5468–71, 2000.
- (10) C. Moore and M. E. J. Newman. Epidemics and percolation in small–world networks. Physical Review E, 61(5):5678–82, 2000.
- (11) M. E. J. Newman, S. H. Strogatz, and D. J. Watts. Random graphs with arbitrary degree distributions and their applications. Physical Review E, 64:026118:1–17, 2001.
- (12) A. Barrat and M. Weigt. On the properties of small-world network models. European Physics Journal B, 13:547–60, 2000.
- (13) C. F. Moukarzel. Spreading and shortest paths in systems with sparse long-range connections. Physical Review E, 60:R6263–66, 1999.
- (14) S. N. Dorogovtsev and J.F.F. Mendes. Exactly solvable small-world network. Europhysics Letters, 50(1):1–7, 2000.
- (15) P. L. Krapivsky, S. Redner, and F. Leyvaraz. Connectivity of growing random networks. Physical Review Letters, 85(21):4629–32, 2000.
- (16) S. N. Dorogovtsev, J.F.F. Mendes, and A. N. Samukhin. Structure of growing networks with preferential linking. Physical Review Letters, 85(21):4633–6, 2000.
- (17) R.V. Kulkarni, E. Almaas, and D. Stroud. Exact results and scaling properties of small–world networks. Physical Review E, 61:4268–71, 2000.
- (18) J. M. Kleinberg. Navigation in a small world. Nature, 406:845, 2000.
- (19) D. J. Watts and S. H. Strogatz. Collective dynamics of “small-world” networks. Nature, 393:440–2, 1998.
- (20) A.-L. Barabási and R. Albert. Emergence of scaling in random networks. Science, 286:509–12, 1999.
- (21) R. Kumar, et al. Stochastic models for the web graph. In Proceedings of the IEEE Symposium on Foundations of Computer Sience, pages 57–65, New York, 2000.
- (22) R. Kumar, et al. In Proceedings of the 9th ACM Symposium on Principles of Database Systems, 1999.
- (23) A. Z. Broder, S. R. Kumar, F. Maghoul, P. Raghavan, S. Rajagopalan, R. Stata, A. Tomkins, and J. L. Wiener. Graph structure in the web, www9. Computer Networks, 33(1-6):309–20, 2000.
- (24) M. Faloutsos, P. Faloutsos, C. Faloutsos. On power-law relationships of the internet topology. Computer Communications Review, 29:251–262, 1999.
- (25) H. Jeong, S.-H Yook and A.-L Barabáasi. Modeling the internet’s large-scale topology. preprint: cond-mat/0107417, 2001.
- (26) R. Pastor-Satorrasand and A. Vespignani. Epidemic spreading in scale-free networks. Physical Review Letters, 86(14):3200–2, 2001.
- (27) M. E. J. Newman, S. Forrest, and Justin Balthrop. Email networks and the spread of computer viruses. Physical Review E, 66:035101–1–4, 2002.
- (28) W. Aiello, F. Chung, and L. Lu. Random evolution in massive graphs. In James Abello et al., editor, Handbook on Massive Data Sets. Kluwer Academic Press, Handbook on Massive Data Sets.
- (29) H. Jeong, B. Tombor, R. Albert, Z. N. Oltvai, and A.-L. Barabási. The large-scale organization of metabolic networks. Nature, 407:651, 2000.
- (30) M. E. J. Newman. Scientific collaboration networks. I. Network construction and fundamental results. Physical Review E, 64:016131–1–016131–8, 2001.
- (31) M. E. J. Newman. Scientific collaboration networks. II. Shortest paths, weighted networks, and centrality. Physical Review E, 64:016132–1–016132–7, 2001.
- (32) A-.L. Barabasi et al. Evolution of the social network of scientific collaborations. Physica A, 311, 2002.
- (33) Science Citation Index. http://www.isinet.com/isi/. This website contains a great deal of historical information on the history of counting scientific papers.
- (34) David Adam. The counting house. Nature, 415:726 – 729, 2002.
- (35) W. Shockley. On the statistics of individual variations of productivity in research laboratories. Proceedings of the Institute of Radio Engineers, 45:279 – 290, 1957.
- (36) J. Laherrere and D. Sornette. Streched exponential distributions in nature and economy: ”fat tails” with characteristic scales. European Physical Journal B 2, pages 525 – 539, 1998.
- (37) S. Redner. How popular is your paper? an emperical study of the citation distribution. European Physics Journal B, 4:131–4, 1998.
- (38) H. O’Connell. Physicists thriving with paperless publishing. High Energy Physics Libraries Webzine, March 2002. http://library.cern.ch/HEPLW/6/papers/3/.
- (39) A. Einstein. Zur elektrodynamik bewegter körper. Annalen der Physik, 17:891, 1905.
- (40) C. Tsallis and M. P. de Albuquerque. Are citations of scientific papers a case of nonextensivity. European Physics Journal B, 13:777–80, 1999.
- (41) M. E. J. Newman. The structure of scientific collaboration networks. Proceedings of the National Academy of Sciences. USA, 98(2):404–9, 2001.