Laser gas-discharge absorption measurements of the ratio of two transition rates in argon
Abstract
The ratio of two line strengths at 922.7 nm and 978.7 nm of argon is measured in an argon pulsed discharge with the use of a single-mode Ti:Sapphire laser. The result 3.29(0.13) is in agreement with our theoretical prediction 3.23 and with a less accurate ratio 2.89(0.43) from the NIST database.
pacs:
39.30.+w, 32.70.Cs, 32.80.-tI Introduction
We have recently developed a theory for particle-hole states of closed-shell atoms that is potentially able to predict energies and transition rates with high precision. Initially, this theory has been tested in neon Savukov et al. (2002); Savukov (2002). For transitions between neon excited states the accuracy of experiments is very good and experiments agree well with our theory. However, for heavier noble gas atoms, experiments are often prone to systematic errors and the precision is much lower. For example, many absolute transition rates of argon were based on high-pressure arc plasmas and depended on the assumption of local thermodynamic equilibrium of the upper state populations which often was satisfied very approximately (see discussion in Ref. A. Hirabayashi and Fujimoto (1987)). Lifetime measurements using different techniques or even the same technique often yield quite different results. In Ref. Wiese et al. (1989), a unified set of atomic probabilities for neutral argon is given. The data are obtained from extensive analysis of existing experiments and from new measurements of emission in the broad range 240-18000 nm. The data are included in the NIST data base. Errors of order 10% are quoted. Although our theory is able to reproduce NIST data, the difference between experiment and theory often exceeds quoted in Ref. Wiese et al. (1989) error bars. There are two possibilities: (i) the theory is less accurate and needs to be improved, (ii) experimental error bars are larger and critical, more precise measurements are needed. Therefore, the accurate measurements presented in this paper are well motivated.
We describe a new experimental technique for precise measurements of ratios of transition rates in gas discharges and detail an apparatus realizing this technique. We demonstrate our measurement of the ratio of two argon transitions and analyze systematic errors. Finally, we present a comparison with our theory and other theories and experiments.
II An experimental technique for accurate measurements of transition rate ratios
The essential goal of the experimental technique is to measure the relative absorption rates for two different transitions that start from the same level. In general, the populations of the lower and upper states are needed for finding the cross-section from the absorption coefficient ,
| (1) |
(here and are densities of atoms in the initial and final states, is the ratio statistical weights), but in some cases the upper state population can be neglected. This happens when the initial state is the ground or long-lived metastable state, and the final, upper states are short-lived and relatively unpopulated. In gas discharges, at low current densities, metastable levels are generally much more populated than any other non-metastable excited levels. Experimentally, we also observed states that have allowed decay modes. The and states, surprisingly, were populated almost as much as metastables at pressure of a few Torr. The observed lifetimes of these states are of the order of ten microseconds. The principal explanation for such a slow decay is radiation capture: many possibilities of emission and absorption of a photon occur before the photon can leave the discharge cell. The observation of long-lived species in discharges gives the possibility to use them as lower states for absorption measurements. The other excited levels (not belonging to the 4s group) quickly decay radiatively without radiation capture and are effectively depopulated in a pulsed discharge as soon as the discharge current disappears. Therefore, in upward transitions that start from the 4s levels, the condition is satisfied, and the absorption becomes proportional just to the cross-section and the initial density. Thus, by measuring the absorption for two transitions starting from the same level, in our experiment , we can find the ratio of cross-sections from the ratio of absorptions,
| (2) |
For a Doppler broadened profile and for monochromatic laser light tuned to the maximum of the profile, the ratio of cross-sections is equal to the ratio of line strengths
| (3) |
Therefore by measuring the ratio of absorptions for two transitions, we can find the ratio of line strengths , the important parameter that can be compared with other experiments and with theory. The situation described above is ideal for precise measurements of transition rate ratios: it has been very closely reproduced in alkali vapor experiments, in which for Cs an accuracy of better than 0.1% is claimed by Rafac and Tanner (1998). However, in the case of noble gases, especially when we choose the starting level to be a non-metastable state, a more complicated analysis is required.
In order to satisfy the condition for the lowest excited states, we use a pulsed rather than a DC discharge. In a DC discharge this condition is weaker, because radiatively decaying levels are constantly repopulated by collisions with hot electrons and by decay of higher levels. It is especially true for radiation-capturing levels. A further advantage of a pulsed discharge is the possibility for enhancing the signal by utilizing its time dependence. For example slow fluctuations in laser intensity can be excluded. In addition, the signal-to-noise ratio can be improved using averaging (128-scan in our experiment) on a digital oscilloscope. Without special efforts an absorption of order 0.1% can be easily detected. Such high sensitivity is useful for fast and precise tuning of the laser to centers of Doppler profiles which is needed if only one laser is available. The long-term stability of the pulsed discharge is also better: the pulsed discharge has substantially smaller sputtering and thermal effects, since the total charge from the discharge current is much smaller for a pulsed discharge.
The principal disadvantage of the pulsed discharge is the more complicated analysis of systematic errors, basically owing to the finite-time response of the detection system. The various factors that can influence the measurement of the ratio in pulsed discharges need careful analysis: we will consider systematic errors that arise from large absorption and inhomogeneity. When two transitions differ by a factor of at least three, a larger absorption is recommended for better signal-to-noise ratio. In such a case the linear relation between absorption and line strength may no longer hold, and instead Beer’s law must be used to derive the more general equation:
| (4) |
Here and are the reductions in the intensity after passing the absorber for the first and the second transitions, respectively. This nonlinear equation can be the cause of several systematic errors.
One effect arises from a slow response of the detection system. This results in a reduction of actual height of the peak by an unknown coefficient :
| (5) |
If the equations were linear, this coefficient would drop out from the ratio, but for large and significantly different absorptions for the two transitions, it will cause a systematic error in the ratio. The other effect arises from inhomogeneity. So far we assumed that the absorption medium is homogeneous, but in gas discharges this is far from being true. The discharge produces densities of excited atoms with some transverse and longitudinal distributions. The longitudinal distribution does not cause any problem, since for two transitions the ratio at each small length of path stays the same, and eventually the ratio of logarithms of intensities in Eq. (4) will remain the same. The transverse distribution, however, will cause a deviation from the simple Beer’s law and will require the analysis of this distribution.
For a cylindrical discharge cell, which we use in our experiment, if is the distance from the axis, an integration over is needed,
| (6) |
where is the input laser beam intensity, is the absorption coefficient, and is integrated over a detector area output intensity after an inhomogeneous discharge medium. For simplicity in this equation the change in absorption along the laser beam is ignored. It is difficult to find the spatial distribution accurately, although in some simple cases it can be predicted. In the case of a diffusion controlled cylindrical discharge, the distribution for the electron density and for excited state densities, has approximately the form of a Bessel function,
| (7) |
The expression for the electron density is taken from Ref. Raizer (1991), p. 67. Using the series expansion of the Bessel function for small argument, we can show that in our experiment with cm and cm, the maximum change in the absorption over the beam radius is 3.7% and the change in the integral for small is only 1.8%. Therefore the effect of the distribution is small. Moreover, if the absorption is not very large, the exponential can be expanded, and the linear dependence of the signal on the absorption coefficient can reduce further the effect of the distribution. If we examine NIST transition data nis for neutral argon, we find many transitions in the range of tunable lasers such as a Ti:Sapphire laser, which can be used for the absorption experiments. However, in practice there are some restrictions: first, the pair of transitions has to start from the same metastable levels or radiation-capturing levels such as mentioned above. Second, the range is greatly restricted by the tunability of the laser: for example, our Ti:Sapphire laser has several mirror sets for several ranges of wavelengths. Because the change of mirrors takes many hours to complete, only one mirror set can be used for measurements of ratios at one time. As a result, for our currently installed mirror set, only two pairs of transitions were appropriate. However, our laser could not be tuned for one transition, and we ended up able to make measurements for only one pair of transitions: one transition at a wavelength 9227 Å and the other at 9787 Å.
III Experimental arrangement
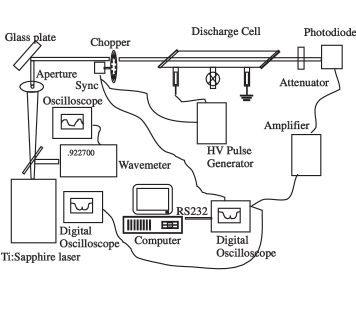
The optical and electrical diagrams of the experimental arrangement are shown in Fig. 1. The monochromatic 1W laser beam generated by the Ti:Sapphire laser is expanded by traveling 8 meters between two optical tables to the size of about 5 cm diameter. A variable aperture reduces both the beam’s size and its power. To avoid saturation of the transition, the beam intensity is further reduced using a 2% reflection off a glass plate. A chopper periodically interrupts the beam to give a 100% reference absorption. The beam is then directed through the discharge cell where it undergoes time-dependent absorption in the discharge initiated by HV pulses from the HV pulse generator. The optical path of the laser beam is terminated on the photodiode. The attenuator in front of the screened photodiode compartment is used to avoid any saturation effects in the detection system. The signal from the photodetector is amplified and sent to the digital oscilloscope for measurement of the absorption.
The laser is a commercial single frequency MBR-110 Ti:Sapphire laser, pumped with 7-15 W of CW Coherent argon ion laser. The MBR-110 laser can be tuned in a broad range, 700-1060 nm, but to cover all this range 6 different mirror combinations have to be installed.
The discharge cell is a quartz tube of diameter 2.5 cm and a length of 30 cm. Two standard electrodes were fused symmetrically in side-tubes near each end. The electrodes have large area to reduce unwanted sputtering from the cathode which can reduce the lifetime of metastables significantly and affect the population distribution in the discharge as we observed in detail in helium. Moreover, for the same purpose, an external ballast volume was added to the cell and a short-pulsed discharge was used instead of a DC discharge.
A high voltage pulse generator produces high-voltage (more than 10 kV to allow fast discharge breakdown) pulses each of a few microseconds. The circuit is based on a power transistor in the switching mode and high-voltage transformer. A rotating chopper is inserted into the optical path to produce a 100% normalization signal.
The detection system consists of a photodiode, an amplifier, and a digital oscilloscope. There is no special requirement on those elements except that the detection system should provide a linear response and the distortion of the waveform of the signal should be minimal. The first requirement is completely fulfilled if the laser intensity does not exceed the saturation limit for a particular diode. The second requirement is approximately satisfied: small distortion of the signal has been observed. This effect is analyzed in detail in the next section.
IV Measurement and error analysis
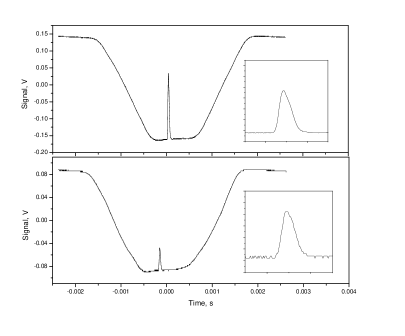
To find the ratio of line strengths, we measure the peak absorption for two transitions and use the formula
Here and are the voltages proportional to the maximum of a pulsed discharge absorption and to the chopper normalization absorption for the transition at nm shown in Fig.2. Similar voltages for the second transition at nm also shown in Fig.2. are and .
Repeating measurements of absorption several times, we have obtained the ratio . A small error here indicates the excellent statistics. However, the result can still have systematic errors which need to be estimated and if possible be excluded.
The first type of systematic error can occur from a slow drift in discharge conditions. Though our pulsed discharge is very stable, to account for any slow drift, we alternate measurements of the absorptions for the two transitions.
The second possible systematic error can arise from the uncertainty in the wavelength when the laser is manually tuned to the resonances of the transitions by monitoring absorption peaks similar to shown in Fig. 2. If and are relative average shifts owing to tuning uncertainty, then the absolute systematic shift in the ratio is
| (8) |
where this equation was simplified for small absorption. The tuning error is estimated to be about 1.5%.
The combined effect of the nonlinearity of absorption and finite-time response of the detection system leads to another systematic error. Suppose is the reduction in the peak height because of a slow time response. Then we can write for the -ratio
Comparing measurements of ratios at different discharge currents and, hence absorption, we find that the time responce error is about . This error gives a systematic increase in the ratio by 4%, but the previous error due to tuning decreases the ratio slightly by 1.5% so that the overall systematic error is smaller. Finally, taking into account mentioned above statistical and systematic errors, we obtain the accuracy of the measurement of the ratio about 4%. The final value of our ratio is .
V Comparison with CI+MBPT theory and the other measurements and calculations
| Source | Ratio |
|---|---|
| Experiment | |
| This work | 3.290.13 |
| Wiese et al. (1989) | 2.90.4 |
| Theory | |
| Savukov (2002) | 3.23 |
| Lilly (1976) | 3.51 |
| Garstang and Blerkom (1965) | 4.62 |
The comparison of the ratio of line strengths is given in Table 1. Our measured ratio of line strengths is in excellent agreement with the value 3.23 obtained from our mixed configuration-interaction and perturbation-theory calculations Savukov (2002). Both measured and theoretical ratios agree also with the ratio 2.8915% calculated from the experimental transition rates of Ref. Wiese et al. (1989). Our results are close to semiempirical calculations by Lilly (1976). However, the ratio 4.62 from semiempirical calculations of Ref. Garstang and Blerkom (1965) based on a similar principle as calculations in Ref. Lilly (1976) disagree substantially with our result. One obvious problem with semiempirical approaches is that energies can not define completely the wave functions which are very sensitive to the accuracy of calculations. In addition, transition amplitudes have additional corrections which are not accounted by the effective Hamiltonian. For example, random-phase approximation (RPA) corrections are due to shielding by the atom of an external photon field. Those corrections are substantial in Ar and heavier noble-gas atoms and must be included to reach a good precision.
VI Conclusion
We have measured an accurate ratio of line strengths for two argon transitions. For this measurement we developed a new experimental technique based on a pulsed discharge and a laser absorption measurement. This technique can be applied for measurements of other ratios in noble gas atoms. The agreement of our measurement and calculations is excellent.
References
- Savukov et al. (2002) I. M. Savukov, W. R. Johnson, and H. G. Berry, Phys. Rev. A, submitted (2002), eprint arXiv:physics/0207028.
- Savukov (2002) I. M. Savukov, Ph.D. thesis, University of Notre Dame (2002).
- A. Hirabayashi and Fujimoto (1987) Y. N. A. Hirabayashi, S. Okuda and T. Fujimoto, Phys. Rev. A 35, 639 (1987).
- Wiese et al. (1989) W. L. Wiese, J. W. Brault, K. Danzmann, V. Helbig, and M. Kock, Rev. Phys. A 39, 2461 (1989).
- Rafac and Tanner (1998) R. J. Rafac and C. E. Tanner, Phys. Rev. A. 58, 1087 (1998).
- Raizer (1991) Y. P. Raizer, Gas Discharge Physics (Springer-Verlag, Berlin Heidelberg, 1991).
- (7) Available online at http://physics.nist.gov/cgi-bin/AtData/main_asd.
- Lilly (1976) R. A. Lilly, J. Opt. Soc. Am. 66, 245 (1976).
- Garstang and Blerkom (1965) R. H. Garstang and J. V. Blerkom, J. Opt. Soc. Am. 55, 1054 (1965).