Accepted for publication in
Biophysical Chemistry Special Issue for Walter Kauzmann
Thermodynamic and Kinetic Analysis of Sensitivity
Amplification in Biological Signal Transduction
Hong Qian
Department of Applied Mathematics, University of
Washington
Seattle, WA 98195-2420
Based on a thermodynamic analysis of the kinetic model for the protein phosphorylation-dephosphorylation cycle, we study the ATP (or GTP) energy utilization of this ubiquitous biological signal transduction process. It is shown that the free energy from hydrolysis inside cells, (phosphorylation potential), controls the amplification and sensitivity of the switch-like cellular module; the response coefficient of the sensitivity amplification approaches the optimal 1 and the Hill coefficient increases with increasing . We discover that zero-order ultrasensitivity is mathematically equivalent to allosteric cooperativity. Furthermore, we show that the high amplification in ultrasensitivity is mechanistically related to the proofreading kinetics for protein biosynthesis. Both utilize multiple kinetic cycles in time to gain temporal cooperativity, in contrast to allosteric cooperativity that utilizes multiple subunits in a protein.
1 Introduction
Biological signal transduction processes are increasingly being understood in quantitative and modular terms [1, 2]. One of the most commonly studied modules of cellular “circuitry” is the phosphorylation-dephosphorylation cycle (PdPC) [3] which has been shown to exhibit sensitivity amplification for the appropriate stimuli expressed through activating a kinase or inhibiting a phosphatase [4, 5, 6]. Both experimental measurement [7, 8, 9] and theoretical modeling have shown that the covalent modification gives rise to a switch-like behavior.
Sensitivity amplification requires energy consumption [4, 7, 10]. Since the PdPC involves the transfer of high-energy phosphate group, it is natural to ask how the cellular phosphoenergetics play a role in the signal transduction processes. Recently, a novel mechanism has been proposed [11] for improved Rab 5 GTPase function as cellular timer [12] by utilizing the energy derived from GTP hydrolysis. It is shown that an energy expenditure is necessary for a GTPase timer to be accurate and robust.
Phosphoenergetics and ATP hydrolysis are also involved in PdPC. While it is known that energy expenditure is required to maintain levels of phosphorylation in excess of an equilibrium [4, 10], it is still not yet clear how cellular energetics relates to this type of signal transduction process. One approach to address this question is introducing a rigorous thermodynamic analysis into the kinetic models of PdPC [5, 8]. The simplest kinetic scheme for PdPC is shown in (LABEL:rxn), which is based on a model proposed by Stadtman and Chock [4] and by Goldbeter and Koshland [5]. The essential difference between our (LABEL:rxn) and the earlier models is the nonzero and , i.e., the reversibility of the separate and distinct phosphorylation and dephosphorylation processes.
In order to carry out a cogent thermodynamic analysis for the kinetic model of PdPC, the reversibility of the biochemical reactions involved, specifically the phosphorylation catalyzed by kinase and dephosphorylation catalyzed by phosphatase, must be enforced. While this was known to be an important issue [13], almost all current models neglect the slow reverse steps.
2 Basic Biochemical Equilibrium and Energetics
We consider a phosphorylation-dephosphorylation cycle (PdPC) catalyzed by kinase and phosphatase respectively. The phosphorylation covalently modifies the protein to become :
It is important to note that the reaction I is not the reverse reaction of II. In fact, recognizing that the hydrolysis reaction ATP ADP+Pi explicitly, we have
Thus, at constant concentrations for ATP, ADP, and Pi,
| (2) |
For simplicity we have assumed that these rate constants are pseudo-first order, which implies that ATP, ADP, and Pi are sufficiently below the saturation levels for their respective enzymes.
The equilibrium constant for ATP hydrolysis therefore is
| (3) |
where is the standard free-energy change for ATP hydrolysis reaction [14]. That is = 1 in equilibrium. However, with physiological concentrations for ATP, ADP, and Pi inside cells, the quotient
| (4) |
is directly related to the intracellular phosphorylation potential
| (5) |
where at room temperature. We shall also introduce an equilibrium constant for the dephosphorylation reaction catalyzed by phosphatase under intracellular phosphate concentration:
| (6) |
The two parameters and are the key augmentations to the model of Goldbeter and Koshland [5].
We recognize the fact that there is currently no experimental evidence for reaction II being reversible. While the backward rate for the dephosphorylation reaction catalyzed by a phosphatase can be extremely small, a thermodynamically correct model has to have a nonzero , no matter how small it is. In fact, Eq. 4 could be used to estimate the unmeasurable if all the other rate constants are known.
3 Reversible Kinetic Model for Covalent Modification
The kinetic equations for the reaction cycle in (LABEL:rxn) are straightforward
These equations are solved in conjunction with conservation equations 8, 9, and 10:
| (8) | |||||
| (9) | |||||
| (10) |
Following the elegant mathematical treatment given in [5], we have the steady-state fraction of phosphorylated , denoted by as in [5], satisfying
| (11) |
Here we have denoted
These three parameters are in the original model [5] which, by assuming irreversible reactions with , has and . represents the ratio of kinase activity to phosphatase activity. Hence it characterizes the magnitude of the stimuli for the PdPC. and are the ratios of substrate concentrations to the Michaelis-Menten constants of kinase and phosphatase, respectively. A small () means the enzymatic reaction is highly saturated.
More explicitly, Eq. 11 is a quadratic equation for :
| (12) |
in which
The steady-state solution to Eq. LABEL:mastereq, therefore, is the positive root of Eq. 12
| (13) |
It is plotted in Fig. 1 using , i.e., both enzymes are highly saturated thus the rates are only weakly dependent on the respective substrate concentrations [5], and , i.e., the dephosphorylation reaction is highly irreversible [13]. It is seen that the quality of the amplifier is directly related to the phosphorylation potential. In fact, when , i.e., ATP ADP+Pi are in chemical equilibrium,
| (14) |
which is independent of . In this case, the amplification is completely abolished. Biological amplification needs energy, just like a home stereo.
 |
The switch-like behavior in Fig. 1 can be understood semi-quantitatively as follows (Fig. 2). The kinase catalyzed phosphorylation reaction has a Michaelis-Menten constant and . Therefore the overall rate of the reaction is ; similarly the dephosphorylation reaction has a rate where . The equilibrium constants for the respective reactions are and .
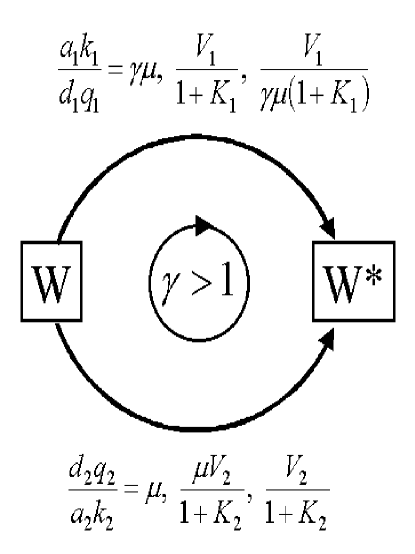 |
When and , the phosphorylation pathway is dominant. Hence = . When , the pathway is dominated by dephosphorylation and = . Therefore, for a finite , one does not expect as , as clearly pointed out earlier in [13]. Rather we have as . For and = , , , and , the plateau of toward right in Fig. 1 is expected to be 0.099, , , and almost .
The response coefficient, , which characterizes the steepness of the transition in covalent modification, has been defined as the ratio of the when = 90% to the when = 10% [5]. For a simple Michaelis-Menten kinetics its value is 81. A value of 1 means the transition is infinitely steep. With the finite and , in theory, because never exceeds 0.9 for a range of and (Fig. 1), needs to be redefined as the ratio of when = to the when , where = and = . In physiological reality, and ; that is and . Fig. 3 shows how the response coefficient,
| (15) |
depends on the phosphorylation potential . It is seen that for the physiological range of , the steepness reaches its minimal, platuea value given in [5].
 |
The current model in fact makes a prediction. Let and be the left and right plateaus of the amplification curve in Fig. 1, which are very close to 0 and 1, respectively. Then
| (16) |
In contrast, the previous model [5] predicts an indeterminate .
The steepness of the curves in Fig. 1 can also be characterized by the slope at its mid-point, known as Hill coefficient in the theory of allosteric cooperativity [14]. It can be obtained analytically from Eq. 11:
| (17) |
when , , and are small and is large. We see again that the steepness increases with increasing .
4 Temporal Cooperativity
Allosteric change in and covalent modification of proteins are two most basic phenomena in cellular signaling processes [6]. While the equilibrium thermodynamic principle of the former is well understood [16], relatively little attention has been given to the nonequilibrium steady-state thermodynamics [17] of the latter. The analysis developed in the present paper indicates that the cooperativity in the cyclic reaction is temporal, with energy “stored” in time rather than in space as for the allosteric cooperativity. This concept is similar to the energy relay which was first proposed by J.J. Hopfield for understanding the molecular mechanism of kinetic proofreading in protein synthesis [18, 19]. We now elaborate on this concept by carrying out a quantitative comparison between the steady-state system given in Eq. LABEL:rxn and the allosteric cooperativity.
High-order versus zero-order reactions
One of the most fundamental difference between allosteric cooperativity and zero-order ultrasensitivity is apparently the order of the reactions. Allosteric cooperativity is based on a reaction with high-order
| (18) |
where is the equilibrium constant for protein binding single-ligand . The corresponding fraction of protein with ligand then is
| (19) |
Eq. 19 indicates that the steepness of the curve versus increases with . On the other hand, ultrasensitivity is based on both phosphorylation and dephosphorylation reactions being enzyme limited; hence both have a very weak dependence on the respective substrate concentrations and . In the steady-state
| (20) |
where and are the rates of phosphorylation and dephosphorylation and , the “order of the reaction”, is near zero. (Normally the power term to the concentration of a species implies the stoichiometry of that species in a reaction. The meaning of here is that the reaction is even less than first-order. Both a hyperbolic curve, as expected from an enzymatic reaction with saturation, and a curve with power are concave down with negative curvature.) The corresponding fraction of protein in the activated state
| (21) |
Eq. 21 indicates that the steepness of the curve versus increases with . Therefore, the optimal situation is a zero-order reaction with .
Surprisingly, allosteric binding (Eq. 18) can yield an equation identical to (20). Let equilibrium constant where and are association and dissociation rate constants. Then in the equilibrium = . That is
| (22) |
Temporal cooperativity in zero-order reaction cycle
The cooperativity achieved by ultrasensitivity, therefore, can be stated as follows. It takes, on average, PdPCs in order to transform one to . There is a temporal cooperativity on the scale of cycles. Therefore, in time is analogous to the number of subunits in allosteric cooperativity (see Eqs. 20 and 22). Most importantly, transforming one to one through multiple “futile” cycles is precisely the mechanism proposed by Hopfield for kinetics proofreading of protein biosynthesis (with branched reaction pathways) in which [18, 19]. Multiple branched pathways have been proposed for kinetic proofreading in T-cell receptor signaling [20]. Of course, the ATP hydrolysis is not futile, rather the energy supplies the need to maintain high accuracy and sensitivity or improved memory of a steady-state “living” system away from true thermodynamic equilibrium.
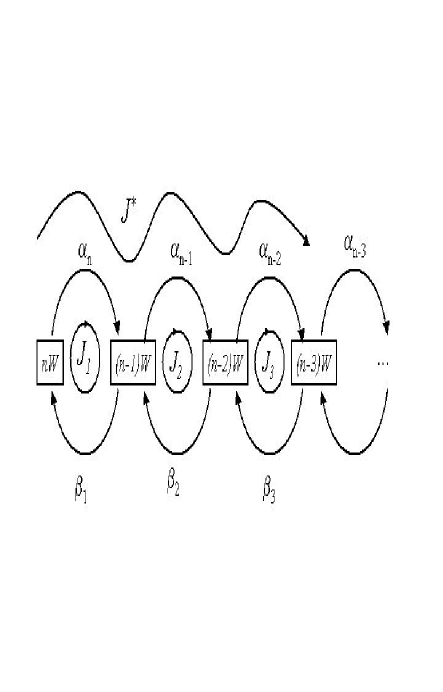
The above statement can be further quantified. Let’s consider a system with only a single and a single molecule, but substrate molecules. The complete kinetics of formation can be represented by a chain kinetic scheme shown in Fig. 4 [21], which is a detailed version of what is shown in (LABEL:rxn). Each time when a cycle is completed, one ATP molecule is hydrolyzed.
 |
The cooperativity of the kinetics in Fig. 4 is characterized by
| (23) |
For completely independent molecules undergoing transition, Eq. 23 is expected to be unity. However the molecules in Fig 4 are not independent since they are linked by the enzymatic reactions. For small and , there is a cooperative phosphorylation when and there is a cooperative dephosphorylation when .
Fig 5 shows the steepness of the response curve for the model given in Fig. 4. The detailed model gives the same for . The significance of this chain model, however, is that it reveals the origin of the cooperativity [22]. Furthermore, according to the theory of linear cooperativity [23, 22], the steepness of the curves in Fig. 1 is directly related to the microscopic fluctuation in the the number of .
 |
Fig. 6 shows a numerical example of the reaction kinetics of the model given in Fig. 4. The large fluctuations in the number of molecules is directly related to the . In fact, = is expected to be 112. More cooperative system has larger fluctuations.
 |
 |
5 Discussion
The rigorous thermodynamic analysis of the model for phosphorylation-dephosphorylation cycle (PdPC) originally proposed in [4, 5] indicates that a sustained intracellular phosphorylation potential is essential in the functioning of the signal transduction process. This result suggests that the ubiquitous phosphorylation in biological signaling processes, in addition to the covalent chemical modification which leads to structural recognition, also utilizes biochemical energy from the high-energy phosphate in order to carry out its function with high accuracy, robustness, sensitivity, and specificity [18, 11, 24]. The analysis also reveals a shared mechanism between the ultrasensitivity and kinetic proofreading in a large class of cellular processes involving GTPases [12]. Both use cycle kinetics [17] to improve the power of biological selectivity.
Our quantitative analysis also provided a clear mechanistic origin for the high cooperativity in the zero-order ultrasensitivity. A chain kinetic model indicates that the cooperativity is achieved through temporal cooperativity. This mechanism is parallel in mathematical form to, but fundamentally different in biochemical nature from, the allosteric cooperativity of multi-subunits protein systems [16]. Both temporal and allosteric cooperativities have a deep connection to the molecular fluctuations as shown in Fig. 6 [21], an insight largely unexplored in the studies of biological signal transduction processes.
In order to compare our result with that of Goldbeter and Koshland, we have used the value in this study. These values are extreme cases and many PdPCs studied in laboratory experiments show a much less cooperativity. With M and concentrations of M for the kinases in the MAPK pathway [8], the realistic value will be . The phosphatase concentration is even lower, nM. Note that from Eq. 17 high cooperativity requires both ’s for the kinase and the phosphatase to be small. The current model analysis also suggests that the source of phosphate in a PdPC, while chemically equivalent, could be important. A phosphate from ATP hydrolysis can be energetically different from a phosphate from GTP hydrolysis. In the cells, [ATP] 10mM, [ADP] 10M, [GTP] 1mM, [GDP] 100M, and [Pi] 1mM [15]. Therefore, different cellular biochemical “batteries” can have different “voltages”.
6 Acknowledgements
Professor Walter Kauzmann’s work on the physical chemistry of hydrophobic interactions in proteins was an impotant part of my post doctoral education with John Schellman. In the present work I try to follow the same spirit of that work by raising a basic physicochemical question about a currently important biological problems: Is there a thermodynamic role of the prevalent phosphorylation in biological signal transduction processes? I thank Jon Cooper, Eddy Fischer, Bob Franza, John Hopfield, Guangpu Li, and Elliott Ross for helpful discussions, and Jim Bassingthwaighte and P. Boon Chock for carefully reading the manuscript.
References
- [1] D.E. Koshland, The era of pathway quantification, Science, 280 (1998) 852.
- [2] L.H. Hartwell, J.J. Hopfield, S. Leibler, A.W. Murray, From molecular to modular cell biology, Nature 402 (1999) C47-C52.
- [3] E.G. Krebs, Phosphorylation and dephosphorylation of glycogen phosphorylase: a prototype for reversible covalent enzyme modification, Curr. Top. Cell. Regul. 18 (1981) 401-419.
- [4] E.R. Stadtman, P.B. Chock, Superiority of interconvertible enzyme cascades in metabolic regulation: analysis of monocyclic systems, Proc. Natl. Acad. Sci. USA 74 (1977) 2761-2765.
- [5] A. Goldbeter, D.E. Koshland, An amplified sensitivity arising from covalent modification in biological systems, Proc. Natl. Acad. Sci. USA. 78 (1981) 6840-6844.
- [6] D.E. Koshland, A. Goldbeter, J.B. Stock, Amplification and adaptation in regulatory and sensory systems, Science 217 (1982) 220-225.
- [7] E. Shacter, P.B. Chock, E.R. Stadtman, Regulation through phosphorylation/dephosphorylation cascade systems, J. Biol. Chem. 259 (1984) 12252-12259.
- [8] C.F. Huang, J.E. Ferrell, Ultrasensitivity in the mitogen-activated protein kinase cascade, Proc. Natl. Acad. Sci. USA 93 (1996) 10078-10083.
- [9] J.E. Ferrell, E.M. Machleder, The biochemical basis of an all-or-none cell fate switch in Xenopus oocytes, Science, 280 (1998) 895-898.
- [10] A. Goldbeter, D.E. Koshland, Energy expenditure in the control of biochemical systems by covalent modification, J. Biol. Chem. 262 (1987) 4460-4471.
- [11] G.P. Li, H. Qian, Kinetic timing: a novel mechanism for improving the accuracy of GTPase timers in endosome fusion and other biological processes, Traffic 3 (2002) 249-255.
- [12] H.R. Bourne, D.A. Sanders, F. McCormick, The GTPase superfamiliy: a conserved switch for diverse cell functions, Nature 348 (1990) 125-131.
- [13] M.J. Gresser, Regulation of enzyme activity by cyclic phosphorylation-dephosphorylation cascades. Thermodynamic constraints, Biochim. Biophys. Acta 743 (1983) 316-322.
- [14] L. Stryer, Biochemistry, W.H. Freeman, San Francisco, 1981.
- [15] M.J. Kushmerick, Energy balance in muscle activity: simulations of ATPase coupled to oxidative phosphorylation and to creatine kinase, Compara. Biochem. Physiol. B. 120 (1998) 109-123.
- [16] J. Wyman, S.J. Gill, Binding and Linkage: Functional Chemistry of Biological Macromolecules, University Science Books, Herndon, VA, 1990.
- [17] T.L. Hill, Free Energy Transduction in Biology: The Steady-State Kinetic and Thermodynamic Formalism, Academic Press, New York, 1977.
- [18] J.J. Hopfield, Kinetic proofreading: a new mechanism for reducing errors in biosynthetic processes requiring high specificity, Proc. Natl. Acad. Sci. USA 71 (1974) 4135-4139.
- [19] J.J. Hopfield, The energy relay: a proofreading scheme based on dynamic cooperativity and lacking all characteristic symptoms of kinetic proofreading in DNA replication and protein synthesis, Proc. Natl. Acad. Sci. USA 77 (1980) 5248-5252.
- [20] T.W. McKeithan, Kinetic proofreading in T-cell receptor signal transduction, Proc. Natl. Acad. Sci. USA 92 (1995) 5042-5046.
- [21] H. Qian, E.L. Elson, Single-molecule enzymology: stochastic Michaelis-Menten kinetics, Biophys. Chem. 101 (2002) 565-576.
- [22] T.L. Hill, Cooperativity Theory in Biochemistry: Steady-State and Equilibrium Systems, Springer-Verlag, New York, 1985.
- [23] D. Poland, H.A. Scheraga, Theory of Helix-Coil Transitions, Academic Press, New York, 1970.
- [24] H. Qian, Amplifying signal transduction specificity without multiple phosphorylation, Biophys. J. in the press.
7 Figure Captions
Figure 1. Amplified sensitivity of a phosphorylation-dephosphorylation cycle as a function of intracellular phosphorylation potential . From top to bottom, = , , and , corresponding to = 13.8, 5.5, 4.1, and 2.8 . is the typical value for intracellular phosphorylation potential [14, 15]. Other parameters used in the computation: and .
Figure 2. A semi-quantitative, Michaelis-Menten, representation for the PdPC. The three numbers by each pathway are the equilibrium constant, forward and backward rates for the enzymatic reaction. They satisfy their respective Haldane relationship for thermodynamic reversibility. In general the steady-state is between and . If , then it is near , and if , it is near . When the the PdPC runs clockwise.
Figure 3. Intracellular phosphorylation potential, , in , controls the sensitivity amplification of a PdPC. The response coefficient is defined as in Fig. 1 [5]. The solid line is for , and the dashed line for . Both with .
Figure 4. Detailed kinetic scheme showing how the PdPCs are being completed while molecules are transformed to . The “futile” cycles are indicated by , , etc., and the net flux for formation is denoted by . According to Michaelis-Menten kinetics, transition rates = and = , which are weakly substrate dependent when ’s are small. means cooperativity. The process is closely related to a biased random walk with and analogous to the “drift velocity” and “diffusion constant”, respectively.
Figure 5. The steepness according to the kinetic model in Fig 4. First is calculated as function of with various . The steepness, , of the curve is the slope at its mid-point. Other parameters used: , . It can be analytically shown that for small , = 83.5, and for large , . For , according to Eq. 17.
Figure 6. Upper pannel shows a numerical simulation of the reaction given in Fig. 4, with , , , . Since , the steady-state . The large fluctuations in the number of molecules is directly related to the : = . Lower pannel shows the probability distributions for the number of . Solid flat line: , Dashed lines: different distributions for and respectively. We see a sharp response to being less and greater than . In comparison, the central peak with dotted line is for non-cooperative system with 1000 independent molecules and . More cooperative system has larger fluctuations.