Ionization Chambers for Monitoring in High-Intensity Charged Particle Beams
Abstract
Radiation-hard ionization chambers were tested using an intense electron beam from the accelerator test facility (ATF) at the Brookhaven National Laboratory (BNL). The detectors were designed to be used as the basic element for monitoring muons in the Main Injector Neutrino beamline (NuMI) at the Fermi National Accelerator Laboratory (FNAL). Measurements of linearity of response, voltage dependence, and the onset of ionization saturation as a function of gap voltage were performed.
, , , , , and
1 Introduction
Future neutrino experiments will drive neutrino beams to intensity levels where beam secondary and tertiary monitoring systems must be concerned about effects of radiation damage on materials and detector response linearity. We have designed a radiation-hard ceramic pad ionization chamber (PIC) with small (adjustable 1-5 mm) gap thickness suitable for this environment. [1] The device will be used to monitor secondary hadrons and muons in the NuMI neutrino beam for the MINOS experiment. This paper presents measurements performed at the ATF which demonstrate that the system can be used for monitoring charged particle intensities in the range particles/cm2 in an 8sec beam spill, suitable for which are the expected intensities at the MINOS muon monitors.
2 Minos Beam Environment
The NuMI beam, composed primarily of , will be produced from decays of secondaries generated when protons from the Main Injector at FNAL strike a graphite target. [1] The neutrinos emerge from and decays in a 675 m decay pipe beginning 50 m downstream of a double horn focusing system.
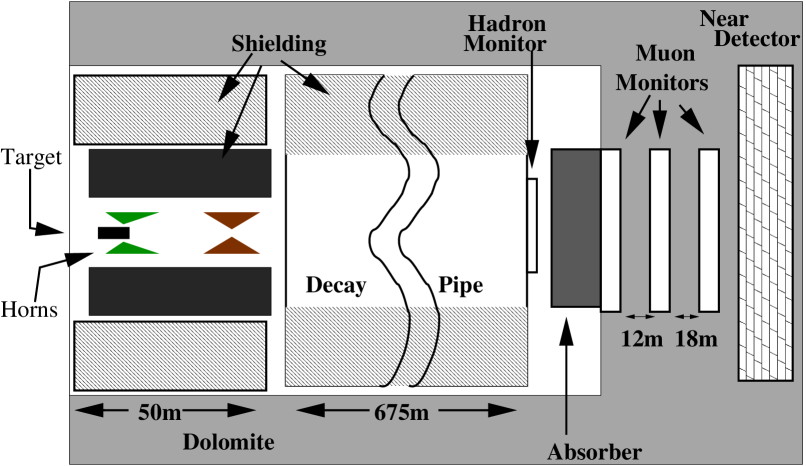
In order to predict the beam flux at the far detector MINOS plans to use the neutrino beam spectrum measured at the near detector. However, neutrino events are collected too slowly at the near detector for spill by spill monitoring of the beamline performance. Beam monitors will be used to measure the distributions of secondary particles at the end of the decay pipe and of muons produced in the and decays at three locations (muon alcoves) in the earth, see Fig. 1. This system is designed to be sensitive to beamline component alignment and performance and to provide feedback on the beam on a short time scale.[1]
In order to monitor the muons in the beam, arrays of PIC detectors will be located immediately downstream of the hadron absorber and successively after 12 m and 18 m of earth in the muon alcoves. To ensure that these chambers will operate in the linear region, we have measured the saturation point (defined later in Sec. 7), the ionization response yield, the stability of the yield and its dependence on the applied electric field, as described in this paper.
3 ATF Beam
The Accelerator Test Facility (ATF) at Brookhaven National Laboratory provided the test beam to study the PIC response. The facility delivered 42 MeV electron bunches with pulse lengths of 10 ps and a range of intensities from 1 pC to 1 nC. [2] The beam spot size was typically between 1.0 and 1.2 cm2 (85% containment), thus the typical intensity range available at the facility was particles/cm2/10 ps.
4 PIC Description
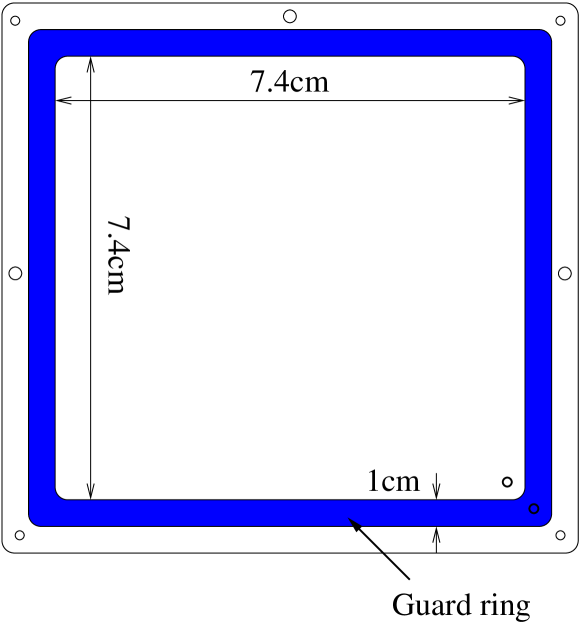
The PIC is made of two metalized ceramic pads separated by laser cut ceramic washers at the corners to maintain the gap spacing. The ceramic pads are approximately 7.4 cm 7.4 cm, a signal pad is shown in Fig. 2. A 0.304 mm gap separates the 1 cm thick guard ring from the active pad. The metalized-ceramic pad is produced commercially using a Platinum-Silver alloy and 1 mm thick ceramic wafers as the substrate by Amitron, Inc. of N. Andover, MA, USA. The components of the basic PIC unit have been chosen for their radiation hardness and flatness of less than 1.35 m per cm. The radiation dose in the muon alcoves will be approximately 10 MRads/year. [Harris] Mechanical Properties of ceramic materials have been tested up to total radiation doses of 10 GRad. [3]
5 Experimental Setup
The experimental setup is shown in Fig. 3a. The PIC detector pads were mounted in a thin window gas box upstream of the Faraday cup (FC) and the beam strip chamber (BSC). The FC measured the total beam charge per pulse. The BSC was used to measure the beam profile and consisted of a pair of strip ionization chambers. Each chamber had a set of seven 5 mm wide strips: one set oriented horizontally and the other vertically. Each had a gap size of 2.5 mm per plane. Both the BSC and the FC completely covered the expected beam size of 1.5 cm2 (see Fig. 3b).


The BSC and the PIC detectors were operated with helium flowing at a rate of 100 20 cc/min and at a pressure of 0.15 0.05 inches of water above ambient pressure. The FC was also operated in a continuously purged atmosphere of dry helium. We used laboratory grade (UHP) helium independently rated to be 99.999% pure by Praxair Inc., Seattle, WA, USA. The helium gas was provided separately to the PIC, BSC and the plastic enclosure sealed with kapton tape around the entire assembly. A gas distribution manifold allowed us to control the flow rate and pressure to each detector. We used 0.25 in polyethylene tubing with brass fittings to distribute the gas. No provision was made to sample the gas for purity.
Voltage to the detectors was provided by two independent high voltage units with local filters to suppress ripples. For all of the data, the BSC voltage remained fixed at 250 V.
5.1 Electronics
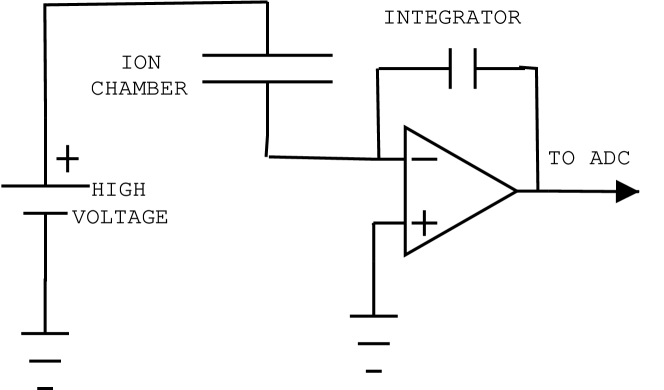
The essential features of the electronic system used to acquire data are shown in the simplified schematic of Fig 4. An operational amplifier removed excess charge from either an ionization chamber with capacitance 18 pF or the Faraday cup and the connecting coax cable, and stored it on a precision 100 pF integration capacitor. The voltage on the capacitor was subsequently digitized by an ADC for computer read out. Voltage on the input to the integrator was maintained at a virtual ground subject to the limitations of the amplifier. This differs from pulse height read out systems that employ a load resistor to develop a voltage at this point in the circuit.
The operational amplifier is part of a Burr-Brown ACF2101 integrated circuit. [4] The complete integrated circuit contains the necessary FET switches for clearing the integration capacitor and gating input/output signals. Notable limitations of the amplifier are a 3 V/sec slew rate and a random 1 mV charge transfer noise at the output.
Charge integration electronics distinguish these ionization chamber measurements from previous accelerator measurements which used pulse height read out. [5, 6] Pulse height is more susceptible to saturation effects because pulse height and shape depend on charge collection time as well as the amount of charge produced in the detector.
The complete system used for data acquisition was developed by FNAL for read out of a segmented wire ionization chamber (SWIC). [7] The system used here differs from the FNAL system by the addition of a bus termination resistor to reduce channel cross talk for large output signals.
A short integration gate time of 5 msec for readout was necessary to prevent a small charge loss that was observed for much longer gate times.
In the SWIC electronics, a large contribution to the error comes from random charge transfer errors of 0.1 pC. This contributes significantly to the measurement uncertainty at FC charges of 1 pC. All pedestals were taken while the beam was disabled. The pedestals did not vary with the PIC operating voltage. The pedestals for the PIC and FC show stability over time and show no signs of systematic deviation which would be manifest if, for example, a dark current were present. For the PIC detector, a typical pedestal was measured to be 0.39 pC with a typical width of 0.13 pC. The pedestal width includes both statistical and the dominant charge transfer error.
6 Analysis
We recorded the integrated charge for the PIC, all channels of the BSC and the FC for each ATF pulse. Data were pedestal subtracted and then selected for beam containment. The ratio of the the PIC to FC charge in the linear region was examined and anomalous events were removed.
The mean horizontal beam position was determined from the BSC using where is the strip number and is the charge collected on strip . , the vertical position was determined similarly. The horizontal and vertical beam widths were estimated using the standard deviation (RMS) of the beam intensity in each view. For the horizontal, this width is . It is similarly defined for the vertical width.
The beam position was stable for all charges and the beam width was usually less than one strip. Cuts were made on the beam position and horizontal and vertical widths to select well behaved beam pulses. During a typical run, the efficiency of the cuts was 99%.
7 Results
In gas ionization detectors, particles ionize the atoms of the gas generating electrons and ions which in turn generate a detectable current if an external electric field is applied. With a suitable electric field, the detectors operate in ionization mode where the number of ionized gas particles is simply proportional to the total number of incident charged particles. If the applied field is too large, the ionized charges are accelerated enough to produce additional ionization, and gas amplification occurs.
Saturation occurs when the applied field is not large enough to overcome the field produced by charges from ionization. In this case, ionized charges can recombine and any further increase in beam intensity does not yield a corresponding increase in ionization. At voltages below the gas amplification region, saturation can be overcome by increasing the external electric field or decreasing the amount of material in the active ionization region so that less gas is ionized. The literature on saturation does not provide a complete physical description under all experimental conditions. [5, 6] The saturation point can be experimentally determined by measuring the deviation of the response from linear or by measuring the ionization response yield, i.e. plateau curves as a function of voltage.
7.1 Linearity
The linearity measurements for the 5 mm PIC at 250, 500 and 750 V are shown in Figs. 5, 6 and 7. The linearity measurements for the 3 mm PIC were performed at 250 and 400 V. The 3 mm 250 V data are shown in Fig 8; the 400 V data are similar. The results of the fits and fit ranges are summarized in Table 1. All data are shown with error bars giving the statistical uncertainty in each bin and the 0.1 pC SWIC charge transfer error added in quadrature.
The fitting procedure [8] used the values of the FC and the PIC charge with statistical and systematic errors. For a linear fit, the data were binned in FC and PIC charge.
An important input to the fit is the choice of fit cutoff. Since the data are expected to deviate from a linear model at charges beyond the saturation point, the /DOF was used to determine the optimal fit cutoff. We minimized the /DOF as a function of the fit cutoff. The fit cutoff, chosen in this way, is one objective measure of the deviation from linear behavior.
| Slope | PIC inter- | Range | ||
| Configuration | (pC/pC) | cept (pC) | DOF | (pC) |
| 5 mm He-250V | 9.950.22 | -0.801.15 | 17.3/18 | 0-8 |
| 5 mm He-500V | 9.770.09 | 0.220.76 | 30.8/32 | 0-13 |
| 5 mm He-750V | 9.570.26 | 1.391.62 | 15.1/15 | 0-11 |
| 3 mm He-250V | 5.980.03 | 1.510.32 | 58.6/52 | 0-18 |
| 3 mm He-400V | 5.820.03 | 2.050.30 | 48.4/42 | 0-19 |


All data in Fig. 5-8 are clearly linear below the fit cutoff points, and saturation starts above this cutoff. All 5 mm ionization yields (ion pairs/cm) in Table 1 are consistent at the 1.1 level. The fit -intercept is consistent with zero. The weighted average ratio of the 3 mm and 5 mm ionization yields is 0.600.01, in excellent agreement with the expectation of 3/5.
7.2 Voltage Dependence
A voltage plateau demonstrates the stable operating range of an ionization chamber. For this measurement, the ATF beam was held at approximately constant intensity while the ionization chamber voltage was varied from a few volts up to 1000 V.
Using the selection criteria described above, the average PIC to FC yield and RMS were determined from the data. The beam current at lower intensities was stable, but at higher intensities varied by 20%.
Plateau curves for the 5 mm and 3 mm gap PIC in helium gas are shown in Fig. 9. The four curves correspond to beam intensities of 5.70.4, 11.91.7, 26.82.4 pC for the 5 mm and 30.22.2 pC for the 3 mm PIC. At the lowest intensity the ratio PIC/FC rises very quickly with voltage and remains constant beyond 100 V. At the highest intensity PIC/FC continues to rise even at 1000 V indicating saturation.

7.3 Saturation
To quantify saturation we plot the total collection efficiency which is defined as the data minus the fit divided by the fit. We then characterize saturation as a percent deviation from zero. Fig. 10 shows collection efficiency versus FC charge measured at 250, 500 and 750 V for 5 mm data. Table 3 shows the saturation points as determined from the fit (the fit cutoff defined earlier divided by the area) and 5% and 10% saturation points for the 3 mm and 5 mm data. We found the fit cutoff to be a less sensitive measure of the saturation point. The data at higher voltages saturate at higher intensities, as expected.
The ion chamber, where one pad is held at and the other pad at , is analogous to the parallel plate capacitor. When a beam of electrons passes through the gas, this creates a uniform charge distribution, . The electric field, , in this case is related to the charge distribution by the Poisson equation, . Integrating and applying the voltage boundary condition, the electric field is given by,
Saturation in this naive model occurs when , which corresponds to a critical charge density or using the observed ionization response yield of 19.5 ion pairs/cm and cm, pC/cm3, with V in volts.
To calculate the intensity per unit area the area of the beam spot on the chamber was measured using three different methods. For each method, we used the BSC data averaged in the linear region, which always extended to intensities larger (due to the smaller gap of the BSC) than the saturation point of the PIC. The beam spot was observed periodically (for every fifth pulse) with a fluorescent screen viewed with a CCD camera and found to be approximately described by an ellipse. The area given by,
with major and minor axes and was determined by fitting a gaussian to the BSC profile for the 85% contained beam area. Fig. 11 shows that the measurement of the the area was stable and did not degrade as a function of intensity.
Two additional methods made use of the segmentation of the BSC. A grid of values was formed by the outer product of the two vectors consisting of the charge measured in the horizontal and vertical strips. The resulting matrix was then normalized by the total charge. The first method, (“Box I”), simply added the number of grid elements with more than 5% of the maximum charge. The second, (“Box II”) summed each grid area weighted by its normalized charge.
The results are shown in Table 2. The three methods agree within 20% for all measurements. The average of these three measurements is taken to be our area estimate. The errors on the measurements are highly correlated and the measurements themselves are consistent. Thus, the error on the average was chosen to be the largest percent error from the individual measurements. Due to the large size of the BSC strips compared to the beam size, both the area and error are likely overestimated.
| Data | Method (cm2) | ||
|---|---|---|---|
| Box I | Box II | ||
| (85% Containment) | |||
| 5 mm 250 V | 1.160.14 | 1.070.14 | 1.150.10 |
| 5 mm 500 V | 1.390.13 | 1.550.21 | 1.080.15 |
| 5 mm 750 V | 1.16 0.17 | 1.26 0.25 | 1.12 0.13 |
| 3 mm 250 V | 0.990.25 | 1.340.22 | 0.91 0.21 |
| 3 mm 400 V | 0.880.11 | 1.260.16 | 0.81 0.15 |


Fig. 12 shows the intensity at which the data saturate as a function of for the 5% and 10% level. The linear fits shown in the figure include only the 5 mm data. The 3 mm data are in good agreement with the fit except for the 400 V 10% data point which is lower by 2.5 sigma. If the 3 mm data are included in the fits, the fit to the 5 % data points does not change substantially, but the for the 10 % fit worsens from 1.1 to 2.1. The 5 mm data demonstrate the naive model expectation that the saturation point behaves linearly in . For the 5 mm 500 V data, the critical charge density corresponds to particles/cm2, which is in good agreement with the measured value of saturation 11 2 particles/cm2 for the 5% saturation point. We note that we have not attempted to understand the effects of multiplication on ionization yield as well as on the apparent saturation point. At high electric fields and intensities effects of multiplication could make the interpretation of the data more complex.
| Saturation Measure | |||
|---|---|---|---|
| Fit | 5% Point | 10% Point | |
| particles/cm2 | |||
| 5 mm 250 V Data | 4.4 0.6 | 5.0 0.7 | 9.4 1.2 |
| 5 mm 500 V Data | 6.0 0.8 | 11 2 | 22 3 |
| 5 mm 750 V Data | 5.81.0 | 14 3 | 23 4 |
| 3 mm 250 V Data | 10 3 | 18 5 | 23 6 |
| 3 mm 400 V Data | 12 3 | 20 4 | 23 5 |

8 Conclusions
Results from the ATF measurements have demonstrated that the PIC device with a 5 mm or smaller gap spacing is suitable for operation in the high-rate environment expected at the muon monitors of the NuMI beam. The 5 mm PIC operated linearly with stable response over a voltage range 250-750 V in helium gas with intensities up to 14 (23) particles/cm2 for a 5% (10%) saturation for a short-pulse beam. It is expected that for longer duration beam spills of order 10 s, the saturation point should increase and this result will be a lower bound. Furthermore, the results show that saturation can be modified in a controlled manner by increasing or decreasing the externally applied field.
References
- [1] The MINOS Collaboration, “Neutrino Oscillation Physics at Fermilab: The NuMI-MINOS Project,” Fermilab Report No. NuMI-L-375 (1998).
- [2] T. Tsang et al., “Electro-optical measurements of picosecond bunch length of a 45 MeV electron beam”, Journal of Applied Physics 89, 4921-4926, 1 May 2001.
- [3] H. Schonbacher and M. Tavlet,“Compilation of radiation damage test data, pt.1,” CERN Yellow Report 89-12, 1989.
- [4] Burr-Brown Corp., 6730 S. Tucson Blvd, Tucson, AZ 85706.
- [5] S. Palestini et al., Nucl. Instrum. Meth. A 421, 75 (1999).
- [6] J. W. Boag and T. Wilson, British Journal of Applied Physics, 3, 222 (1952).
- [7] W. Kissel, B. Lublinsky and A. Franck, “New SWIC Scanner/Controller System,” 1995 International Conference on Accelerator and Large Experimental Physics Control Systems, (1996).
- [8] W. H. Press, S. A. Teukolsky,W. T. Vetterling and B. P. Flannery, “Numerical Recipies in C,” Cambridge University Press, New York, 1992.