Cold trapped atoms detected with evanescent waves
Abstract
We demonstrate the in situ detection of cold 87Rb atoms near a dielectric surface using the absorption of a weak, resonant evanescent wave. We have used this technique in time of flight experiments determining the density of atoms falling on the surface. A quantitative understanding of the measured curve was obtained using a detailed calculation of the evanescent intensity distribution. We have also used it to detect atoms trapped near the surface in a standing-wave optical dipole potential. This trap was loaded by inelastic bouncing on a strong, repulsive evanescent potential. We estimate that we trap atoms at a density 100 times higher than the falling atoms.
pacs:
32.80.PjOptical cooling of atoms; trapping and 42.25.BsWave propagation, transmission and absorption1 Introduction
Recently there has been increased interest in cold atoms trapped near a surface. For example magnetic fields of micro-electronic structures are used to trap and guide atoms near the surface of so-called atom chips HanReiHan01 (1, 2, 3). Last year Bose-Einstein condensation was realized on such a chip HanHomRei01 (4, 5). Other examples are experiments aiming to increase the phase space density and create a quasi 2D gas of atoms using inelastic reflections from an evanescent-wave (EW) atomic mirror SprVoiHeu00 (6, 7, 8).
These experiments pose new challenges for in situ detection, in particular if the atoms are within the order of an optical wavelength from the surface. In this case absorption of EWs is advantageous, since only atoms that are within a few wavelengths from the surface are probed. Aspect et al. have proposed the nondestructive detection of atoms close to a surface by detecting a phase change of a far detuned EW AspKaiWes95 (9). However this effect is very small and has not been observed so far. In this letter we demonstrate experimentally the absorption of resonant evanescent waves as a novel diagnostic tool to study cold atoms near a dielectric surface. Using a weak, resonant EW, we have studied a sample of cold atoms falling onto the surface as well as atoms trapped close to the surface.
2 Evanescent wave calculations
An evanescent wave appears when a light wave undergoes total internal reflection at the surface of a dielectric with index of refraction . For a plane incident wave the optical field on the vacuum side of the surface decays exponentially with the direction perpendicular to the surface, the decay length, the index of refraction of the substrate and the angle of incidence. For a low density of resonant absorbers near the surface, the scattering rate in the low saturation limit is proportional to the square of the field: . If the density of absorbers is uniform, this gives rise to a total rate of scattered photons proportional to . The scattered photons are missing from the reflected beam, which is therefore attenuated. If the angle of incidence approaches the critical angle , the value of diverges, so the absorption becomes large. The absorption is however less height selective in this limit.
For a Gaussian beam with an angle of incidence with the critical angle and the divergence of the beam, the electric field is similar to the field of a plane wave. For Gaussian beams with closer to , the evanescent field does not decay as a simple exponential. We can describe the incident field as a superposition of plane wave Fourier components with various . Each component contributes an evanescent field component with decay length and an amplitude proportional to the complex Fresnel transmission coefficient . Because both and vary strongly around , the evanescent wave contributions of these incident plane wave components add up to a non exponentially decaying field. In addition the transverse beam profile is modified to a non Gaussian shape. In the reflected beam one of the effects is the well known Goos-Hänchen shift GooHan47 (12). Other phenomena like nonspecular reflection, shift of focus point and change of beam waist have been predicted ChiTam87 (13). They all result from combining a finite size beam with angle dependence of the transmission coefficient . Recently, it has been proposed to measure a Goos-Hänchen shift also in the evanescent wave using a scanning tunnelling optical microscope (STOM) BaiLabVig00 (14).
In the following calculations we will coherently add plane wave components with propagation vectors in the plane of incidence. The transverse distribution has been assumed Gaussian with the same radius as the incident beam at the surface. This approach is valid, since the transverse components of the propagation vector change the angle of incidence only in second order.
The evanescent field has been calculated by evaluating the following expression
| (1) | |||||
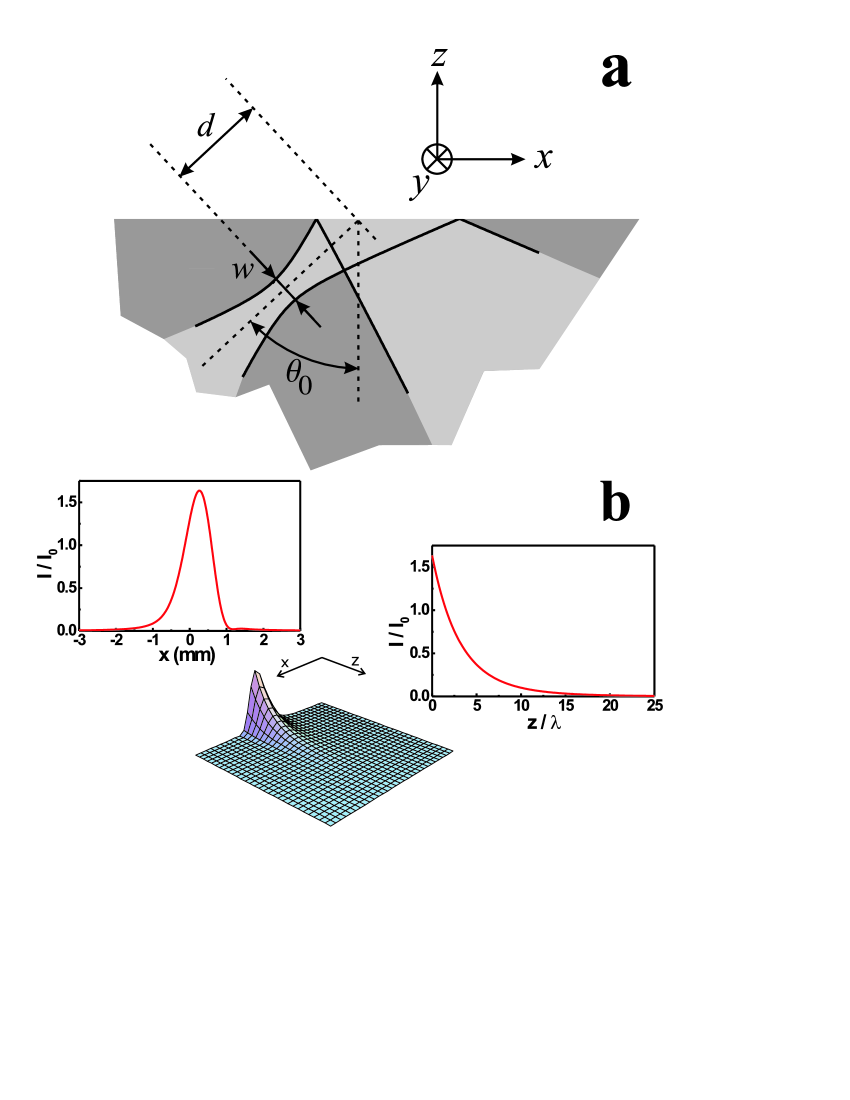
with the wavevector along the prism surface, and is the angle of incidence. The first two exponents are the field distributions parallel and perpendicular to the surface, respectively. The third exponent takes into account that the waist of the incident beam is at a distance from the surface. The fourth exponent is the distribution over angles of incidence for a Gaussian beam, with the half width of the angle distribution of the field of a Gaussian beam with waist . The factor is the Fresnel transmission coefficient for transmission of a or polarized plane wave with angle of incidence from the dielectric into vacuum. They are given by and respectively. Finally is a normalization factor that is equal to 1 for polarized incident light and for polarized light. The integration is carried out over the range of angles of incidence that generate an evanescent wave, from the critical angle to . The normalization is chosen such that in the waist of the incident beam. The geometry of the problem and some of the parameters are displayed in Fig. 1a. The effective evanescent intensity is given by
| (2) |
where is the intensity of the incident beam in the waist of the incident beam. The Gaussian determines the distribution in the y-direction with the transverse intensity radius at the prism surface. The fraction corrects for the transverse divergence of the incident beam. This approach is possible since in the waist of the incident beam. Fig. 1b shows a calculation of the EW intensity distribution for realistic experimental parameters rad, m and mm. This distribution is used to calculate the absorption via the integrated scattering rate.
3 Time of flight experiments
In a first experiment we use evanescent wave absorption to detect a cloud of cold atoms falling on a glass surface. Our setup consists of a right angle, uncoated, BK7 prism, mounted inside a vacuum cell with a background Rb pressure of mbar. About 87Rb atoms are captured from the background gas in a magneto optical trap (MOT), located 7 mm above the prism surface and are subsequently cooled to 4.5K in optical molasses. They are released in the F=2 hyperfine ground state and fall towards the prism due to gravity. Inside the prism a weak, resonant, -polarized probe beam undergoes total internal reflection. Its angle of incidence was determined with rad accuracy by a method that will be discussed later. The probe beam has a waist of m ( radius) resulting in a divergence of 500 rad inside the prism. At the prism surface it has a waist ( intensity radius) of m. The total power of the incident beam is W.
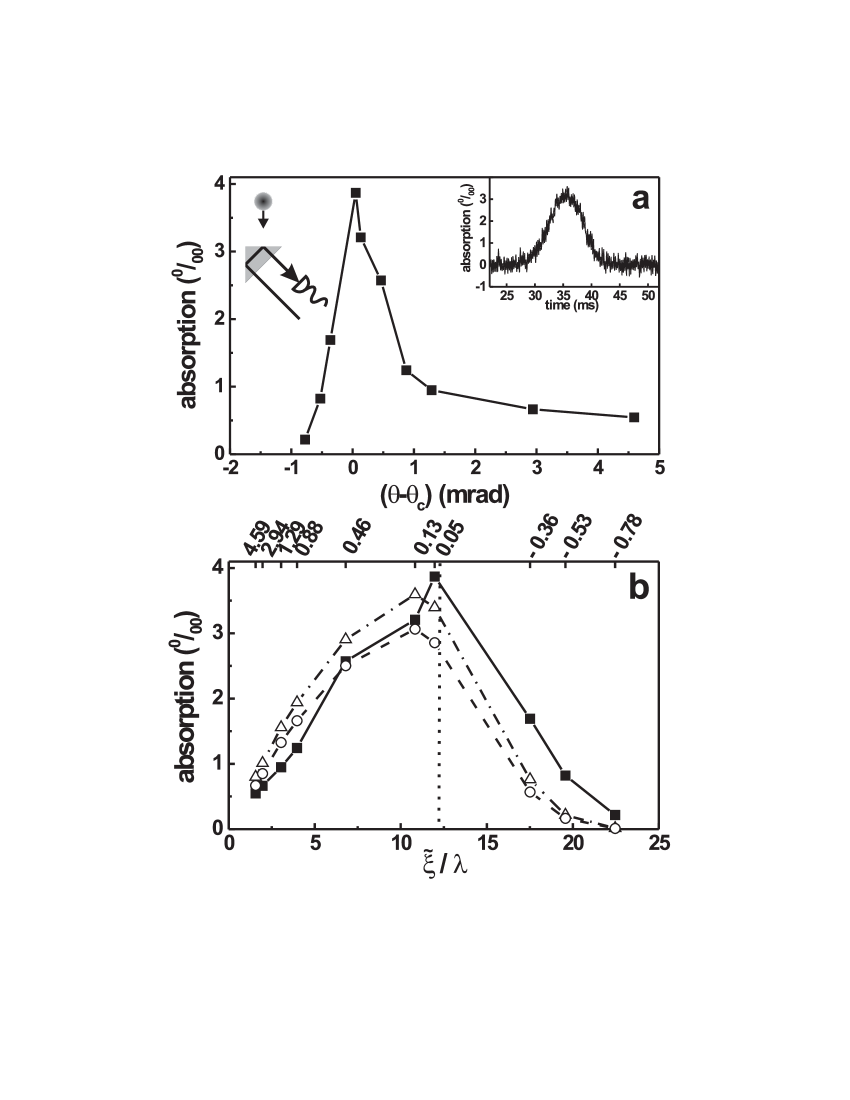
We measure the absorption in the reflected wave on a photodiode which is amplified by a factor by a fast, low noise current amplifier (Femto HCA-1M-1M). A typical absorption trace is shown in the inset of Fig. 1a. The maximum absorption of time traces for different values of the angle of incidence are plotted in Fig. 2a. From this graph it is clear that the absorption is highest for angles of incidence very close to the critical angle. In order to analyze these results we consider the atomic density to be uniform perpendicular to the surface, since the penetration of the EW (m) is much smaller than the size of the cloud (mm). It is crucial to take the finite probe beam diameter into account. This leads to a finite range of angles of incidence so that the EW is no longer exponential as described above. We define an effective decay length by where the distribution function is the normalized intensity distribution at the transverse position where the intensity at the surface is maximum. For a plane incident wave . In Fig. 2b the solid squares represent the same absorption data as shown in Fig. 2a, but plotted versus . Absorption increases with , but decreases beyond a value . This decrease for larger occurs because the amplitude of the EW quickly drops for angles of incidence smaller than .
We compare our data to the absorption as calculated using two different approaches. The first method is to calculate the scattering of evanescent photons by the atoms near the surface, where we assume that the transmission coefficients are not changed by the atoms. The scattered power is calculated as
where is the local saturation parameter, is the saturation intensity mW/cm2, is the local evanescent intensity, given by Eq. (2), is the local density, is the energy of a photon and MHz is the natural linewidth. The factor appears because linearly polarized light is used. The integration is over the entire volume of the evanescent wave. Because the absorption is so low, Beer’s law remains in its linear regime. Obviously saturation effects are taken into account. We also account for the Van der Waals potential, which leads to a decrease in the atomic density close to the surface. Finally also the transverse density distribution of the atomic cloud is taken into account. Neglecting these last three effects would increase the calculated absorption by approximately 20%. The open circles in Fig. 2b are the results of this calculation for a density near the prism of cm-3.
For another measurement (not shown) with an angle of incidence rad and an evanescent probe power of W, the measured maximum absorption of resulted in a calculated density of cm-3. This value agrees very well with the density of cm-3 derived from conventional absorption images with a CCD camera.
Close to a dielectric surface the radiative properties of atoms are altered CouCouMer96 (15). The natural linewidth of a two-level atom can be up to 2.3 times larger than the natural linewidth in free space. However, including this effect in the calculations only increased the calculated absorption by about 2%, which is well within the measurement uncertainty. By decreasing both the probe intensity and the decay length this effect should start to play a role.
As a cross check, the second method determines the absorption by describing the atomic cloud by a complex index of refraction , with the resonant cross section for linearly polarized light and the density at the prism surface. Using this index of refraction to calculate the reflected intensity also yields the absorption. The reflected field is determined by evaluating
| (3) | |||||
with the wavevector perpendicular to the surface and is the Fresnel coefficient for reflection for polarized light. The same normalization as for Eq. (1) was used. The reflected intensity is given by . Saturation effects are not included. Since finally only the total absorbed power is important, it is not necessary to incorporate the transverse distribution in these calculations. The open triangles in Fig. 2b show the results of these calculations for various angles of incidence. The absorption for a maximum density near the prism surface of cm-3 calculated with the complex index of refraction is slightly higher than the absorption calculated from the scattering of evanescent photons, mainly because saturation effects were neglected.
4 Trapping
In a second experiment we used evanescent waves to detect atoms trapped close to the surface in a standing light field. We load and trap the atoms using the scheme as described in previous work SprVoiHeu00 (6). Cold atoms are prepared as in the time of flight experiment. During their fall the atoms are optically pumped to the F hyperfine ground state. On the vacuum side of the prism surface a repulsive EW potential is created by total internal reflection of a 90 mW, TM polarized laser beam with a waist of 500m and blue detuned by 0.2 - 1 GHz with respect to the FF’ transition of the D1 line. This potential acts as a mirror for atoms. The decay length of the EW can be controlled by changing the angle of incidence of the laser beam VoiWolHeu00 (16). By scattering EW photons, the atoms can make a spontaneous Raman transition to the F=2 hyperfine ground state, for which the repulsive EW potential is lower. This results in a virtually complete loss of their gravitationally acquired kinetic energy WolVoiHeu01 (17).
The trapping laser is a linearly polarized, 1.3W laser beam, red detuned by about 85 GHz with respect to the D2 line. It is reflected from the vacuum side of the uncoated prism surface, creating a standing wave (SW) with a visibility of 0.38. The angle of incidence is nearly normal, 25 mrad. The spot size at the prism surface is m m ( radii). For atoms in the F=1 hyperfine ground state the EW potential is dominant, whereas for the F=2 hyperfine ground state the SW potential is dominant. Atoms that are Raman transferred to F=2 near their motional turning point can be trapped in the SW potential. Only a few potential minima will be occupied due to the highly localized optical scattering of the EW. When the atoms fall towards the prism both the EW and the SW are off. Both are turned on 1 ms before the maximum atom density reaches the prism surface. In order to decrease the scattering rate, the EW is switched off after 2 ms, after which the loading of the SW trap stops.
The EW probe beam is aligned by overlapping it with the EW bouncer beam, whose angle can be set with an accuracy of 25 rad. The overlap could be checked over a distance of 1.5 m, resulting in an uncertainty in the angle of rad. During the trapping experiments the probe angle of incidence was kept constant at rad and the power of the probe beam is W. At the prism surface it had a waist ( intensity radius) of m. The probe was resonant for atoms in the hyperfine ground state and was turned on at least 14 ms after shutting the EW bouncer beam in order to be certain that no falling atoms were present and only trapped atoms would be probed.
Since the trap is red detuned, the atoms will be trapped in the intensity maxima. In the center of the trap the scattering rate in these maxima is calculated to be 7 ms-1 and the ground state light shift is MHz. The trap depth here is only MHz since the fringe visibility of the standing wave is 0.38. The trap frequency is kHz, which results in approximately 24 bound levels. The resonance frequency of trapped atoms is blue-shifted by , due to the light shift of the excited state.
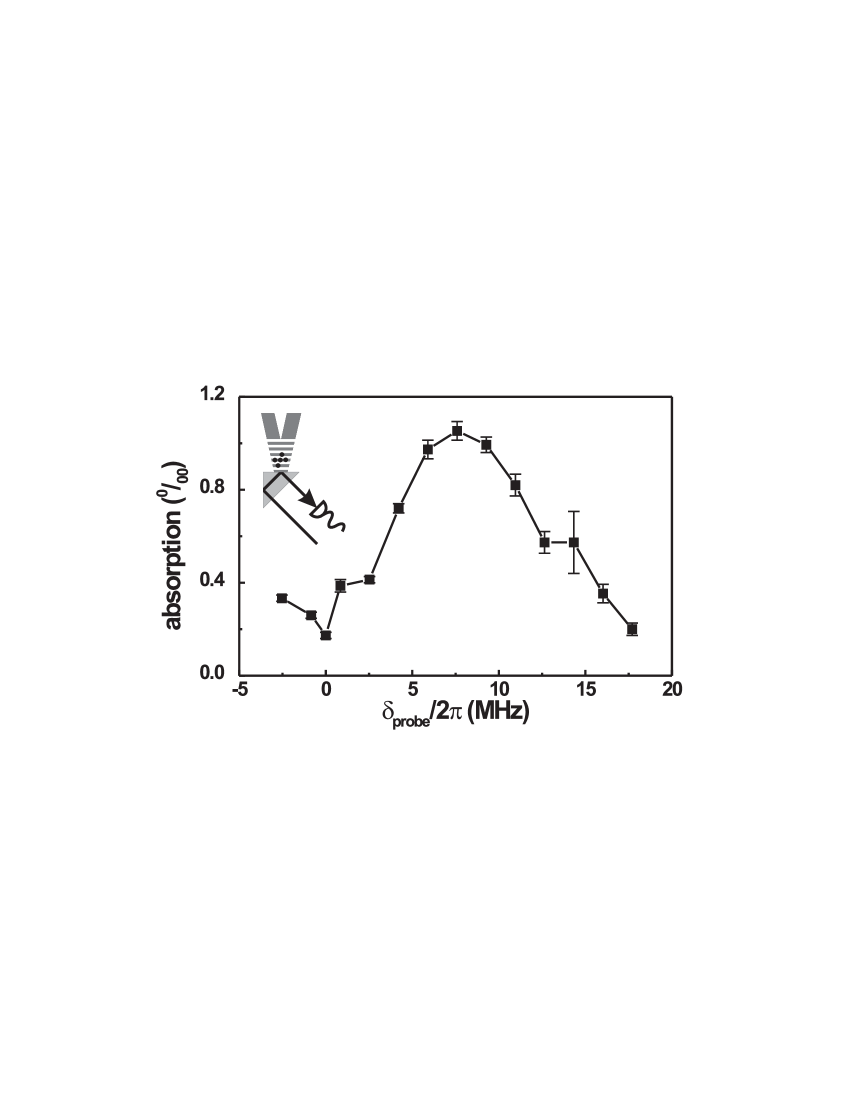
Fig. 3 shows the absorption of an evanescent probe beam by atoms trapped in the standing wave. The evanescent wave bouncer is blue detuned by 550 MHz and has a decay length . The evanescent probing technique was used to optimize the trap loading by varying the bouncer detuning. The maximum absorption is observed for a detuning of the EW probe of 8 MHz. The measured linewidth is larger than the 6 MHz atomic linewidth, probably due to inhomogeneous broadening. There are two contributions to the broadening. Firstly, since the trap laser has a Gaussian profile the atoms encounter a spatially varying light shift. Secondly atoms in higher excited vibrational states will encounter a smaller light shift. It is not possible to reliably retrieve these detailed distributions from our measured curve. It is however possible to make a good estimate of the total number of trapped atoms. The relative absorption curve in Fig. 3 is, for low saturation, described by
| (4) |
which is similar to the scattering analysis of the falling atoms, but inhomogeneously broadened by means of the convolution with the Lorentz function. The factor is the power of the incident probe beam and is the distribution of atoms in the hyperfine ground state over spatial coordinates and light shifts. By integrating Eq. (4) over the detuning (the area under the curve of Fig. 3), the integration of the Lorentzian over yields . The integration over , for which the integrand is now only , yields the density of atoms .
From comparing the kinetic energy of the falling atoms in to the trap depth when the atoms are pumped to , it follows that mainly the third and fourth potential minima will be populated. An underestimate of the number of atoms can be obtained by assuming the probe intensity constant over the trap region (which is valid if the evanescent probe size is much larger than the trap size) and all atoms are in the third minimum. Eq. (4) then reduces to , with the total number of trapped atoms and where denotes the saturation parameter in the third potential minimum. From this a number of trapped atoms in the hyperfine ground state of can be calculated after 14 ms of trapping. The total number of trapped atoms will be because the steady state groundstate population will be 0.5 times the population due to scattering by the standing wave with the present detuning. The populations of the magnetic sublevels of one hyperfine groundstate are equal to within 1%. By comparison with previous measurements we deduce a lifetime of 14.3 ms. An extrapolation results in about trapped atoms at . The assumption that the evanescent probe size is much larger than the trap size is not completely valid. Taking the correct radii into account leads to a 22% increase, thus trapped atoms. Assuming the transverse trap distribution equal to the trapping laser, the vertical trap radius to be and the atoms to be distributed mainly over two potential minima, the density becomes cm-3, which is about 100 times higher than the density of the atoms falling onto the prism.
5 Conclusions and outlook
We have shown that the absorption of a weak, resonant evanescent wave can be used to selectively detect cold atoms near () a dielectric surface. A model treating the absorption by scattering evanescent photons was suitable to describe the absorption. When calculating the evanescent intensity distribution, the Gaussian character of the incident beam had to be taken into account in order to quantitatively understand the absorption for angles of incidence very close to the critical angle.
By detecting cold atoms falling onto the dielectric surface for different angles of incidence of the probe beam we have verified our quantitative description of the dependence of the absorption on the angle of incidence of the probe beam. By detecting cold atoms trapped in standing wave potential minima close to the surface we have determined that we have trapped more than atoms initially. This results in an increase of the density of two orders of magnitude with respect to the approaching atoms.
The technique can be extended to using a CCD camera so that a transverse distribution of the atoms can be measured. By performing measurements for different angles of incidence of the probe beam, it should be possible to obtain information about the distribution of atoms perpendicular to the surface.
Acknowledgements.
This work is part of the research program of the “Stichting voor Fundamenteel Onderzoek van de Materie” (Foundation for the Fundamental Research on Matter) and was made possible by financial support from the “Nederlandse Organisatie voor Wetenschappelijk Onderzoek” (Netherlands Organization for the Advancement of Research). R.S. has been financially supported by the Royal Netherlands Academy of Arts and Sciences.References
- (1) W. Hänsel, J. Reichel, P. Hommelhoff and T.W. Hänsch, Phys. Rev. Lett. 86, 608 (2001).
- (2) D. Müller, E.A. Cornell, M. Prevedelli, P. Schwindt, A. Zozulya and D. Anderson, Opt. Lett. 25, 1382 (2000).
- (3) D. Cassettari, B. Hessmo, R. Folman, T. Maier and J. Schmiedmayer, Phys. Rev. Lett. 85, 5483 (2000).
- (4) W. Hänsel, P. Hommelhoff, T.W. Hänsch and J. Reichel, Nature 413, 498 (2001).
- (5) H. Ott, J. Fortagh, G. Schlotterbeck, A. Grossmann and C. Zimmermann, Phys. Rev. Lett. 87, 230401 (2001).
- (6) R. J. C. Spreeuw, D. Voigt, B. T. Wolschrijn and H. B. van Linden van den Heuvell, Phys. Rev. A 61, 053604 (2000).
- (7) Yu. B. Ovchinnikov, I. Manek and R. Grimm, Phys. Rev. Lett. 79, 2225 (1997).
- (8) H. Gauck, M. Hartl, D. Schneble, H. Schnitzler, T. Pfau and J. Mlynek, Phys. Rev. Lett. 81, 5298 (1998).
- (9) A. Aspect, R. Kaiser, N. Vansteenkiste, P. Vignolo, C.I. Westbrook, Phys. Rev. A 52, 4704 (1995).
- (10) K. Kiersnowski, L. Józefowski and T. Dohnlik, Phys. Rev. A ,57, R4079 (1998).
- (11) K. Zhao, Z. Wu and H.M. Lai, J. Opt. Soc. Am. B 18, 1904 (2001).
- (12) F. Goos and H. Hänchen, Ann. Phys. (Leipzig) 1, 333 (1947).
- (13) C. Chiu Chan and T. Tamir, J. Opt. Soc. Am. A 4, 655 (1987).
- (14) F.I. Baida, D. van Labeke and J.-M. Vigoureux, J. Opt. Soc. Am. A 17, 858 (2000).
- (15) J.-Y. Courtois, J.-M. Courty and J.C. Mertz, Phys. Rev. A 58, 1862 (1996).
- (16) D. Voigt, B.T. Wolschrijn, N. Bhattacharya, R.J.C. Spreeuw and H.B. van Linden van den Heuvell, Phys. Rev. A 61, 063412 (2000).
- (17) B.T. Wolschrijn, D. Voigt, R. Janssen, R.A. Cornelussen, N. Bhattacharya, R.J.C. Spreeuw and H.B. van Linden van den Heuvell, Phys. Rev. A 64, 065403 (2001).