MUON ENERGY ESTIMATE THROUGH MULTIPLE
SCATTERING WITH THE MACRO DETECTOR
The MACRO Collaboration
M. Ambrosio12,
R. Antolini7,
G. Auriemma14,a,
D. Bakari2,17,
A. Baldini13,
G. C. Barbarino12,
B. C. Barish4,
G. Battistoni6,b,
Y. Becherini2,
R. Bellotti1,
C. Bemporad13,
P. Bernardini10,
H. Bilokon6,
C. Bloise6,
C. Bower8,
M. Brigida1,
S. Bussino18,
F. Cafagna1,
M. Calicchio1,
D. Campana12,
A. Candela7,
M. Carboni6,
R. Caruso9,
F. Cassese12,
S. Cecchini2,c,
F. Cei13,
V. Chiarella6,
B. C. Choudhary4,
S. Coutu11,i,
M. Cozzi2,
G. De Cataldo1,
M. De Deo7,
H. Dekhissi2,17,
C. De Marzo1,
I. De Mitri10,
J. Derkaoui2,17,
M. De Vincenzi18,
A. Di Credico7,
M. Dincecco7,
O. Erriquez1,
C. Favuzzi1,
C. Forti6,
P. Fusco1,
G. Giacomelli2,
G. Giannini13,d,
N. Giglietto1,
M. Giorgini2,
M. Grassi13,
L. Gray7,
A. Grillo7,
F. Guarino12,
C. Gustavino7,
A. Habig3,p,
K. Hanson11,
R. Heinz8,
E. Iarocci6,e,
E. Katsavounidis4,q,
I. Katsavounidis4,r,
E. Kearns3,
H. Kim4,
S. Kyriazopoulou4,
E. Lamanna14,l,
C. Lane5,
D. S. Levin11,
M. Lindozzi7,
P. Lipari14,
N. P. Longley4,h,
M. J. Longo11,
F. Loparco1,
F. Maaroufi2,17,
G. Mancarella10,
G. Mandrioli2,
A. Margiotta2,
A. Marini6,
D. Martello10,
A. Marzari-Chiesa16,
M. N. Mazziotta1,
D. G. Michael4,
P. Monacelli9,
T. Montaruli1,
M. Monteno16,
S. Mufson8,
J. Musser8,
D. Nicolo’;13,
R. Nolty4,
C. Orth3,
G. Osteria12,
O. Palamara7,
V. Patera6,e,
L. Patrizii2,
R. Pazzi13,
C. W. Peck4,
L. Perrone10,
S. Petrera9,
P. Pistilli18,
V. Popa2,g,
A. Raino’;1,
J. Reynoldson7,
F. Ronga6,
A. Rrhioua2,17,
C. Satriano14,a,
E. Scapparone7,t,
K. Scholberg3,q,
A. Sciubba6,e,
P. Serra2,
M. Sioli2,
G. Sirri2,
M. Sitta16,o,
P. Spinelli1,
M. Spinetti6,
M. Spurio2,
R. Steinberg5,
J. L. Stone3,
L. R. Sulak3,
A. Surdo10,
G. Tarle’;11,
E. Tatananni7,
V. Togo2,
M. Vakili15,s,
C. W. Walter3
and R. Webb15.
1. Dipartimento di Fisica dell’Università di Bari and INFN, 70126 Bari,
Italy
2. Dipartimento di Fisica dell’Università di Bologna and INFN, 40126
Bologna, Italy
3. Physics Department, Boston University, Boston, MA 02215, USA
4. California Institute of Technology, Pasadena, CA 91125, USA
5. Department of Physics, Drexel University, Philadelphia, PA 19104, USA
6. Laboratori Nazionali di Frascati dell’INFN, 00044 Frascati (Roma), Italy
7. Laboratori Nazionali del Gran Sasso dell’INFN, 67010 Assergi (L’Aquila),
Italy
8. Depts. of Physics and of Astronomy, Indiana University, Bloomington,
IN 47405, USA
9. Dipartimento di Fisica dell’Università dell’Aquila and INFN, 67100
L’Aquila, Italy
10. Dipartimento di Fisica dell’Università di Lecce and INFN, 73100 Lecce,
Italy
11. Department of Physics, University of Michigan, Ann Arbor, MI 48109,
USA
12. Dipartimento di Fisica dell’Università di Napoli and INFN, 80125
Napoli, Italy
13. Dipartimento di Fisica dell’Università di Pisa and INFN, 56010 Pisa,
Italy
14. Dipartimento di Fisica dell’Università di Roma ”La Sapienza” and
INFN, 00185 Roma, Italy
15. Physics Department, Texas A&M University, College Station, TX 77843,
USA
16. Dipartimento di Fisica Sperimentale dell’Università di Torino and
INFN, 10125 Torino, Italy
17. L.P.T.P, Faculty of Sciences, University Mohamed I, B.P. 524 Oujda,
Morocco
18. Dipartimento di Fisica dell’Università di Roma Tre and INFN Sezione
Roma Tre, 00146 Roma, Italy
Also Università della Basilicata, 85100 Potenza, Italy
Also INFN Milano, 20133 Milano, Italy
Also Istituto TESRE/CNR, 40129 Bologna, Italy
Also Università di Trieste and INFN, 34100 Trieste, Italy
Also Dipartimento di Energetica, Università di Roma, 00185 Roma, Italy
Also Institute for Nuclear Research, Russian Academy of Science, 117312
Moscow, Russia
Also Institute for Space Sciences, 76900 Bucharest, Romania
Macalester College, Dept. of Physics and Astr., St. Paul, MN 55105
Also Department of Physics, Pennsylvania State University, University
Park, PA 16801, USA
Also Dipartimento di Fisica dell’Università della Calabria, Rende
(Cosenza), Italy
Also Department of Physics, James Madison University, Harrisonburg,
VA 22807, USA
Also RPD, PINSTECH, P.O. Nilore, Islamabad, Pakistan
Also Dipartimento di Scienze e Tecnologie Avanzate, Università del
Piemonte Orientale, Alessandria, Italy
Also U. Minn. Duluth Physics Dept., Duluth, MN 55812
Also Dept. of Physics, MIT, Cambridge, MA 02139
Also Intervideo Inc., Torrance CA 90505 USA
Also Resonance Photonics, Markham, Ontario, Canada
Now at INFN Bologna, Via Irnerio 46, 40126 Bologna, Italy
Abstract
Muon energy measurement represents an important issue for any experiment addressing neutrino induced upgoing muon studies. Since the neutrino oscillation probability depends on the neutrino energy, a measurement of the muon energy adds an important piece of information concerning the neutrino system. We show in this paper how the MACRO limited streamer tube system can be operated in drift mode by using the TDC’s included in the QTPs, an electronics designed for magnetic monopole search. An improvement of the space resolution is obtained, through an analysis of the multiple scattering of muon tracks as they pass through our detector. This information can be used further to obtain an estimate of the energy of muons crossing the detector. Here we present the results of two dedicated tests, performed at CERN PS-T9 and SPS-X7 beam lines, to provide a full check of the electronics and to exploit the feasibility of such a multiple scattering analysis. We show that by using a neural network approach, we are able to reconstruct the muon energy for 40 GeV. The test beam data provide an absolute energy calibration, which allows us to apply this method to MACRO data.
PACS: 29.40.C, 29.40.G, 25.30.M
1 Introduction
The most recent studies of neutrino induced up-going muons have been performed by two experiments: Super–Kamiokande[1], using a water Cherenkov detector, and MACRO[2], tagging neutrino events with a time of flight technique. Both experiments observed a flux deficit and a distortion of the up-going muon angular distribution with respect to the Monte Carlo expectation. The oscillation probability of neutrinos depends on the oscillation parameters (, ) and on the ratio L/E, where L is the distance between neutrino production and interaction point, while E is the neutrino energy. The energy of up-going neutrinos, interacting in the rock below the apparatus, is shared by the up-going muon and by the hadrons. Independent of the detector resolution, a precise measurement of the muon energy is prevented by the energy lost by the muon in the rock, while the hadrons are absorbed in the rock. Nevertheless the residual muon energy can in principle be measured. In this paper we explore the possibility of performing such a measurement relying on muon multiple scattering(MS). The r.m.s. of the lateral displacement of the muon trajectory on a projected plane of material with depth X and radiation length , can be written as:
| (1) |
where p is in GeV/c and for MACRO, X25/cos, giving for vertical muons 10/E(GeV).
For a given amount of crossed material, the capability of measuring track deflection is possible only when the particle displacement due to the multiple scattering is larger than the detector space resolution. The space point resolution of the tracking system of MACRO’s (3x3) cross section streamer tubes is of the order of 1 , and therefore provides a muon energy estimate through MS up to 10GeV. Supposing =() and 1, the neutrino induced up-going muons, are not expected to experience neutrino oscillation at all energies. At the up-going muon median energy in MACRO, 11 GeV[3], the oscillation probability is still as high as 50(Fig. 1), while it’s just 10 for =40 GeV: an improvement of the space resolution offers the possibility of evaluating muon energy over a sufficiently wide energy range.
In order to achieve this goal, we retrieve drift time information from the limited streamer tubes by using the TDC’s implemented in the MACRO QTP electronic system[5].
In this paper we describe the application of this electronics to evaluate the MS effect along a muon track, showing the results obtained with two dedicated tests, performed at CERN PS-T9 and SPS-X7 beam lines, in October 2000 and August 2001 respectively. The application of the method to MACRO data is then presented.
2 The MACRO limited streamer tubes in drift mode
The MACRO streamer tube system[6] consists of about 5,600 chambers; each chamber is made of 8 streamer tubes with cross section (3x3) and 1200 length, for a total of about 50,000 wires. These tubes were built in “coverless” mode, i.e. the electric field of the inner four walls is not exactly the same. Despite this feature as well as the large cell dimension, the intrinsic space resolution of these chambers can be quite good, as demonstrated in ([7]) where using a MACRO streamer tube in drift mode, a resolution of 250 was obtained using standard Lecroy 2228A TDC (0.25 ns/bin). Such resolution has to be considered as the ultimate resolution achievable with this device.
Although the MACRO streamer tube electronics does not contain a high resolution TDC system, information on streamer timing can be extracted using the QTP system[5]. This electronics, designed for our magnetic monopole search[4], consists of a ADC/TDC system and acts as a 640 memory, during which the charge, the arrival time and the width of the streamer pulse of the particle crossing the cell are recorded. A slow particle in MACRO () may take more than 500 s to cross the detector. The QTP-TDC system allows us to distinguish randomly distributed background hits in this time window from a genuine slow particle, which, during the crossing time of the detector, describes a line in the space-time plane. For the magnetic monopole reconstruction optimization, a distributed clock of 20/3 MHz was chosen, resulting in an equivalent TDC bin width of 150 ns. This clock frequency is quite coarse for drift time measurements in a single cell, given that the maximum drift time for MACRO streamer tubes, operated with a He(73)/n-pentane(27) mixture, is 600ns. The ultimate resolution that can be therefore obtained with such a system is T/1.9mm, which is about an order of magnitude greater than the intrinsic precision of the streamer tube, operated in drift mode. Nevertheless, if such improved resolution could be achieved, it would be sufficient to estimate up-going muon energies up to 30-40 GeV.
In order to reduce the number of electronic channels, a single MACRO QTP channel, serves the OR of 4 chambers, for a total of 32 wires. Selecting only planes with a single fired tube, the association with the fired QTP channel is uniquely determined.
Given that our electronics was not designed for drift time measurements, the relative linearity was tested only for the much larger time scale of 500s rather than 600 ns. To avoid any systematic effects and to fully understand the capability of the QTP system in this context, we decided to test the electronics in a beam test at CERN PS-T9.
3 Streamer tube system performance in drift mode
To study the QTP-TDC’s linearity, the drift velocity in He/n-pentane mixture and to develop the software used for muon tracking, we performed a test beam run in CERN PS-T9 beamline in October 2000.
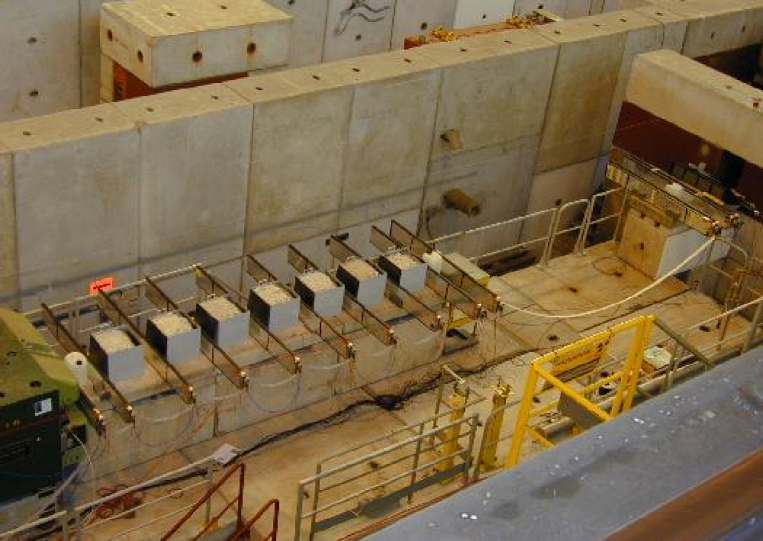
For these tests, we reproduced a slice of the MACRO detector using 14 coverless streamer tube chambers, (253200), filled with the standard MACRO gas mixture. The rock absorbers reproduced as much as possible those of MACRO. We built 7 iron boxes, (404032), filled with rock excavated from the Gran Sasso tunnel (=2.0 g/). As in MACRO, each streamer tube chamber was equipped with a streamer tube read-out card and the analog output of a chamber was sent to a QTP channel. The digital output, OR of each chamber signals, was sent to a Lecroy 2228A TDC. Such double measurement of the drift time allowed us to make a comparison between QTP-TDC’s and Lecroy TDC’s on an event by event basis. The test beam layout is shown in Fig. 2. The trigger was provided by a fast coincidence of the scintillators S1, S2, S3. The last scintillator, following a 60 iron slab, suppresses the , contamination in the beam at high energies. The data acquisition was performed using LabView, running on a MacIntosh Quadra 950. Fig. 3 shows the plateau curve of the streamer tubes used in the test beam. We operated these chambers at HV=4050 V, where a full efficiency is reached. We collected 60 runs, with the beam stoppers closed, for a total of about muons, with energy ranging from 2 to 12 GeV. Several runs were also taken with the rock absorbers removed, to study the QTP electronics and to allow for space resolution evaluation, without contributions of multiple scattering in the absorbers at these low muon energies.
First, we evaluated the QTP-TDC’s linearity, by comparing its data with that recorded by the Lecroy TDC’s. Fig. 4 shows the relationship between these two measurements, for values of the QTP-TDC system(75 ns, 225 ns, 375 ns, 525 ns), where we took the average of the Lecroy TDC’s time distribution. The errors represents the width of the QTP-TDC’s and the rms of the corresponding Lecroy-TDC time distributions.
Although the maximum drift time in our streamer tubes is about 600 ns, due to the non-homogeneity of the electric field in the streamer tube cell[7], the region between 500 nsT600 ns is not uniformly populated. We evaluated that this effect accounts for the 10 observed shift-up of the QTP-TDCs, with respect to the expected average in that bin.
For T450 ns there is full consistency with Lecroy-TDC measurement. Considering the coarseness of QTP-TDC we conclude that the comparison if fully satisfactory. Therefore we used the central value of each QTP-TDC bin (150 ns wide).
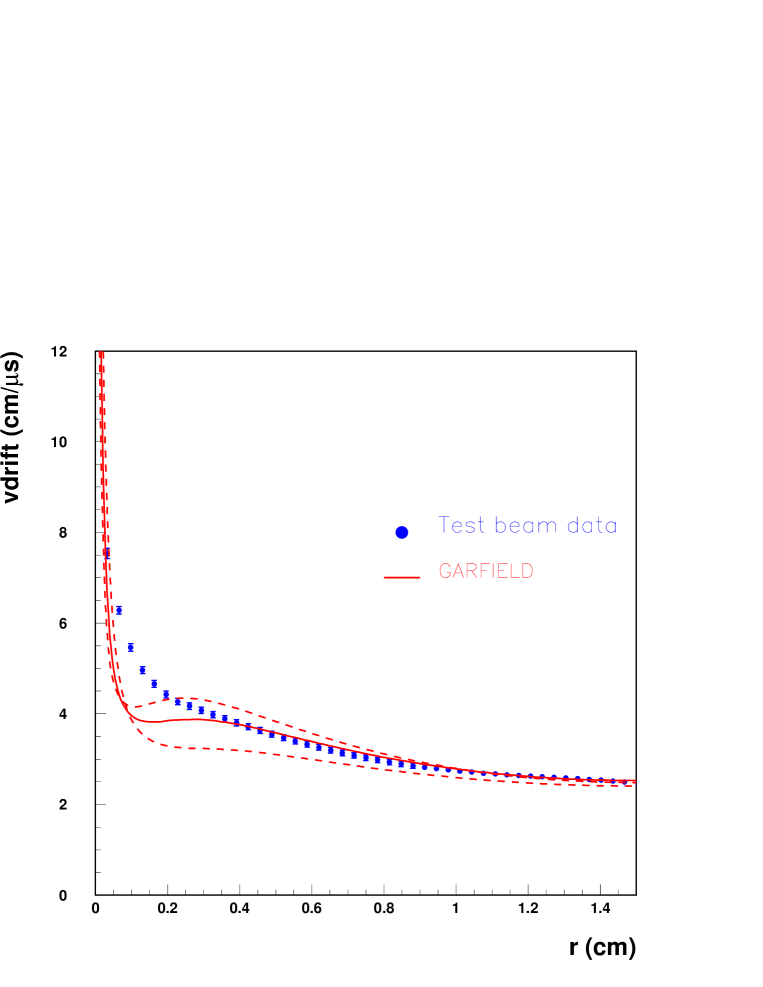
We then studied the drift velocity in He/n-pentane mixture. Since in the test beam configuration the N muons hit the detector at normal incidence:
| (2) |
The evaluation of can be therefore obtained fitting the Lecroy TDC spectrum distribution.
Fig. 5 shows the experimental results obtained, where we have superimposed the results of a GARFIELD[8] simulation for comparison. Such code performs a detailed simulation of electron drift and signal generation in gaseous wire detectors. We described the electrostatic structure of a limited streamer tube (an anode wire at the center of a square cross section cathode) by means of a lattice made of 81 wires, spaced by 3 cm, kept at the proper voltage (alternating the sign): the central cell in this lattice corresponds to the actual cell. The drift velocity as a function of electric field has been computed assuming the standard MACRO gas mixture by using the GARFIELD-MagBoltz interface. The experimental data are in agreement with the simulation.
Once the TDC linearity has been checked and the has been measured, the test beam data can be used to measure the space resolution. Fig. 6 shows the residuals distribution for streamer tubes in drift mode using the Lecroy TDC’s and the QTP-TDC system. Using the LeCroy TDC data, we find a resolution of 500 m, while for the QTP-TDC data we obtained a resolution of 2 mm. This resolution limit is very close to that expected based on QTP-TDC’s time resolution =150ns/ 4 /150ns/1.9 mm.
4 Study of the MACRO space resolution
To estimate the performance of the streamer tubes operated in drift mode in MACRO, we analysed a down-going muon sample, whose average energy is 320 GeV[9].
The analysis was performed by using the following steps:
1) We considered the muon track reconstructed with the standard MACRO
tracking (i.e. no QTP information is used at this stage);
2) We selected those hits containing only a single fired tube;
3) For each hit we looked at the corresponding QTP-TDC value in a time window of
2 s. Given the background rate in the MACRO
streamer tubes, 40 Hz/,
this corresponds to 480 Hz on 4 chambers ( 1 QTP channel ), giving
a probability for a spurious hit to mimic a genuine
QTP - TDC count;
4) After converting the TDC values to drift radii, by using the drift
velocity measured in the test beam, a global fit of the track is performed.
As a first step, we used this procedure to perform an alignment of the detector database. The standard MACRO database was computed using the streamer tube data in digital mode, hence to take advantage of the improved space resolution achieved by this method, we first had to upgrade the precision of the detector database. To accomplish this we used 15 down-going muon tracks. Since the MACRO streamer tubes, 1200 long, are made of PVC, a flexible material, part of the misalignment may come from the deviation from a straight line along the main axis of each streamer tube (sagitta effect). We therefore divided the streamer tube length in six slices and computed the residuals in each slice separately. We generated a matrix of (14,2304,6) elements, where the first index runs over the number of horizontal planes, the second over the wire number and the last over the portion of the wire along its main axis. We adopted an iterative procedure, by adding at each step, for each element of the matrix, the mean value of the gaussian of the residuals belonging to each portion of wire. As a results of this procedure, Fig. 7 shows the distribution of the track residuals for the MACRO streamer tube system in drift mode(black circles) and the MACRO simulation, GEANT based, (continuous line). The residuals of the down-going muons have a , in good agreement with the MACRO simulation. The continuous line shows the residuals distribution for the streamer tube system in digital mode (), where we see an improvement of the resolution by a factor 3.5 has been obtained.
For MACRO data however, we expect the resolution to be worse than that measured in the PS-T9 test beam (=2mm) due to two effects. From our simulation, the most important contribution accounting for this difference, comes from -rays and radiated photons produced in the rock absorbers. Both of these effects spoil the space resolution by producing streamers closer to the wire than those coming from the muon, resulting in smaller drift radii. Moreover the MACRO down-going muons, despite an average energy of 320 GeV still suffer multiple scattering, mainly coming from the low energy tail of this distribution.
These hypotheses were tested during a second test beam, performed at SPS-X7 in August 2001, where high energy muons with 15 GeV E 100 GeV were available, with the same setup used at PS-T9(Fig 8). The sigma of the residuals obtained with =100 GeV and rock absorbers inserted, was measured =3 mm, in good agreement with that obtained using the MACRO down-going muon data.
5 Muon energy estimate
A muon energy estimate can be performed in MACRO by measuring the amount of muon multiple scattering in the rock absorbers. The tests performed at CERN PS/SPS beam lines, allowed us to demonstrate this as well as offer the possibility of calibrating the MACRO system.
For each muon event we computed the following variables, sensitive to muon
multiple scattering. The first three variables are just outputs from the
track fitting procedure:
1) The highest residual of the 14 measurements;
2) The average of the residuals; and
3) The standard deviation of the residuals.
For each track, we then considered the hit with the highest height and
that with the lowest height in the lower part of the detector
( i.e. excluding the Attico hits). Then we selected a median hit, having
the maximum distance in height from the other two hits.
From this we constructed the next two variables:
4) The difference of the residuals of the highest hit and of the median
hit; and
5) The difference of the residuals of the lowest hit and of
the median hit.
Lastly, we defined a “progressive fit” as the absolute value
of the residual (i=1,14) as a function of the height of
the streamer tube plane.
For a high energy muon, the average residual is roughly constant
in the different planes, since the muon energy is almost constant
while crossing the experimental setup. For instance a 20 GeV muon
looses less than 5 of his energy after crossing the detector.
In contrast, a low energy muon
looses a high fraction of its energy, by ionization, crossing the rock
absorbers. As a result,
the average residuals are higher for the last crossed planes.
A linear fit of the absolute value of the residuals as a function
of the streamer tube number, gives a small
slope for high energy muons, while the slope is much larger
for low energy muons. Guided by this analysis we introduce the
following variables:
6) The slope of the “progressive-fit”; and
7) The intercept of the “progressive-fit”.
We followed a neural network approach(NN) in this analysis, choosing JETNET 3.0[10], a standard package with a multilayer perceptron architecture and with back-propagation updating. The NN was configured with 7 input variables quoted above and 1 hidden layer, selecting the Manhattan upgrading function. Fig. 9 shows the distribution of the variables quoted above and of the neural network output for muons with energy =100 GeV(continuous line) and for muons with energy =2 GeV(dotted line). Fig. 10 shows that the average neural network output increases as a function of the muon energy up to 40 GeV, saturating at higher energies.
The data collected during the PS test beam, provide an absolute energy calibration of the method, up to muon energy of 12 GeV. In order to check the neural network output in the whole energy range of Fig. 10, we used the data collected at the CERN SPS-X7 beam line.
In Fig. 10 the test beam data and the Monte Carlo prediction are compared: empty squares represent the Monte Carlo expectation, black circles show the PS-T9 test beam points, while full triangles are the SPS-X7 test beam data. The NN output obtained with the test beam data is properly reproduced by the Monte Carlo simulation. The muon energy can be reconstructed by inverting the curve shown in Fig. 10. Fig. 11 and Table 1 show the reconstructed energy for =2,4,12,40 GeV: data collected at PS-T9 test beam(full squares) and at SPS-X7 test beam (full triangles) are compared with the Monte Carlo expectation(continuous line), showing a reasonable agreement.
| (GeV) | 2. | 3. | 5. | 10. | 40. |
|---|---|---|---|---|---|
| Reconstructed energy | ( ) | () | () | () | () |
| (GeV) |
6 Conclusions
The use of the QTP-TDC’s, offers the possibility of using the MACRO limited streamer tube system in drift mode. The test beam run performed at CERN PS-T9 confirmed such possibility. The QTP system allows us to improve the streamer tube system space resolution by a factor of 3.5, from to 3 mm. These improvements were realized by using a neural network approach in order to obtain an energy estimate of muons crossing the detector. The average neural network output increases as a function of the muon energy up to 40 GeV. The comparison between Monte Carlo expectation and the test beam data shows a good agreement. This method offers the possibility to estimate the muon energy for neutrino induced upgoing muons in MACRO and thus to investigate the energy dependence of the neutrino oscillation signal.
Acknowledgements
We would like to thank the CERN PS staff for the fruitful cooperation during the test beam running. We would like to especially thank R. Coccoli, Luc Durieu and T. Ruf for their help. We are also indebted to the efforts of the CERN SPS staff and in particular to L. Gatignon and M. Hauschild for their help on the preparation of the low energy beam we used.
We gratefully acknowledge the support of the Director and of the staff of the Laboratori Nazionali del Gran Sasso and the invaluable assistance of the technical staff of the Institutions participating in the experiment. We thank the Istituto Nazionale di Fisica Nucleare (INFN), the U.S. Department of Energy and the U.S. National Science Foundation for their generous support of the MACRO experiment. We thank INFN, ICTP (Trieste), WorldLab and NATO for providing fellowships and grants (FAI) for non Italian citizens.
References
- [1] Superkamiokande Collaboration, Y. Fukuda et al., Phys. Lett B367 (1999) 185.
- [2] MACRO Collaboration, M. Ambrosio et al., Phys. Lett. B434 (1998) 451.
- [3] G. Battistoni et al., to be submitted to Astroparticle Physics.
- [4] MACRO Collaboration, M. Ambrosio et al., Astroparticle Physics 4(1995) 33.
- [5] M. Ambrosio et al., Nucl. Instr. & Meth A321 (1992) 609.
- [6] MACRO Collaboration, S.Ahlen et al., Nucl. Instr. & Meth. A234 (1993) 337.
- [7] G. Battistoni et al., Nucl. Instr. & Meth. A479 (2002) 309.
- [8] R. Veenhof, Nucl. Instr. & Meth.A419 1998, 726.
- [9] MACRO Collaboration, M. Ambrosio et al., Astroparticle Physics 10 (1999) 11.
- [10] C. Peterson et al., Comput. Phys. Commun., 81 (1994) 185.