homepage: ]http://www.strz.uni-giessen.de/ k3
homepage: ]http://www.mpi-hd.mpg.de/ato/tsrexp.html
Interference effects in the photorecombination of argonlike Sc3+ ions:
Storage-ring experiment and theory
Abstract
Absolute total electron-ion recombination rate coefficients of argonlike Sc3+(3s23p6) ions have been measured for relative energies between electrons and ions ranging from 0 to 45 eV. This energy range comprises all dielectronic recombination resonances attached to 3p3d and 3p4s excitations. A broad resonance with an experimental width of eV due to the 3p53d2 2F intermediate state is found at eV with a small experimental evidence for an asymmetric line shape. From R-Matrix and perturbative calculations we infer that the asymmetric line shape may not only be due to quantum mechanical interference between direct and resonant recombination channels as predicted by Gorczyca et al. [Phys. Rev. A 56, 4742 (1997)], but may partly also be due to the interaction with an adjacent overlapping DR resonance of the same symmetry. The overall agreement between theory and experiment is poor. Differences between our experimental and our theoretical resonance positions are as large as 1.4 eV. This illustrates the difficulty to accurately describe the structure of an atomic system with an open 3d-shell with state-of-the-art theoretical methods. Furthermore, we find that a relativistic theoretical treatment of the system under study is mandatory since the existence of experimentally observed strong 3p53d2 D and 3p53d4s 2D resonances can only be explained when calculations beyond LS-coupling are carried out.
pacs:
34.80.Kw, 34.80LxI Introduction
Dielectronic recombination (DR)
| (1) |
is a two-step electron-ion collision process, where in a first step a multiply-excited intermediate state is created by a resonant dielectronic capture (DC, inverse Auger) and in a second step that intermediate state decays by photon emission. Another possible recombination mechanism is radiative recombination (RR)
| (2) |
which by emission of a photon directly proceeds to a non-autoionizing state of the recombined ion. When both the initial and the final state including the photons emitted are the same, RR and DR are indistinguishable and they may interfere, with the signature of interference being an asymmetric DR resonance line profile in the energy differential recombination cross section Alber1984 ; Badnell1992 ; Zimmermann1997 ; Behar2000b . Asymmetric line shapes have experimentally so far been observed only in partial recombination cross sections of highly charged uranium ions Knapp1995a . Such an observation is interesting from a fundamental point of view since it questions the widely used independent processes approximation (IPA) in the calculation of RR+DR recombination cross sections.
One motivation for investigating the recombination of argonlike Sc3+(3s23p6) ions with free electrons is the theoretical predication by Gorczyca et al. Gorczyca1997 of a strongly asymmetric line shape for the 3p53dF DR resonance caused by interference between the recombination pathways
| (3) | |||||
Theoretically they predicted a Sc2+(3s23p53dF) resonance position of 14.6 eV and a width of 1.8 eV. The large width of the resonance is explained by the fact that it decays predominantly via a very fast Super-Coster-Kronig transition (reverse of the horizontal arrow in Eq. 3) with a calculated rate of s-1.
A first attempt to experimentally determine the line shape of the Sc2+(3p53dF) resonance by measuring the total Sc3+ recombination rate coefficient at a heavy-ion storage ring failed due to the rather large statistical uncertainty of that measurement Schippers1999a (see also Sec. II). However, distinct differences between theoretical and experimental peak positions were found and attributed to the fact that a correct theoretical description of the highly correlated 3p53d2 configurations is extremely difficult. Using Cowan’s Cowan1981 atomic structure code we find that the Sc2+(3p53d2) configuration gives rise to 45 fine structure components distributed over an energy interval of about 20 eV width. In order to account for correlation effects Hansen and Quinet Hansen1996 considered the interaction of 10 initial and 16 final configurations in the calculation of 3p63d 3p53d2 transition energies in Ca+. Still their result for the Ca+(3p63dD 3p53dF) transition energy deviates 0.76 eV from the experimental result (29.34 eV) determined by photoionization of metastable Ca+(3p63d) ions Mueller2001 . This again illustrates the difficulty to accurately describe inner shell transitions in atomic or ionic systems with open 3d-subshells. In this situation DR measurements (and complementary photoionization measurements) can yield valuable spectroscopic information on such systems.
Here we present new experimental as well as theoretical results for the total Sc3+ recombination rate coefficient. The experiment is a twofold extension of our previous work Schippers1999a . The new data have much smaller statistical uncertainties and they are extended to the much wider energy range 0–45 eV (previous range 12.2–18.2 eV) including all DR series limits due to 3p 3d and 3p 4s core excitations.
We have also carried out both nonperturbative and perturbative calculations for the + Sc3+ photorecombination. The nonperturbative method is based on the rigorous continuum-bound transition theory and the close-coupling R-matrix approach Zhao2000 . The perturbative evaluation is a treatment including radiative recombination (RR), dielectronic recombination (DR) and their interference. Our calculations reveal that three adjacent resonances mask the low energy side of the 3p53d2 2F resonance. This makes the experimental observation of the predicted Gorczyca1997 interference between the 3p53d2(3F) 2F DR resonance and the continuous RR cross section difficult. Moreover, we find that several experimental DR resonances not reproduced by the LS-coupling R-matrix calculations of Gorczyca et al. Gorczyca1997 are due to relativistic effects.
In Sec. II and Sec. III we outline our experimental and theoretical methods. Experimental and theoretical results are presented and discussed in Secs. IV.1 and IV.2, respectively. In Sec. IV.3 possible origins for the asymmetry of the 3p53d2(3F) 2F DR resonance are explored by theoretically considering interference between DR and RR as well as interference between overlapping DR resonances. Our main results are summarized in Sec. V.
II Experiment
The experiment was performed at the heavy ion storage ring TSR of the Max Planck Institut für Kernphysik (MPIK) in Heidelberg. Details of the experimental setup and the data reduction procedures can be found in Refs. Kilgus1992 ; Lampert1996 ; Schippers2000b ; Schippers2001c . The 45Sc3+ ions were accelerated by the MPIK tandem booster facility to their final energy and subsequently injected into the TSR. The rather low charge to mass ratio of leads to the rather unfavorable condition (see below) that the ion energy is limited by the maximum bending power of the TSR dipole magnets. With the maximum magnetic rigidity of Tm the highest accessible ion energy can be calculated from
| (4) |
to keV/u. In the storage ring the circulating 18.9 MeV Sc3+ ion beam was merged with the magnetically guided electron beam of the electron cooler. During electron-cooling, the electrons have to move with the same average velocity as the ions. This condition defines the cooling energy eV. In order to increase the phase space density of the already stored ions and thereby free phase space for the next injection pulse from the accelerator, electron-cooling was allowed to be effective for 2 seconds after each injection of ions. These ‘ecool-stacking’ cycles Grieser1991 were repeated three times until the accumulated ion current stabilized at values of up to 5 A. Before data taking was started a prolonged cooling interval of 5 s after the last injection allowed the ion beam to shrink to a final diameter of about 2 mm as verified with a beam profile monitor based on residual gas ionization Hochadel1994a .
During the measurement the electron energy in the laboratory frame was stepped through a preset range of values different from thus introducing non-zero relative energies
| (5) |
between ions and electrons. In the data analysis a relativistically correct expression Schippers2000b was used instead of Eq. 5. Recombined Sc2+ ions were counted with % efficiency as a function of cooler voltage on a single particle detector Rinn1982 located behind the first dipole magnet downstream of the electron cooler. The dipole magnet bends the circulating Sc3+ ion beam onto a closed orbit and separates the recombined Sc2+ ions from that orbit. In between two measurement steps the cooler voltage was first set back to the cooling value in order to maintain the ion beam quality and then set to a reference value at eV which is chosen to lead to a relative velocity where the electron-ion recombination coefficient is only due to a negligible RR rate. Under this condition the recombination rate measured at the reference point monitors the background signal. Choosing short time intervals of 10 ms duration for dwelling on the measurement, cooling and reference voltages ensured that the experimental environment did not change significantly in between signal and background measurement. An additional interval of 1.5 ms after each change of the cooler voltage allowed the power supplies to reach the preset values before data taking was started.
At the rather low ion energy of 420 keV/u the cross section for electron capture from residual gas molecules is estimated — taking the measured residual gas composition into account and using a semi-empirical formula Schlachter1983 for the charge capture cross section — to be as large as cm2. Electron capture from residual gas molecules is therefore expected to contribute significantly to the measured recombination signal as a background even at the TSR residual gas pressure of only mbar. This already proved to be all the more the case in a previous TSR experiment with Sc3+ ions Schippers1999a where due to a technical defect in one of the TSR dipole power supplies a reduced maximum rigidity of only Tm had been available. Consequently, the ion energy had been limited to 300 keV/u. Because of the rapid increase of with decreasing ion energy and because the experiment had been carried out in early summer, i. e., close to a maximum in the slight seasonal variation of the TSR residual gas pressure, the measured signal to background ratio had been of the order of 1/100. Under these conditions the Sc3+ recombination rate coefficient could only be measured over a limited energy range with large statistical uncertainties. In the present measurements, that were carried out in December 2000, the signal to background ratio was a factor of about 10 higher as compared to the previous experiment.
The electron-ion recombination coefficient is obtained as the background-subtracted recombination count rate normalized to the electron current and to the number of stored ions Kilgus1992 . The estimated systematical uncertainties are 15% for the absolute value of the measured rate coefficient and less than 2% for the relative energy in the energy range under study.
III Theory
III.1 Nonperturbative approach of continuum-bound transitions
Starting from the rigorous continuum-bound transition theory, Davies and Seaton Davies1969 discussed the process of emission of radiation into the optical continuum due to radiative capture of an electron by an ion and derived a general formalism including radiation damping. The details of their formalism and our numerical scheme for application can be found in Ref. Davies1969 and Ref. Zhao2000 , respectively. Nevertheless, a brief review of the formalism and our method follows.
Using the close-coupling R-matrix approach (see Zhao2000 for details) we start from a treatment of the electron-ion collision process that neglects any interaction with the radiation field. The resulting wave functions are used as a basis for setting up equations including the interaction with the radiation field in the approximation that only the electric-dipole terms are retained and that the radiation field is restricted to one-photon and no-photon states. The exact solutions for the probability amplitudes of the time-dependent matrix equations involved can be obtained by the application of a Laplace transform. They are expressed in terms of a scattering matrix with the partitioning
| (6) |
with representing the submatrix for electron-electron scattering allowing for radiative decays, that for photoionization, that for electron capture with the emission of a photon, and that for photon-photon scattering. and are written as
| (7) | |||||
| (8) |
respectively, where is the usual electron-electron scattering matrix in the absence of interaction with radiation fields, and is the reduced dipole matrix ( denotes its hermitian conjugate) with its matrix element in the form
| (9) |
where is the fine-structure constant, is the photon energy in units of hartrees, and is the dipole operator with the summation extending over all atomic electrons. The quantum numbers and , respectively, specify the continuum and bound states of the atomic system, and are the total angular momenta. The wave function of the continuum electron is normalized per unit hartree. In Eqs. 7 and 8 the matrix
| (10) |
is related to radiation damping. The variable denotes the total energy of the ion+photon system. In the usual first-order theory damping is neglected and . For the calculation of the PR cross section with damping we employ the numerical method developed by Zhao et al. Zhao2000 for the evaluation of the principal value of the integral appearing in Eq. 10.
In the present calculation the parameters for the 1s, 2s, 2p, 3s, 3p orbitals of scandium were taken from the compilation of Clementi and Roetti Clementi1974 , and the 3d orbital was optimized on the 3p53d 1,3Po, 1,3Do, 1,3Fo states (weighted) by using the CIV3 code of Hibbert Hibbert1975 . We also evaluate PR cross sections for further target states including 4s, 4p, 4d orbitals. All these orbitals were optimized in a way similar to the 3d orbital. The symmetries with were included in our calculations. Here, S and L are the total spin and orbital angular momentum quantum numbers, respectively, and denotes the parity. In our calculation we included configurations of odd parity only, since these are expected to lead to the dominant resonances in the energy region of our primary interest around the 3p53d2(3F) 2F resonance.
III.2 Perturbation theory
On the basis of the principle of detailed balance, the photorecombination (PR) cross sections (in atomic units) from an initial continuum state to a final bound state may be written in the form Sobelman
| (11) |
where and are the statistical weights of the initial ion core and the final recombined ion, and are the photon energy and the free electron energy in hartrees, and denotes the photoionization (PI) cross section from state to state . In first order perturbation treatment it is
| (12) |
where is the PI matrix element of the corresponding transition with the continuum state being normalized per unit energy (hartree). According to continuum-bound configuration-interaction theory Fano1961 , the perturbative PI matrix element in low orders may be written in the form (see also Gorczyca1997 ; Mitnik1999 ),
| (13) | |||||
where is the summation of radiative and autoionization widths of the resonance state , is the autoionization width from state to state , , in which is the energy level of resonance , is the electron-electron interaction. It should be noted that in the usual independent-processes and isolated-resonance approximations all cross terms in are omitted that lead to interference between resonant and non-resonant recombination channels as well as to the interaction between resonances. In the present investigation these cross terms are taken into account where necessary.
IV Results and Discussion
IV.1 Experimental results
| Configuration | Term | Energy (eV) | |
|---|---|---|---|
| 3s23p53d | 3P | 0 | |
| 1 | |||
| 2 | |||
| 3s23p53d | 3F | 4 | |
| 3 | |||
| 2 | |||
| 3s23p53d | 1D | 2 | |
| 3s23p53d | 3D | 3 | |
| 1 | |||
| 2 | |||
| 3s23p53d | 1F | 3 | |
| 3s23p54s | 3P | 2 | |
| 1 | |||
| 0 | |||
| 3s23p54s | 1P | 1 | |
| 3s23p53d | 1P | 1 |
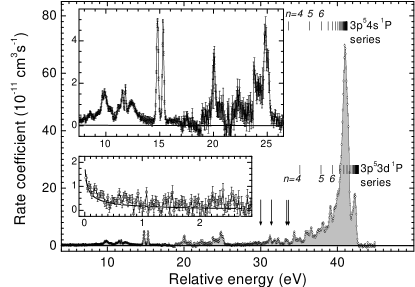
Fig. 1 shows the measured Sc3+(3s23pS) recombination rate coefficient. The most prominent feature is the peaklike structure around eV. It can be attributed to mainly unresolved high Rydberg DR resonances attached to 3p53dP and 3p54sP core excitations. Vertical lines indicate DR resonance positions as calculated with the Rydberg formula with eV, , and the series limits taken from Tab. 1. It should be noted that we do not observe Rydberg resonances to arbitrary high , since recombined Sc2+(3p6 ) ions in weakly bound high states are field-ionized by motional electric fields in the charge-analyzing dipole magnet and therefore do not reach the recombination detector. Applying a detailed model of the field-ionizing properties of our apparatus that takes into account the radiative decay of high Rydberg states on their way from the electron cooler to the charge-analyzing magnet as well as state-selective field-ionization probabilities Schippers2001c we estimate the highest detected Rydberg state to be approximately .
In principle, Rydberg series attached to further 3p53d core excitations (Tab. 1) could have been expected to be visible. The respective core-excitation energies are marked by vertical arrows in Fig. 1. However, no strong DR resonances belonging to such series are observed. Apparently, only dipole allowed (under -coupling conditions) 1S 1P core excitations give rise to strong DR channels. This has already been observed for iso-electronic Ti4+ ions Schippers1998 where DR proceeds almost exclusively via resonances attached to 3p53dP excitations. In contrast to the present finding for Sc3+, in the DR spectrum of Ti4+ no DR resonances due to 3p4s excitations were found. One strong hint to the origin of this difference is the fact that in Sc3+ the 3p 4s excitation energies are about 1 eV lower than the 3p53dP excitation energy (Tab. 1), while in Ti4+ they are higher by up to 6 eV. Although being iso-electronic Sc3+ and Ti4+ do have a markedly different structure.
The recombination rate coefficient rises sharply towards zero relative energy (lower inset of Fig. 1). This rise is due to RR. The RR rate coefficient is rather small as can be expected from the fact that RR into the K, L, M1 and M2,3 shells of argonlike Sc3+ is not possible. This is in contrast to e. g. bare Li3+ ions where these channels yield the major contribution (43% at eV) to the total hydrogenic RR cross section Burgess1964b summed up to . The hydrogenic total Sc3+ rate coefficient, i. e. the sum of the -differential Li3+ RR cross sections ranging from the 3d-subshell to the experimental cutoff quantum number convoluted with the experimental electron-energy distribution (see e. g. Ref. Schippers2001c ), is plotted as the full line in the lower inset of Fig. 1. It agrees with the experimental curve within the experimental uncertainties. In spite of the long measuring time of 60 hours, in particular in the energy range of 8–17 eV, the statistical uncertainty did not become low enough to bring out all structures. At the present level of statistical uncertainty it cannot be decided whether the faint structures in the energy range 1–7.5 eV are due to weak DR resonances or due to unaccounted background modulations.
The DR resonances visible in the upper inset of Fig. 1 are due to 3p53d2 and 3p53d 4 doubly excited configurations. These configurations are considerably shifted down in energy as compared to the Rydberg energies shown by vertical lines in Fig. 1 and the energies of the various terms must be taken from detailed calculations. As already mentioned in the introduction the terms belonging to the 3p53d2 configuration straddle an energy range of about 20 eV. Also the 3p53d 4 configurations can be expected to be subject to strong fine structure interactions and hence to be spread out over several electron volts. The energy range between about 8 and 26 eV (upper inset in Fig. 1) was searched preferentially in order to detect the broad 3p53d2 2F Super-Coster-Kronig resonance predicted by theory. The measurement reproduces the strong double peak structure near 15 eV found already in the previous experiment Schippers1999a (scan range 12–18 eV) but now also reveals considerable additional structure both above and below these peaks. While much of this structure seems to arise from a superposition of several narrow peaks, a single broad resonance (with some narrower structure superimposed on its low energy slope) seems to dominate the recombination rate near 12.3 eV. This signal bears strong similarity with the predicted 3p53d2 2F Super-Coster-Kronig resonance Gorczyca1997 and we take this feature as a key to assigning a considerable part of the observed spectrum. This interpretation is also supported by the argument that for the isoelectronic system Ti4+ Schippers1998 the 3p53d2 2F resonance was observed about 3 eV below the prediction obtained by the same theoretical approach Gorczyca1998a , so here a position of eV can be expected.
| (eV) | (eV) | (10-12cm3s-1eV) | |||
|---|---|---|---|---|---|
| 11.175 | 0.041 | 0.317 | 0.099 | ± | 1.8 |
| 11.481 | 0.143 | 0.140 | 0.253 | ± | 6.1 |
| 11.587 | 0.036 | 0.000 | 0.193 | ± | 3.8 |
| 11.819 | 0.004 | 0.000 | 0.021 | ± | 0.4 |
| 12.305 | 0.027 | 0.889 | 0.066 | ± | 1.0 111Fano profile (Eq. 15) with . |
| 14.802 | 0.001 | 0.056 | 0.006 | ± | 0.2 |
| 15.324 | 0.001 | 0.018 | 0.006 | ± | 0.2 |
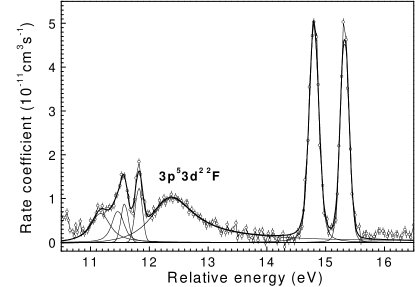
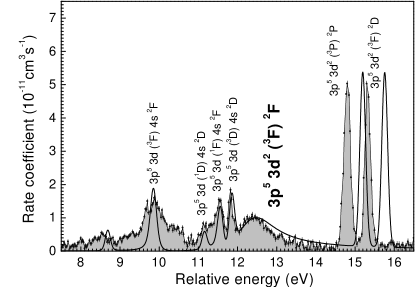
A closeup of the experimental spectrum is shown in Fig. 2, where the resonances in the energy range 10.9–16.5 eV have been fitted by either Lorentzian line profiles
| (14) |
or an asymmetric Fano profile
| (15) |
with . The term -1 in the square brackets ensures that for and the normalization factors have been chosen such that in the limit . Conversely, small absolute values of the asymmetry parameter lead to significantly asymmetric line shapes. Assuming that the dominant contribution to the resonance width stems from autoionization and neglecting contributions from neighboring resonances, can be expressed in terms of the matrix elements occurring in Eq. 13, i. e.,
| (16) |
as can be shown by simple algebraic manipulations on . For each resonance the parameters varied in the fit were the peak area , the resonance energy , the resonance width , and in case of the 3p53dF resonance the asymmetry parameter . In the fit both and have been convoluted (see appendix) by a Gaussian representing the experimental energy-distribution function with its full width at half maximum (FWHM) in the energy region of interest Kilgus1992 . The longitudinal electron-beam temperature ( denotes the Boltzmann constant) has also been allowed to vary during the fit. From the fit we obtain meV. Further fit results are summarized in Tab. 2.
The most important result of the fit is the determination of the 3p53dF resonance energy and width to eV ( systematic uncertainty) and eV, respectively. For the asymmetry parameter of this resonance we obtain . A major source of uncertainty beyond the errors given is the background from collisions with residual gas molecules. Under the conditions of the present experiment the background causes the major fraction of the measured recombination count rate (see Sec. II). A subtraction of this high background level from the measured signal is difficult, especially, if changes of the residual gas pressure have occurred on the time scale of the switching between signal and background measurement. In this case a small fraction of the background may not have been properly subtracted possibly leading, e. g., to the nonzero recombination signal in the energy range 15.6–17 eV. In principle, this signal might also be caused by a group of weak DR-resonances, however, this assumption is not supported by our theoretical calculations (see below). When allowing a constant background level as an additional free parameter in the fit a considerably different asymmetry parameter is obtained with the fitted background level amounting to cm3s-1. On the other hand the resonance position and width change only within their errors as listed in Tab. 2 to eV and , respectively.
The significance of our fit result for the asymmetry parameter may also be assessed by fitting the 3p53dF resonance with a symmetric Lorentzian instead of an asymmetric Fano line shape. From such a Lorentzian fit we obtain a value that is higher by only 5% as compared to the Fano fit, i. e., the experimental evidence for an asymmetric line shape is not very strong.
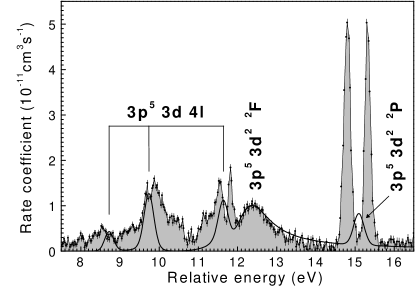
Fig. 3 shows the comparison of the present experimental result with the theoretical result of Gorczyca et al. Gorczyca1997 in the region of the 3p53dF resonance. As already inferred from our previous work Schippers1999a the theoretical resonance positions do not match the experimental ones. For the comparison presented in Fig. 3 the theoretical energy scale has been shifted by 2.2 eV in order to match the experimental position of the broad 3p53dF resonance. Moreover, the absolute theoretical rate coefficient has been normalized to the experimental height of this resonance by a multiplication factor of 0.63. After these adjustments a basic similarity between predicted and measured spectrum is found. In particular, a broad feature is observed strongly resembling the calculated 3p53d2 2F resonance. However, in the experimental spectrum considerably more resonances are visible than in the theoretical one. The theoretically predicted single peaks at 11.6 and 15.1 eV appear to be split into two components. Also, the predicted relative resonance strengths deviate from the experimental findings. The theoretical 3p53dP peak at 15.1 eV is much smaller than the experimental doublet.
IV.2 Theoretical results
| State | Exp. | Theory222A: this work, B: Ref. Gorczyca1997 , C: Ref. Tiwary1983 , D: Ref. Altun1999 | |||
|---|---|---|---|---|---|
| A | B | C | D | ||
| 3p53d(3F)4s 2F 3331s22s22p63s2 is omitted. | 11.00 | 11.59 | |||
| 3p53d(1D)4s 2D | 12.18 | ||||
| 3p53d(1F)4s 2F | 12.71 | 12.77 | |||
| 3p53d(3D)4s 2D | 12.89 | ||||
| 3p53d2(3F) 2F | 13.61 | 14.62 | 13.23 | 15.74 | |
| 3p53d2(3P) 2P | 16.40 | 17.35 | 15.85 | 16.81 | |
| 33d2(3F) 2D | 16.90 | ||||
The result of our LS-coupling–R-Matrix calculation of the total Sc3+ PR cross section including damping is plotted in Fig. 4a. It can be noticed that there is a very wide resonance at about 13.6 eV. As already predicted by Gorczyca et al. Gorczyca1997 , it is due to DR via the 3p53d2(3F) 2F state. However, our resonance energy is by about 1 eV closer to the experimental value of 12.29 eV (see Tab. 2) than that of Gorczyca et al. This difference originates from the use of different sets of basis functions in both calculations. Table 3 lists measured and theoretical resonance energies including further theoretical results Tiwary1983 ; Altun1999 . The relatively large differences between the various theoretical results illustrates again the difficulty to exactly describe the many-electron atomic system under consideration.
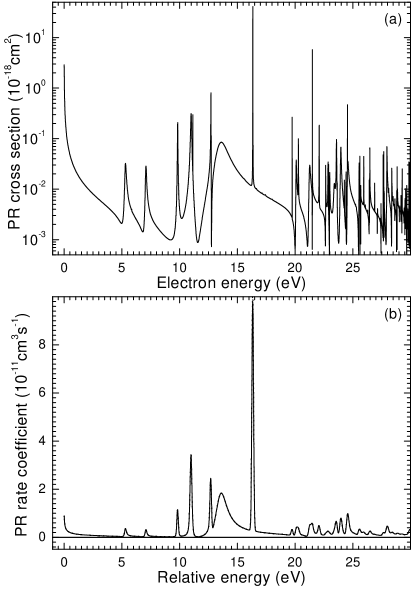
In order to be able to more accurately compare the theoretical result with the measured merged-beams rate coefficient we convoluted the R-matrix cross section with the experimental electron energy distribution function, that can be parameterized by the longitudinal and transverse (with respect to the electron beam direction) electron beam temperatures and , respectively Kilgus1992 . For the convolution result displayed in Fig. 4b we have used meV (cf., Fig. 2) and meV. Comparing with the experimental data in Fig. 1 we find that the R-matrix calculation does not reproduce the experiment in every detail. For example, the calculated resonance peaks in the energy range 7–17 eV are too high, whereas those beyond 19 eV are too low. Moreover, some of the observed peaks at lower energies are not reproduced by the R-matrix calculation. The disagreement at high energies can be traced back to the neglect of even-parity configurations and to the neglect of relativistic effects by restricting the R-Matrix calculation to -coupling. This also explains the missing of peaks at lower energies. Using Cowan’s code Cowan1981 for the calculation of DR resonances in the framework of perturbation theory (Sec. III.2) we find that due to relativistic effects (mainly spin-orbit interaction) also -forbidden excitations to 3p53d2(3F) 2D as well as to 3p53d(1D)4s 2D and 3p53d(3D)4s 2D doubly excited states may contribute to the PR cross section. It should be emphasized that resonances arising from relativistic effects have in general small Auger widths if the atomic number is not large. As has been explained in some detail by Zhao and Shirai Zhao2001 they, nevertheless, may still play an important role in recombination if their radiative lifetime is of the order of the radiative lifetimes of the dominant DR resonances.
As shown in Fig. 5, a much better agreement with the experimental data is achieved when the the 2D resonances mediated by spin-orbit effects are taken into account in addition to the R-Matrix cross section. For the generation of the incoherent sum of the R-Matrix + perturbation-theory rate coefficient shown in Fig. 5 we have used the 2D Auger and radiative rates as calculated by Cowan’s code. The resonance energy, however, has been determined by using the experimentally observed energy splittings between the 2D resonances and neighboring resonances obtained from R-Matrix theory. For example, the experiment yields 3p53d2(3P) 2P and 3p53d2(3F) 2D resonance energies of 14.8 and 15.3 eV, respectively (Tab. 2). The level difference equals 0.5 eV. Since our R-matrix calculation yields a 3p53d2(3P) 2P resonance energy of 16.4 eV, we chose 16.9 eV to be the 3p53d2(3F) 2D resonance energy. Moreover, for the comparison in Fig. 5 the theoretical merged-beams rate coefficient was multiplied by a factor 0.55 and shifted by 1.13 eV to lower energies. The difference between experimental and theoretical cross sections of nearly a factor 2 is found to be independent of the inclusion of 4s, 4p and 4d orbitals in the set of target states.
IV.3 Line shape of the 3p53d2(3F) 2F resonance
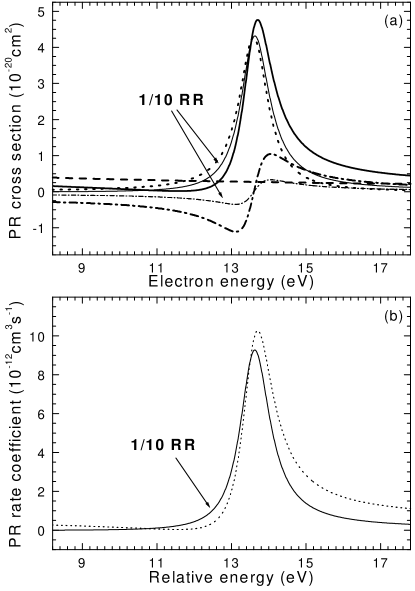
Clearly, the theoretical line shape of the broad 3p53d2(3F) 2F resonance is asymmetric. As already mentioned in the introduction, Gorczyca et al. Gorczyca1997 have attributed this asymmetry to interference between RR and DR pathways. However, this interpretation may be doubted in view of the fact that in the relevant energy range the RR cross section is orders of magnitude smaller than the DR cross section. Naively, one would expect that a significant interference between DR and RR requires cross sections of similar magnitude. It must be kept in mind, however, that the asymmetry parameter is also governed by the natural line width . Inspection of Eq. 16 shows that a large value of can make up for a small RR transition matrix element . Fig. 6a shows the RR, DR and interference contributions to the recombination cross section in the energy region of the 3p53d2(3F) 2F resonance as calculated by perturbation theory. With the width of the 3p53d2(3F) 2F resonance due to its Super-Coster-Kronig decay channel being extraordinarily large ( eV obtained from Cowan’s atomic-structure code Cowan1981 ) the asymmetry in the merged-beams rate coefficient is retained even when the RR cross section is artificially lowered by a factor of 10 (Fig. 6b). The theoretical asymmetry parameter changes from to . Our experimental findings of eV and of (see Tab. 2) correspond to these theoretical results.
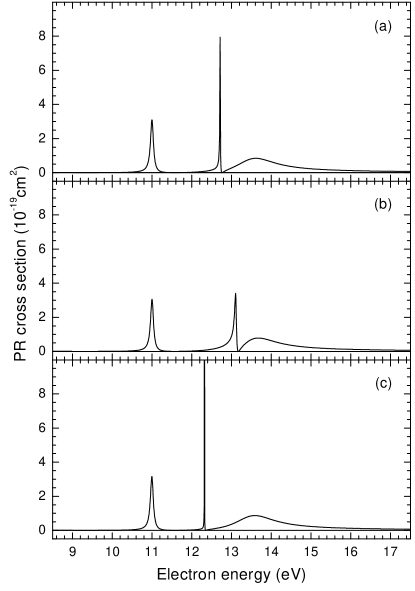
Apart from interference between DR and RR another source of distorted line shapes is the interaction between overlapping DR resonances of the same symmetry Griffin1994 . From our R-Matrix calculation we find two further resonances of 2F symmetry, namely the resonances 3p53d(3F)4s 2F and 3p53d(1F)4s 2F located at 11.00 and 12.71 eV, respectively. As shown in Fig. 7a, especially the latter is overlapping with the broad 3p53d2(3F) 2F resonance. In Figs. 7b and 7c we show how the line shape of the 3p53d2(3F) 2F resonance depends on its (artificially varied) distance to the 3p53d(1F)4s 2F resonance. Clearly the shapes of both resonances are affected by their mutual separation. The experimental observation of this effect, however, is hindered by the presence of the 2D resonances close to the 3p53d(1F)4s 2F resonance. Under this circumstance the experimental resolution does presently not suffice to reveal the theoretically predicted subtle resonance-resonance interference.
V Conclusions
In the experimental energy range 0-45 eV photorecombination of Sc3+(3s23p6) ions is dominated by the 3p53d 1P and 3p54s 1P Rydberg series of DR resonances. Significant differences to the recombination of isoelectronic Ti4+ ions Schippers1998 are found that are due to subtle differences in the electronic structure of Sc3+ and Ti4+. Level energies, widths and resonance strengths were determined for a number of doubly excited Sc2+(3s23p53d2) and Sc2+(3s23p53d 4s) states. Furthermore, we find a small experimental evidence for an asymmetry of the 3p53d2(3F) 2F resonance line shape. A more precise determination of the line shape from the experimental data would require less statistical uncertainties especially in the high energy tail of the resonance. In the present measurement the high background level from electron capture in Sc3+ collisions with residual gas molecules prevented this requirement from being fulfilled. Moreover, the peaks on the low energy side of the 3p53dF resonance leave additional room for ambiguity.
Starting from rigorous continuum-bound transition theory the Sc3+ photorecombination cross section has been calculated using both the R-matrix method and a perturbative treatment. We found that the line shape of the 3p53d2(3F) 2F resonance is influenced by both interacting resonances and interference between RR and DR. In spite of the fact that the Sc3+ RR cross section is almost negligibly small, DR-RR interference becomes noticeable due to the large 3p53d2(3F) 2F resonance width of 0.89 eV. Moreover, we have shown that relativistic effects play an important role in the recombination of Sc3+. Three experimentally observed strong 3p53d2 2D and 3p53d4s 2D resonances can only be reproduced theoretically by invoking relativistic effects. Our R-matrix calculations as well as the calculations of Gorczyca et al. Gorczyca1997 that both have been restricted to LS-coupling fail in reproducing these strong experimental peaks.
Our results show the limits of the independent-processes and isolated-resonances approximations usually made in photorecombination calculations. A more stringent test of our theoretical results could in principle be provided by the measurement of high-resolution photoionization cross sections of Sc2+(3p63dD) ions. Results of such an experiment will be reported elsewhere Schippers2002 .
Acknowledgements.
Technical support by the Heidelberg accelerator and TSR groups is gratefully acknowledged. The experimental work has been supported by the Deutsche Forschungsgemeinschaft (DFG, grant no. Mu 1068/8). A.C and M.E.B were supported by a NATO collaborative grant (no. PST/CLG 976362) and L.B.Z was supported by the National Natural Science Foundation through grant no. 19974006.Appendix A Convolution of a Fano-profile with a Gaussian
The convolution of a Fano profile (Eq. 15) with a normalized Gaussian
| (17) |
with being its full width at half maximum (FWHM), yields
where the definitions
| (19) | |||||
| (20) | |||||
| (21) | |||||
| (22) |
have been used and where denotes the complex error function Abramowitz1964 . Its real and imaginary parts can efficiently be calculated with a numerical algorithm by Humlicek Humlicek1979 . It should be noted that for Eq. A yields the Voigt profile, i. e. the convolution of a Lorentzian (Eq. 14) with a Gaussian.
References
- (1) G. Alber, J. Cooper, and A. R. P. Rau, Phys. Rev. A 30, 2845 (1984).
- (2) N. R. Badnell and M. S. Pindzola, Phys. Rev. A 45, 2820 (1992).
- (3) M. Zimmermann, N. Grün, and W. Scheid, J. Phys. B 30, 5259 (1997).
- (4) E. Behar, V. L. Jacobs, J. Oreg, A. Bar-Shalom, and S. L. Haan, Phys. Rev. A 62, 030501 (2000).
- (5) D. A. Knapp, P. Beiersdorfer, M. H. Chen, J. H. Scofield, and D. Schneider, Phys. Rev. Lett. 74, 54 (1995).
- (6) T. W. Gorczyca, M. S. Pindzola, F. Robicheaux, and N. R. Badnell, Phys. Rev. A 56, 4742 (1997).
- (7) S. Schippers, T. Bartsch, C. Brandau, A. Müller, J. Linkemann, A. A. Saghiri, and A. Wolf, Phys. Rev. A 59, 3092 (1999).
- (8) R. D. Cowan, The Theory of Atomic Structure and Spectra (University of California Press, Berkeley, 1981).
- (9) J. E. Hansen and P. Quinet, J. Elec. Spectros. Rel. Phenom. 79, 307 (1996).
- (10) A. Müller, S. Schippers, A. M. Covington, A. Aguilar, G. Hinojosa, R. A. Phaneuf, M. M. Sant Anna, A. S. Schlachter, J. D. Bozek, and C. Cisneros, in XXII International Conference on Photonic, Electronic, and Atomic Collisions, Santa Fe, New Mexico, USA, July 18-24, 2001, Abstracts of Contributed Papers, edited by S. Datz, M. E. Bannister, H. F. Krause, L. H. Saddiq, D. Schultz, and C. R. Vane (Rinton Press, Princeton, New Jersey, 2001), p. 52.
- (11) L. B. Zhao, A. Ichihara, and T. Shirai, Phys. Rev. A 62, 022706 (2000).
- (12) G. Kilgus, D. Habs, D. Schwalm, A. Wolf, N. R. Badnell, and A. Müller, Phys. Rev. A 46, 5730 (1992).
- (13) A. Lampert, A. Wolf, D. Habs, J. Kenntner, G. Kilgus, D. Schwalm, M. S. Pindzola, and N. R. Badnell, Phys. Rev. A 53, 1413 (1996).
- (14) S. Schippers, T. Bartsch, C. Brandau, A. Müller, G. Gwinner, G. Wissler, M. Beutelspacher, M. Grieser, A. Wolf, and R. A. Phaneuf, Phys. Rev. A 62, 022708 (2000).
- (15) S. Schippers, A. Müller, G. Gwinner, J. Linkemann, A. A. Saghiri, and A. Wolf, Astrophys. J. 555, 1027 (2001).
- (16) M. Grieser, M. Blum, D. Habs, R. V. Hahn, B. Hochadel, E. Jaeschke, C. M. Kleffner, M. Stampfer, M. Steck, and A. Noda, in Proceedings of the 19th International Symposium on Cooler Rings and Their Applications, Tokyo, Japan, November 5 – 8, 1990, edited by T. Katayama and A. Noda (World Scientific, Singapore, 1991), pp. 190–198.
- (17) B. Hochadel, F. Albrecht, M. Grieser, D. Habs, D. Schwalm, E. Szmola, and A. Wolf, Nucl. Instrum. Methods A 343, 401 (1994).
- (18) K. Rinn, A. Müller, H. Eichenauer, and E. Salzborn, Rev. Sci. Instrum. 53, 829 (1982).
- (19) A. S. Schlachter, J. W. Stearns, W. G. Graham, K. H. Berkner, R. V. Pyle, and J. A. Tanis, Phys. Rev. A 27, 3372 (1983).
- (20) P. C. W. Davies and M. J. Seaton, J. Phys. B 2, 757 (1969).
- (21) E. Clementi and C. Roetii, At. Data Nuc. Data Tab. 14, 177 (1974).
- (22) A. Hibbert, Comput. Phys. Commun. 9, 141 (1975).
- (23) I. Sobleman, Atomic Spectra and Radiative Transitions (Springer, Berlin, 1992).
- (24) U. Fano, Phys. Rev. 124, 1866 (1961).
- (25) D. M. Mitnik, M. S. Pindzola, and N. R. Badnell, Phys. Rev. A 59, 3592 (1999).
- (26) S. Schippers, T. Bartsch, C. Brandau, G. Gwinner, J. Linkemann, A. Müller, A. A. Saghiri, and A. Wolf, J. Phys. B 31, 4873 (1998).
- (27) A. Burgess, Mem. Roy. Astron. Soc. 69, 1 (1964).
- (28) T. W. Gorczyca, private communication.
- (29) S. N. Tiwary, A. E. Kingston, and A. Hibbert, J. Phys. B 16, 2457 (1983).
- (30) Z. Altun and T. Manson, J. Phys. B 32, L255 (1999).
- (31) L. B. Zhao and T. Shirai, Phys. Rev. A 63, 010703(R) (2001).
- (32) D. C. Griffin, M. S. Pindzola, F. Robicheaux, T. W. Gorczyca, and N. R. Badnell, Phys. Rev. Lett. 72, 3491 (1994).
- (33) S. Schippers, A. Müller, S. Ricz, M. E. Bannister, G. H. Dunn, J. Bozek, A. S. Schlachter, G. Hinojosa, C. Cisneros, A. Aguilar, A. Covington, M. Gharaibeh, and R. A. Phaneuf, to be published.
- (34) M. Abramowitz and I. A. Stegun, Handbook of Mathematical Functions (Dover Publications, New York, 1964), chapter 7.
- (35) J. Humlicek, J. Quant. Spectrosc. Radiat. Transfer 21, 309 (1979).
- (36) W. C. Martin, J. Sugar, A. Musgrove, W. L. Wiese, J. R. Fuhr, D. E. Kelleher, K. Olsen, P. J. Mohr, G. Dalton, M. Douma, R. Dragoset, S. Kotochigova, L. Podobedova, E. Saloman, C. Sansonetti, and G. Wiersma, NIST Atomic Spectra Data Base, 2. ed., National Institute of Standards and Technology, Gaithersburg, Maryland 20899-3460, USA, 1999, http:physics.nist.govcgi-binAtDatamainasd.