Voltage-controlled wavelength conversion by terahertz electro-optic modulation in double quantum wells
Abstract
An undoped double quantum well (DQW) was driven with a terahertz (THz) electric field of frequency polarized in the growth direction, while simultaneously illuminated with a near-infrared (NIR) laser at frequency . The intensity of NIR upconverted sidebands was maximized when a dc voltage applied in the growth direction tuned the excitonic states into resonance with both the THz and NIR fields. There was no detectable upconversion far from resonance. The results demonstrate the possibility of using gated DQW devices for all-optical wavelength shifting between optical communication channels separated by up to a few THz.
pacs:
42.65.Ky,85.60.-q,73.21.FgA basic function in a wavelength division multiplexed (WDM) optical communications network is to switch data between different wavelength channels. All-optical switching in a WDM network requires the ability to shift the frequency of a near-infrared (NIR) carrier of a NIR carrier by several terahertz (THz)[1]. This has been accomplished by four-wave mixing of NIR beams in semiconductor optical amplifiers[2], and three-wave mixing in quasi-phase-matched AlGaAs waveguides[3].
Generation of THz optical sidebands on a NIR carrier beam has recently been studied in various semiconductor systems[4, 5, 6]. Great flexibility for practical optoelectronic devices that operate at THz frequencies lie with gated double quantum well (DQW) structures, in which two quantum wells (QW) are separated by a thin tunnel barrier. Their intersubband spacings can be engineered to lie in the THz frequency range by adjusting the width of the tunnel barrier. Meanwhile, the optical bandgap can be separately tuned by the width of the individual wells. Large optical nonlinearities can be built into the DQW[7] by using an asymmetric DQW in which carriers feel a non-centrosymmetric confinement potential. Finally, the intersubband spacing can be tuned by applying a DC voltage to the gates.
This paper describes experiments in which a near-infrared (NIR) probe laser beam is modulated at THz frequencies in a gated, asymmetric DQW. The THz field couples to an excitonic intersubband excitation while the NIR field couples to an excitonic interband excitation. Applying a DC voltage to the gates can bring the intersubband transition into resonance with the THz field, and the interband transition into resonance with the NIR field. When these resonance conditions are met the NIR probe is modulated resulting in the emission of optical sidebands which appear at frequencies
| (1) |
where () is the frequency of the NIR (THz) beam and .
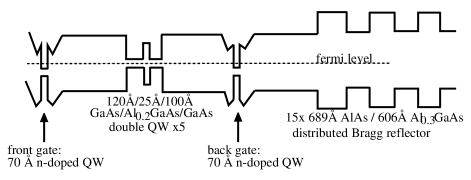
The sample consisted of an active region containing the DQWs, a distributed Bragg reflector (DBR), and two gates, each consisting of a narrow n-doped quantum-well. The band diagram of the sample is shown in Fig. 1.
The active region consisted 5 periods of DQW, each consisting of a 120 Å GaAs QW and a 100 Å GaAs QW separated by a 25 Å Al0.2Ga0.8As tunnel barrier. Each period is separated by a 300 Å Al0.3Ga0.7As barrier. The active region is thin compared to a NIR wavelength. A thicker active region generates stronger sidebands, but is more difficult to model due to reabsorption, phase-matching, and screening effects.
The dimensions of the DQW were designed so that the two lowest-lying electron subbands were separated by meV ( THz) at flat-band. This is around the center of the range of high-quality operating frequencies of our THz source, the UCSB Free Electron Laser (FEL). Within the 10 meV energy splitting constraint, the degree of asymmetry was designed to peak the strength of the sideband near flat-band conditions.
The DBR consisted of 15 periods of 689 Å AlAs and 606 Å Al0.3Ga0.7As. It had a low-temperature passband nearly centered on the low-temperature bandgap of the DQW, making it about 95% reflective for the NIR probe beam and sidebands.
The active region was sandwiched between the two gates, each consisting of a Si delta-doped 70 Å QW with carrier density cm-2. The gates are separated from the active region by 3000 Å Al0.3Ga0.7As barriers. Since the gate QWs are much narrower than the active DQWs, the gate QWs are transparent to both the THz and NIR beams. A mesa was etched and NiGeAu ohmic contacts annealed to the gate QWs.
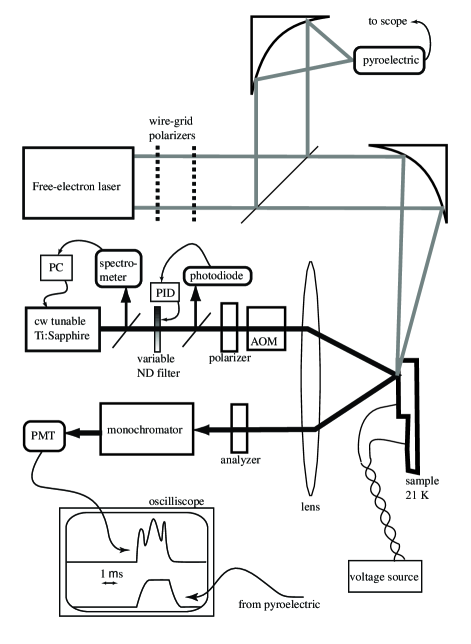
The experimental setup is illustrated in Fig. 2. The sample was cooled to 21 K in a closed-cycle He crystat. The THz beam from the FEL is polarized in the growth direction, propagated in the QW plane and focused by a 90o off-axis parabolic mirror (F/1) onto the cleaved edge of the sample.
NIR light from a continuous-wave Ti:sapphire laser is chopped by an acousto-optic modulator into s pulses which overlap the s FEL pulses. The vertically-polarized NIR beam propagates normal to the THz beam, and was focused (F/10) at a power density of 50 W/cm2 to the same small interaction volume in the sample. The reflected beam, sidebands, and photoluminescence (PL) are analyzed by a second polarizer, dispersed by a 0.85 m Raman double-monochromator, and detected by a photomultiplier tube (PMT).
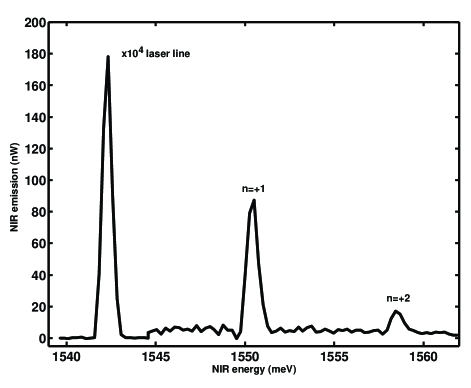
A typical sideband spectrum is shown in Fig. 3. The conversion efficiency scale was calibrated by attenuating the NIR laser to match the peak sideband signal, and factoring the loss through the collection and dispersion optics. We present results for the sidebands as a continuous function of gate bias () and NIR laser frequency () at various THz laser frequencies ().
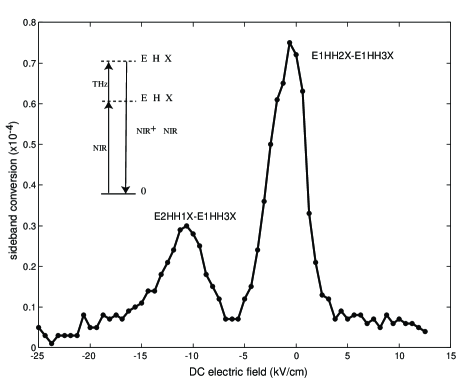
A sideband voltage scan with meV and THz is shown in Fig. 4. In this scan, is scanned while all other parameters are kept constant so that . Note that at dc electric fields far from resonance there are no detectable sidebands. This type of scan demonstrates the voltage tunability of the THz-NIR modulation.
The distinct peaks are labelled with excitonic transition assignments derived from a nonlinear susceptibility calculation for THz-NIR mixing due to excitons[8, 9]. The label refers to the exciton consisting of an electron in subband and a heavy hole in subband . A double-resonance condition holds when the NIR field is resonant with an exciton and the THz field resonantly couples two excitons.
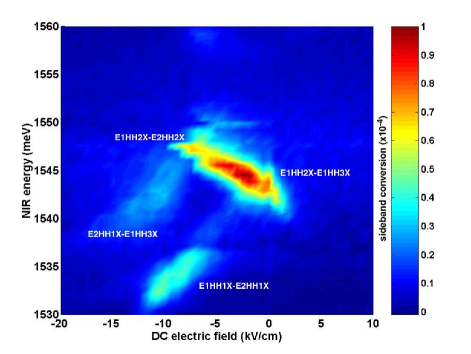
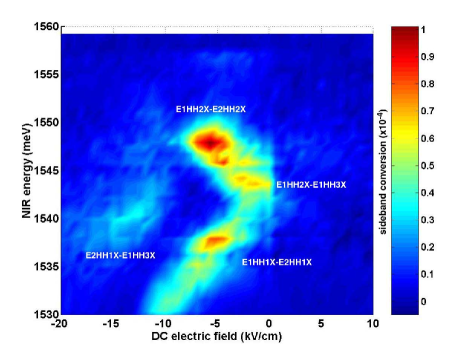
To understand the full resonant structure of the sideband generation process at each THz frequency, the sideband was measured as a continuous function of both and . By taking a sideband voltage scan at each we measured the sideband maps shown in Figs. 5 and 6 at 2.0 THz and 2.5 THz (8.2 meV and 10.4 meV). Again, peaks in the sideband emission occur when the NIR field is resonant with an exciton and the THz field resonantly couples two excitons; they are labelled with excitonic transition assignments.
In summary, we have modulated a NIR laser beam at THz frequencies by driving the excitonic intersubband transition of an asymmetric DQW. A pair of n-doped QW gates which are transparent to both the NIR and THz fields allow the resonant response of the device to be tuned by applying a dc voltage, allowing the device to act as a voltage-controllable wavelength converter. The peak conversion response occurs when the NIR field is resonant with an exciton and the THz field resonantly couples two excitons.
We gratefully thank Christoph Kadow and Art Gossard for their input. This research was funded by NSF-DMR 0070083.
REFERENCES
- [1] B. Mukherjee. Optical Communication Networks. McGraw-Hill, N.Y., 1997.
- [2] J. Zhou, N. Park, J .W. Dawson, K. J. Valhala, M. A. Newkirk, B. I. Miller. IEEE Phot. Tech. Lett., 6(1):50, 1994.
- [3] S. J. B. Yoo, G. K. Chang, X. Wei, M. A. Koza, C. Caneau, R. Bhat. OFC Proc., 4:36, 1999.
- [4] J. Cerne, J. Kono, T. Inoshita, M. Sherwin, M. Sundaram, A.C. Gossard. App. Phys. Lett., 70(26):3543, 1997.
- [5] J. Kono, M.Y. Su, T. Inoshita, T. Noda, M.S. Sherwin, S.J. Allen, H. Sakaki. Phys. Rev. Lett, 79(9):1758, 1997.
- [6] C. Phillips, M.Y. Su, M.S. Sherwin, J. Ko, L. Coldren. App. Phys. Lett., 75(9):2728, 1999.
- [7] F. Capasso. IEEE J. Quantum Electron., 30(5):1313, 1999.
- [8] M.Y. Su, C. Phillips, J. Ko, L. Coldren, M.S. Sherwin. Physica B, 272:438, 1999.
- [9] M. Y. Su. Unpublished. Detailed calculations to be published elsewhere.