A MODEL OF SEQUENCE DEPENDENT PROTEIN DIFFUSION ALONG DNA.
Abstract
We introduce a probabilistic model for protein sliding motion along DNA during the search of a target sequence. The model accounts for possible effects due to sequence-dependent interaction between the nonspecific DNA and the protein. As an example, we focus on T7 RNA-polymerase and exploit the available information about its interaction at the promoter site in order to investigate the influence of bacteriophage T7 DNA sequence on the dynamics of the sliding process. Hydrogen bonds in the major groove are used as the main sequence-dependent interaction between RNA-polymerase and DNA. The resulting dynamical properties and the possibility of an experimental verification are discussed in details. We show that, while at large times the process reaches a pure diffusive regime, it initially displays a sub-diffusive behavior. The subdiffusive regime can lasts sufficiently long to be of biological interest.
† Dipartimento di Fisica “E.R. Caianiello” and INFM, Università di Salerno, Baronissi (SA), Italy; # Laboratoire de Physique, CNRS-UMR 5672, École Normale Supérieure de Lyon, Lyon, France; § Institut für Festkörperforschung, Forschungszentrum Jülich GmbH, Jülich, Germany; || Institute for Low Temperature Physics, Kharkov, Ukraine; and ¶ Laboratoire de Physique Theorique des Liquides, Université Pierre et Marie Curie, case courrier 121, 4 Place Jussieu - 75252 Paris cedex 05, France; e-mail: barbi@lptl.jussieu.fr .
KEYWORDS: sliding, promoter search, anomalous diffusion, DNA-RNAP interaction, dynamical models
Introduction
The way by which proteins can find their target sites along a DNA chain represents a puzzling problem. In many cases, the reaction rate has been demonstrated to be faster than diffusion controlled (Riggs et al., 1970; Berg et al., 1981; Reich and Mashhoon, 1991; Surby and Reich, 1996). Nonspecific sliding along the DNA has been proposed to be the main mechanism for faster search of the specific site on DNA (Park et al., 1982a, b; Singer and Wu, 1987; Ricchetti et al., 1988; Kabata et al., 1993; Guthold et al., 1994; Schulz et al., 1998; Guthold et al., 1999; Shimamoto, 1999; Harada et al., 1999). Nevertheless, a precise experimental determination of the statistical law characterizing the diffusion motion of protein along DNA during the specific site search is presently lacking. It is believed that during the sliding motion, the activation barrier for the translocation of the protein to continuous nonspecific positions is high enough to randomize the protein motion through collisions with the solvent water, but appropriately small compared to the thermal energy, in order to allow the protein to move (von Hippel and Berg, 1989). This has induced some authors to propose a model where protein freely slides along DNA under the effect of the thermal fluctuations without any sequence dependent interaction, i.e., the DNA is seen as an homogeneous cylinder on which the protein can diffuse until the specific site is reached (von Hippel and Berg, 1989; von Hippel et al., 1996; Park et al., 1982b). During sliding, however, the protein must be able to distinguish the specific region from nonspecific DNA so that a recognition mechanism must be involved. To this regard, the possibility that sliding could imply sequence dependent protein-DNA interaction is rather reasonable.
The aim of the present paper is to investigate this idea in the context of a simple probabilistic model for RNA-polymerase (RNAP) sliding along DNA, which accounts for the sequence-dependent interaction between the nonspecific DNA and the enzyme. As an illustrative example we consider the case of the T7 RNA-polymerase sliding on the bacteriophage T7 DNA (Dunn and Studier, 1983). Although the results of the paper are likely to be valid also for other enzymes, the T7 RNAP has several advantages which are suitable for our modelling. In particular, we mention the simplicity of the enzyme, (it is a small enzyme () composed of only of one unit, and recognizes a single asymmetric region on the DNA), and the availability of high resolution crystal structure data both for the RNAP alone and for the RNAP bound to his promoter (Jeruzalmi and Steitz, 1998; Cheetam et al., 1999; Cheetham and Steitz, 1999). In contrast to more complicated enzymes such as lac repressor (Winter et al., 1981), restriction endonuclease (EcoRI (Jack et al., 1982; Ehbrecht et al., 1985), EcoRV (Dowd and Lloyd, 1990; Stanford et al., 2000b)), methyl transferase (EcoRI (Surby and Reich, 1996)), E. coli RNA polymerase (Park et al., 1982b), etc., no direct evidence of diffusive sliding motion has been presented for T7 RNAP. However, the fact that the enzyme is able to locate his promoters inside about base pairs DNA during a time much shorter than what a three dimensional search would require (Endy et al., 2000), strongly suggests a sliding mechanism also in this case. In our model we assume therefore that T7 RNAP proceeds by sliding during the promoter search. The model is based on the idea that the RNAP needs to “read” the underlying sequence during sliding in order to test whether special “signals” associated with the promoter are present, i.e., a sequence-dependent interaction should be at work during the search. This means that the DNA sequence can influence the dynamics of the polymerase also far from the promoter. In this sense, the stop at the promoter should be the extreme effect of a complex dynamics, i.e., the RNAP should follow a noise-influenced, sequence-dependent motion that includes the possibility of slowing down, pauses and stops. From this point of view the usual assumption of a standard random walk of the RNAP along DNA (Berg et al., 1981; Kabata et al., 1993; Harada et al., 1999; Guthold et al., 1999; Stanford et al., 2000a) appears inadequate.
To investigate the possibility of a sequence-dependent diffusion motion of the RNAP along the DNA, we define a base sequence energy landscape from which hopping rates of the enzyme on the DNA (view as a discrete inhomogeneous lattice) can be deduced. Since only limited experimental knowledge exists about nonspecific DNA-protein interaction, we shall use information about sequence dependent RNAP-DNA interaction inside the promoter region and extrapolate it to nonspecific regions. The diffusive motion of the RNAP is then studied by Monte-Carlo simulations of the probabilistic process on the landscape energy both in absence and in presence of thresholds which define different rules for the hopping motion. As a result we show that while at large times the process reaches a pure diffusive regime, at the initial stage it displays a sub-diffusive behavior. It is remarkable that the anomalous diffusion regime can last for time large enough to be observable in single molecule experiments similar to those that have permitted to visualize sliding for the E. coli RNAP (Kabata et al., 1993; Harada et al., 1999; Guthold et al., 1999). Singule molecule experiments on T7 RNAP are indeed underway in several laboratories (Heslot, 2002; Baumann, 2002; Place, 2002). We remark that base sequence induced dynamics along DNA was also considered in Ref. (Salerno, 1991, 1995) in connection with a nonlinear model of DNA, and in Ref. (Jülicher and Bruinsma, 1997) in connection with the RNAP motion during the transcription process.
The paper is organized as follows: in Section 1 we use some known data on the T7 RNAP-promoter complex to introduce a sequence dependent model for the RNAP-DNA nonspecific interaction. An energy landscape with minima corresponding to the recognition sequence is constructed. We then introduce four possible models for the RNAP diffusive motion along the DNA by using the sequence induced energy landscape and its modification as the inclusion of energy thresholds, which allow to describe different possible reading mechanisms. The rate of translocation to the neighboring sites is constructed from the energy landscapes (for the different models) by means of the Arrhenius law. In Section 2 we use Monte-Carlo simulations to study in detail the different dynamical regimes of our models. Finally, we discuss in section 3 the limits of our analysis and the possibility to check the results with experiments, so as to verify if the inferred mechanism actually corresponds to the real one. Then we draw our Conclusions.
1 Methods: experimental data and theoretical model
1.1 T7 RNAP - DNA interaction and promoter recognition
The stability of the RNAP-DNA nonspecific complex is mainly due to electrostatic interaction with the backbone phosphate of DNA (von Hippel et al., 1996) and to the entropic release of cations (deHaseth et al., 1977; Sidorova and Rau, 2001; Singer and Wu, 1988). For specific interaction, while ionic effect could still be present (Record et al., 1977), the major stabilization effect arises from the release of water molecules (Sidorova and Rau, 2001). The presence of a layer of water between protein and DNA in nonspecific complex weakens the specific interaction. This suggests that a continuous variation between specific and nonspecific binding exists (Jeltsch et al., 1994); the transition from nonspecific to specific complex can be induced by conformational changes of the proteins (Spolar and Record, 1994).
Besides these stabilizing factors, sequence-dependent interaction allows the RNA polymerase to test the DNA during the promoter search (Travers, 1993). Experimental data on endonuclease EcoRI show that pausing of the protein during sliding occurs at sites which resemble the specific sequence (Jeltsch et al., 1994). Thus, the nonspecific “reading” should be of the same nature as the specific recognition111Also remark that, for the case of CRP protein, nonspecific binding have been proposed to mimics the specific, c-Amp-dependent binding (Katouzian-Safadi et al., 1993), this confirming the hypothesis of a continuity between nonspecific and specific recognition interaction.. From this observation one can deduce that at least some of the different kinds of interaction observed in the specific complex could be already present during sliding, and might be used in the recognition mechanism. This hypothesis can be interesting also if the actual reading mechanism is not exactly the same but a similar type; the study of the consequent dynamics may help, from a general point of view, in understanding which kind of sequence-dependent interaction is compatible with the experimental data.
The first point to address, in order to have a suitable description of the promoter search dynamics, is therefore to determine which sequence-dependent interaction is responsible of the promoter recognition by the T7 RNAP. Experimental results seem to indicate, as we will now discuss, that a specific set of hydrogen bonds on the 5 bps sequence GAGTC represents the main recognition core. We will therefore use this set of bonds as the main recognition tool in our model. Biochemical and structural analysis gives a very precise information on the principle of promoter recognition (McAllister, 1997; Souza, 1997) and on the polymerase-promoter specific complex for the case of bacteriophage T7 (Cheetam et al., 1999). T7 RNAP recognizes a 23 bps promoter, that extends from -17 to +6 relatively to the initiation site and consists of two functional domains (McAllister, 1997). It is reasonable to assume that the initiation domain, extending from -4 to +6, does not interfere directly in the promoter search: a measure of the dissociation constant with small oligonucleotides carrying truncated promoter have shown indeed that these base pairs do not participate in the promoter recognition (Újvári and Martin, 1997). Let us then consider the binding domain (from -17 to -5).
Different biochemical studies, together with a recent crystallographic analysis, contribute to the determination of the most relevant base pairs in this region. On one hand, a hierarchy of base pairs preferences was determined by single points mutations in the promoter (Chapman and Burgess, 1987; Diaz et al., 1993; Imburgio et al., 2000). These studies have shown lower sequence-sensitivity of the region -17 to -12: the specificity arises from bases -11 to -5, being more stringent on bases -7 to -9. The identification of the functional group of the DNA involved in those potential contacts shows that direct contact in the recognition region -11 to -5 arise mostly through the major groove of a double strand promoter (Schick and Martin, 1995; Li et al., 1996). On the other hand, the crystal structure of T7 RNAP bound to its promoter (Cheetam et al., 1999) is consistent with these biochemical studies (Imburgio et al., 2000) and draws a structural picture of the T7 RNAP promoter interaction222See Figs. 1 and 2 in Ref. (Cheetam et al., 1999) for a clear representation of the whole set of interactions.. In particular, a set of sequence-specific bonds between protein side chains and bases in the major groove arise in the region -11 to -7, via the formation of hydrogen bonds with the appropriate acceptor or donor chemical groups in the base pairs sides (See Fig. 1 and Fig. 2).
We remark that the previously mentioned kinetic studies suggest that base pairs -5 and -6 also can contribute to the recognition mechanism (Li et al., 1996): these contacts are probably lost once the open complex is formed, so that the mentioned crystallographic analysis does not show them. Anyway, the base specificity appears to be less stringent for these two contacts too (Li et al., 1996). Because of their weak specificity, we will neglect these two interacting base pairs, and focus here just on the hydrogen bond mediated interaction arising on bases -11 to -7, that has the strongest sensitivity to the base pairs. The question addressed will be therefore how the specific interaction of this 5 bps region influences the polymerase motion.
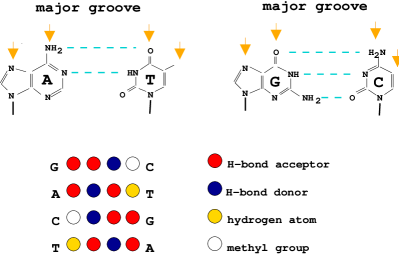
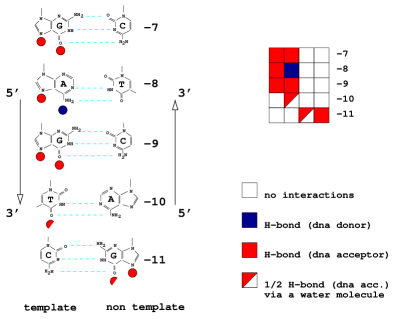
Hydrogen bond acceptors and donors are regularly positioned on the promoter major groove: the DNA geometry is in fact such that each of the four different base pairs exposes four possible major groove interacting sites as depicted in Fig. 1 (Seeman et al., 1976). These sites can be either H-bond acceptors and donors, or sites where a hydrogen atom or a methyl group are present. In the latter case they do not bond directly to polymerase (at least at the promoter site). Fig. 2 depicts the H-bonds actually made between polymerase and DNA at the promoter, as revealed by the crystallographic analysis. The two semicircles in the left part of Fig. 2 and their correspondent positions on the right pattern refer to the presence of a hydrogen bond which is shared between two DNA sites through a water molecule (Cheetam et al., 1999).
We shall assume that, in each position along DNA, the RNAP “tries” to make the same set of hydrogen bonds as at the promoter, testing in this way the underlying sequence. It is convenient to represent the RNAP by a recognition matrix able to match its target sequence, i.e., containing the pattern of active chemical groups that allows for the best binding at the promoter. We suppose therefore that each position along DNA will have a certain number of made (matches) and unmade (mismatches) hydrogen bonds with the polymerase recognition matrix. For simplicity, we will represent the recognition pattern directly in terms of its corresponding binding sites on DNA333This is also a way to remind that we actually do not include in the model all the possible polymerase-DNA nonspecific bonds, but only those that are made at the promoter, for which an experimental evidence is available..
One expects that each match will stabilize the complex, while mismatches will act as to destabilize RNAP, that will tend therefore to move away from the “wrong” positions (von Hippel and Berg, 1989; von Hippel et al., 1996). For each position along the chain we define an energy , simply by counting the number of matches and mismatches, and adding a corresponding negative or positive amount of energy, respectively (empty sites in the recognition matrix do not contribute to the energy). Interacting sites corresponding to the semicircles in Fig. 2 are evaluated in a first approximation as half hydrogen bonds everywhere along the chain.
Formally, the energy is defined by denoting by respectively the acceptor, donor, and noninteracting DNA sites. The DNA sequence is then represented as a list of vectors, , where
The polymerase acts, at position , on the sequence of 5 bases that is represented by the matrix (. The consensus sequence GAGTC at the promoter site corresponds therefore to the matrix
We then define a recognition matrix , corresponding to Fig. 2,
where the factors have been introduced in order to reproduce the shared hydrogen bond, previously mentioned. With this notation, the interaction energy can be written simply as
| (1) |
where the dot denotes the usual matrix multiplication and is the trace. Minima correspond to the complete matching and thus to the recognition sequence GAGTC. Each positive or negative contribution to the energy, , is equal to a hydrogen bond energy. Note that the mobility of RNAPs dramatically depends on . At room temperature, is about 0.025 eV (or = 0.6 kcal/mol, ); the energy barriers must be smaller in order to allow the RNAP to move and reach the promoter site444This may seem not consistent with the usual measured strength of chemical hydrogen bonds, which normally corresponds to a few kcal/mol (Stryer, 1995; Voet and Voet, 1995). The distance and orientation of the hydrogen bonds, however, together with their net energetics due to the interaction with the solvent, may be responsible of a relevant lowering of the interaction energy.. Since there are no direct measurements of the interaction energies during sliding and it is difficult to make an estimate of the involved hydrogen bond strength, we shall use as a free parameter. The resulting energy defines an irregular landscape on which the RNAP can move as it will be discussed in the next subsection.
1.2 Sequence dependent RNAP diffusive model
We shall introduce in this subsection four versions of the model describing different mechanisms of the fundamental translocation step in the enzyme motion. The length of hydrogen bonds (up to Å in DNA-protein interaction (Nadassy et al., 1999)) can roughly reach the same order of magnitude as the distance between base pairs ( Å). Therefore, the RNAP may eventually shift directly from one position to the next one without activation energy for the one step process. On the contrary, if the RNAP has to disrupt partially or completely the hydrogen bonds on one site before moving to the next position, it has to overcome an additional activation barrier.
Furthermore, RNAP could have some internal flexibility allowing for conformational changes, eventually depending on the local degree of stability: i.e., it is possible that, if too many mismatches are found, RNAP should undergo a conformational change from a “reading” mode to a “sliding” mode, where no hydrogen bonds are effectively made (von Hippel et al., 1996). In this case, one has a sort of two-states model, for which, if the total energy is over a threshold , the system passes to a different state of constant energy where RNAP can freely slide.
 |
 |
 |
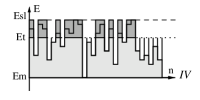 |
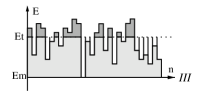
To account for all these possibilities, we define and analyze some different models, sketched in Fig. 3 and listed hereafter:
-
I)
no-threshold model (Fig. 3, I): hydrogen bonds can directly translate from one position to another without being destroyed. In this case the energy difference from to is simply
(2) here is set to zero if is negative, as usual.
-
II)
maximal-threshold model (Fig. 3, II): in order to reach a next site, RNAP must destroy all bonds and pass through a state of “total mismatch”. In this case , where .
-
III)
intermediate-threshold model (Fig. 3, III): in order to reach a next site, RNAP must destroy all bonds and pass through an intermediate “zero” state defined by a threshold energy . One has therefore
Models I and II are actually the two limiting cases of model III when the threshold is set to the minimum and maximum values of the potential energy, respectively. These three models could therefore be considered as three cases of a unique model, just dependent on the choice of the energy threshold. We will anyway refer to these three cases as to models I , II and III in the following, for convenience. Note that in the general case of an intermediate threshold, the previous model gives two different possible regimes for the polymerase, because the energy profile is qualitatively different in regions where is greater or lower than .
Finally, to account simultaneously for two possible regimes of the RNAP-DNA interaction mentioned above, we propose a fourth model as follows:
-
IV)
two-regimes model (Fig. 3, IV): a threshold energy separates “reading” regions, where the energy is , from “sliding” regions, where no hydrogen bonds are made and the RNA polymerase can freely diffuse on a flat energy landscape, . Below the threshold, the barrier still affect the translocation as in case of model III. For simplicity, we will fix the value of to . In this case, one can redefine the energy as
(3) and results to be defined as in case III .
Note that our model IV interpolates between straight sequence-dependent walk (model I ) and the biological model of the promoter search proposed by von Hippel in Ref. (von Hippel and Berg, 1989; von Hippel et al., 1996). The scenario suggested by von Hippel relies indeed on the idea that the specific interaction is “switched off” by a conformational change if too many mismatches are present. In that picture, RNAP is more often in a “sliding” mode, where the specific hydrogen bond interaction is inactive. A quantitative description of this mechanism can be obtained by the introduction of our model IV, where the varying threshold level accounts for the degree of homology which leads to the supposed RNAP conformational change.
The rates of translocation between neighboring sites and are, according to the Arrhenius law, proportional to , where . The model includes a nonzero probability for the polymerase to stop at one position; the complete set of translocation rates reads therefore:
| (4) |
In the case of flat energy landscape () all the rates are equal to , which defines a simple one-dimensional diffusion process with diffusion constant .
If the discretization of length, ( is the base pair step), and time, , is explicitly taken into account, then the dimensionless given by the relation corresponds to a physical value of . In order to give a quantitative meaning to our results we need an estimate for the (mean) time required for each translocation step. The upper diffusion limit, , associated to a physical diffusion constant , would correspond to a free diffusion without any local trapping effect. Schurr (Schurr, 1979) has estimated this upper limit of the one-dimensional diffusion constant of lac repressor sliding and rotating along DNA helix track to be . The lac repressor was approximated by a hard ball of radius moving in a viscous medium. Using the Schurr’s approach, and accounting for the difference in sizes between the lac repressor and the T7 RNA polymerase , the upper limit of the polymerase diffusion constant would rescale as (see Ref. (Schurr, 1979) for details): . The latter being compared to a “free diffusion” limit , , sets the elementary time interval , during which a translocation to the nearest base pair may happen.

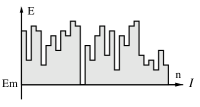
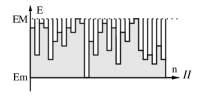
Let us finally consider the distribution of energy levels that is obtained when the real T7 DNA sequence is considered and the energy landscape is evaluated through the local degree of homology by Equation (1). In Fig. 4 the energy distribution evaluated on the whole T7 sequence is represented. As can be seen by comparing with the superimposed fit, the resulting distribution for models I to III is almost Gaussian. Note that in the case of model IV all contributions to levels above the threshold are obviously condensed in a unique level (see inset of Fig. 4).
2 Results: recognition efficiency and anomalous diffusion
The first important check of the four RNAP models is related to their affinity to the promoter region. Theoretically, one can easily estimate the stationary distribution of a population of polymerase on the four different model landscapes as
| (5) |
As usual, the stationary distribution only depends on the site energy, and not on differences and thresholds. Consequently, models I to III have the same distribution, whereas the redefinition of energy in model IV leads to a substantially different result. Equation (5) straightforwardly implies that the recognition sites, which have the lower energy, will be in average the most populated.
In order to verify that this is indeed obtained in a dynamical context, we simulated numerically the time evolution of models I to IV taking a uniform distribution of independent RNAPs on a DNA region of bps as initial condition. Note that the assumption of an uniform initial distribution is statistically equivalent to considering the probability evolution of a single polymerase binding to DNA at random site. The simulation is performed on the first base-pairs of the T7 sequence, which contains two recognition sequences GAGTC, at positions and .

After a sufficiently long time, the polymerase distribution spreads out, as shown in the inset of Fig. 5, and shows a series of peaks corresponding to the sites with larger occupancy. Where the border effects can be neglected, this distribution tends to its equilibrium limit; this is shown in Fig. 5, where we plot a portion of the distribution obtained after time steps for model I , together with . As expected, the larger peaks correspond to energy minima, i.e., to the location of the two recognition sequences GAGTC present in this DNA region. For all the models I to III the final distribution is similar, with the two highest peaks exactly in correspondence to the two recognition sequences, this confirming that the energy landscape defined on the basis of the pattern matching actually guides the polymerase to the promoter recognition sequences.
Note that, in case of model IV , the distribution of levels is different, this obviously implying a different shape for . The case of a sufficiently low threshold energy is reflected on an asymptotic distribution with rarer, larger peaks on a very low constant background (data not shown).
We now investigate the dynamical behavior of the four models, and check if there are some relevant deviations from random walk, induced by the sequence sensitivity. For large enough values of , some positions along DNA could trap polymerase for long time, this implying that, at small and intermediate time, diffusion could be substantially different than for a pure random walk. In order to estimate this effect, we calculate the mean square displacement for the polymerase:
| (6) |
We average over independent particles, initially distributed uniformly in the DNA region . This procedure therefore includes both average on a large number of particles and on a large set of initial conditions.

Starting from model I , we investigate the dependence of the diffusive behavior on . Results are shown in Fig. 6. In the limit of , i.e., in the case of a flat potential (or ), the diffusion is of course normal, with and , so that the corresponding curve is a straight line of slope 1 in the log-log plot (upper curve on Fig. 6). For larger values of (smaller temperatures compared with the energy fluctuations), the dynamics of the model shows initially large deviations from the normal diffusion: in these finite temperature cases, the motion is initially subdiffusive, with
| (7) |
The exponent increases monotonically with time towards its asymptotic value . The initial deviation and the crossover to both increase with . This behavior does not depend on the choice of the initial condition and it is not a transient induced by some properties: we have verified indeed that qualitatively the same time dependence is reproduced after an initial transient time of , or time steps. As expected, once reached the normal diffusion regime, different temperatures correspond to different diffusion constants (in the log-log representation, corresponds to the vertical offset of the lines of slope , according to the relation ).
Plots of Fig. 6 also give a measure of the slowing down in the promoter search induced by the sequence-dependent interaction. Indeed, in the log-log plot the horizontal offset, at a given , between different curves corresponds to the logarithm of the ratio between the time needed to cross the corresponding displacement for different choices of . Therefore, if is a typical distance to promoter, the horizontal offset just gives the slowing factor induced by subdiffusion with respect to normal diffusion. Referring to Fig. 6, we can conclude that, if the distance to promoter is larger than (so that ), then the time to reach the promoter should be reduced with respect to standard diffusion roughly of a factor for the case , of a factor for . Furthermore, this slowing factor does not depend on , provided that it is large enough to consider the asymptotic regime. In this hypothesis, it is possible to obtain an analytical estimation of the slowing factor (Barbi et al., 2002).

We will now extend the diffusion analysis to the other versions of the model, introduced in Section 1. Resulting curves for models I to IV and for are presented in Fig. 7. As for model I , in all cases we observe at short time a subdiffusive regime due to the trapping effect of the rough energy landscape.
The initial values of , fitted in the time range through the function , are the following for the first three models:
Note that model IV displays in this short time regime a particular behavior, that will be discussed in the following.
Let us remark that, in principle, the obtained anomalous diffusion could be due to some particular spatial correlation properties of the underlying potential. Nevertheless, we have checked that it is only due to the roughness of the landscape, doing the same experiment on an artificial base sequence, completely random. In the conditions described by model I , for instance, and in the same fit range, we obtained , and a curve similar to T7 DNA case (data not shown).

We then studied the behavior of the short time subdiffusive exponent as a function of for model III with varying threshold (i.e., including model I and II ). The results are shown on Fig. 8. For threshold lower that a critical value of about the system displays almost no sensitivity to the threshold level. Indeed, This is due to the fact that, some relevant effect, it is necessary to have not only a site with , but also at least two neighboring sites should be below the threshold in order to feel its effect (see Eq. III)). The probability of finding two adjacent sites below the threshold is too low below , thus explaining the observed insensitivity. Interestingly, the exponent becomes a nonmonotonic and very sensitive function of for larger values of . The effect of the threshold in this intermediate regime is in fact twofold: from one side, it induces an additional damping on many low energy sites; from the other, it makes (a fraction of) these same sites “blind” to the energies of their neighborings (the translocation barriers only will depend on and ). The complex balance between the two contributions induces the high instability of the fit results displayed in Fig. 8. As the threshold increases above the maximum level (), the disorder of the underlying energy landscape becomes less and less important, and the system tends to recover a standard diffusive behavior strongly damped, i.e., with and .
Now let us consider the large time limit. The asymptotic diffusion constant depends on the model choice. A linear fit of the large time regime of of Fig. 7 has been done in order to estimate the average diffusion constant , in the random walk approximation where . Besides, we checked that an effective linear behavior is reached in the corresponding time range by fitting again with a function and verifying that is close to unity. The resulting diffusion constants and the exponents for the four models at large time () are given, for , respectively by:
| (8) |
The corresponding fits are the straight lines in Fig. 7.

The differences in the equilibrium diffusion constant between different models are explicitly related to the activation barrier in the four cases: the higher is the threshold to overcome in order to move one step, the lower is the diffusion constant. Note that in the case of model IV the boundaries between flat and rough regions act as energy barriers of amplitude : these barriers appear to affect the motion more strongly than the threshold , this resulting in a diffusion constant closer to that of model II than to that of model III .
We have analyzed the dependence on also for the asymptotic diffusion constant . Fig. 9 shows the dependence of on in model III 555For technical reasons, we display data resulting from the fit in the range , i.e., in a region where the parameter has not yet reached unity. The curve of Fig. 9 represents therefore only a qualitative analysis and shows some small discrepancy with data given in Eq. 2.. Again, almost no sensitivity to the threshold level is observed below a critical value, approximatively . Roughly, between this value and , we observe a transition to a regime of strong sensitivity (), where the damping effect induced by the threshold is much more enhanced. The diffusion constant decreases rapidly above the maximal energy (, vertical line), as intuitively expected.

We shall now discuss in detail model IV , since it displays, with respect to the others, a more complicated behavior. Note that, in principle, model IV can be put exactly in the same scheme as the other models, once the underlined potential is redefined according to Equation (3). Nevertheless, this redefinition of the energy landscape leads to substantially different features. As can be observed in Fig. 10, during an initial time interval the polymerase diffuses more rapidly, even if still subdiffusively, with initially a larger effective diffusion constant. The initial speeding up of the dynamics becomes more pronounced as the value of the threshold decreases, i.e., as the energy redefinition involves an increasing number of sites. This effect can be explained by considering how the potential landscape is changed for model IV . Among the particles, uniformly distributed at time zero over a large region of the sequence, all those that are initially on flat regions of energy will start diffusing freely with diffusion constant equal to , until they fall down in one region. These particles contribute initially to the diffusion with a large term, thus making it increase. After an initial transient, however, most of the particles will be almost trapped in the potential wells, and the effective diffusion coefficient will decrease accordingly.
More precisely, the trapping effect will depend on the value of , set to in our calculations. If is big enough, most of the particles will be trapped in regions, with activation barriers and only a small probability to escape again toward the flat plateaux. Therefore, in the long time regime, the system will be essentially in the same state model III , but mostly localized in some finite regions. In other words, the particular equilibrium conditions introduced in model IV are indeed such that one particle needs to spend a large amount of energy (and, therefore, of time) before reaching a high level plateau, but once reached, it can move much faster to the next favorable site. An analytical derivation of the main dynamical quantities as functions of the model parameters discussed in this section will be presented elsewhere (Barbi et al., 2002).
3 Discussion
All the results presented in this work can be checked by a comparison with detailed experimental data. As mentioned in the introduction, experiments leading to a rather precise determination of the RNAP position along DNA at different times during the promoter search have already appeared (Kabata et al., 1993; Harada et al., 1999; Guthold et al., 1999), and others are in progress (Place, 2002). This will give for the first time the possibility to estimate the detailed features of the T7 RNAP diffusive motion. As we have shown, a dynamical model which includes both the affinity for the promoter together and the possibility of sliding, leads to a nontrivial sequence dependent dynamics, at least in some range of the parameters. It is thus important to verify if these effects can actually be observed experimentally. The sliding distance is kinetically evaluated in different experiments around bps ((Shimamoto, 1999) and references therein). This is probably not peculiar to RNAP since other enzymes also seem to slide along the DNA covering a short distance of about bps before being released in solution (Stanford et al., 2000a). In this space scale, the anomalous diffusion behavior is predominant for our model.
In particular, the recent scanning force microscope (SFM) experiment, performed by Guthold et al. (Guthold et al., 1999), allows for a direct observation of one E. coli RNAP sliding back and forth on a single DNA chain partially adsorbed on a mica surface, although with some technical limitations (the average lifetime of the nonspecific complex is more than hundred times larger than what measured in solution, probably due to the two-dimensional constraints). The statistical properties of the observed diffusive motion have been fitted by the law , in order to confirm the general assumption that RNAP moves randomly along DNA ((Guthold et al., 1999), Fig. 2). Quantitatively, however, in the observed displacement ranges (less than two hundreds base-pairs), the corresponding data seem to deviate from a pure diffusive motion. This may be due to the experimental constraints and to the limited number of RNAP sliding trajectories (about 30). On the other hand, the rough estimate of numerical data from Fig. 2 of Ref. (Guthold et al., 1999), fitted with a power law of the type , gives . It is very interesting to note that these data seem much more compatible with a subdiffusive behavior than with normal diffusion, as is usually assumed. This first experiment allowing for a direct visualization of the RNAP sliding motion gives therefore, from our point of view, intriguing and encouraging results.
We remark that the dynamical features described here depend crucially on the choice of the model parameters: the ratio , the value of the energy threshold , and, in the case of model IV , the energy of the plateaux . As a first check, we can try to compare our rough estimation of the power exponent we estrapolate from the results in Ref. (Guthold et al., 1999) with the behavior of the model as a function of . The value of about very roughly corresponds to for all values of , this confirming that the parameter choice made in the most part of our simulations could be indeed of the right order of magnitude.
Further experimental investigations, devoted to the detailed determination of the nonspecific interaction, are necessary to improve the model. The version of the model which is compatible with the sliding RNAP dynamics of single molecule experiments should emerge from comparison with the experimental data, using the model parameters as fitting parameters. In practice, the complicated diffusive behavior of the model will allow us to compare theory and experiments by means of more than one dynamical observable. For the case of model IV , where the additional model parameter is needed, the presence of a new short-time specific feature could be used in the fit of the experimental results.
From a biological point of view, the four models offer a framework for defining the pertinent parameters to optimize the promoter search. For all models, the specific interaction energy between RNAP and DNA is crucial and should be close to in order to allow the polymerase to move. This adjustment of the interaction energy can be achieved by varying the distance and angle of the H-bonds during sliding. Perhaps, the more interesting model from a biological point of view is model IV , since it allows for a better control of the diffusion pattern, and consequently for the corresponding biological function. An exact balance has to be found in biological system between the reading and sliding mode. , , and have to be optimized for the biological purpose which will be physically reflected by the protein-DNA interaction and by the DNA sequence.
Finally, it is important to keep in mind that the recognition mechanism through hydrogen bonds considered here does not allow for a complete identification of the promoters. The recognition sequence GACTC (or of the complementary sequence GAGTC) appears in the complete T7 genome more than 90 times; however, only 10 of them actually belongs to 17 bps long promoters. Evidently, other “signals” cooperate with the direct pattern recognition mechanism in order to allow the polymerase to find its target. The weak sequence TAATA (positions -13 to -17), for instance, also interacts with RNAP through the minor groove (Cheetam et al., 1999). A sensitivity to this minor groove region should probably be included. In this sense, our model represents a first attempt towards a detailed description of the RNAP dynamics during the promoter search. The model can also be extended to the case of other enzymes by a detailed introduction of their sequence-dependent interaction with nonspecific DNA. We believe that the main idea of the model, which is the link between base sequence and enzyme dynamics, will be valid in general. Indeed, as far as a sequence dependence is considered, the enzyme will always interact with DNA through an effective potential with a fluctuating profile. This potential should be induced for different enzymes by different kinds of interaction. Its roughness by itself, however, will always generate anomalous diffusion features as those described in this paper.
Conclusions
In this paper we have proposed a simple model for the RNAP sliding motion along DNA, which includes a sequence dependent interaction. We deduced an hypothetical polymerase-DNA interaction from the crystallographic structure of the T7 polymerase-promoter complex (Cheetam et al., 1999). We have included four possible variations by considering slightly different translocation probabilities, i.e., by the presence of a variable activation barrier (leading to models I to III ), and eventually by distinguishing “reading” regions from “sliding” regions, where no hydrogen bonds are made so that the RNAP can freely diffuse on an effective constant potential (model IV ).
A numerical study of the diffusion properties of the four versions of the model shows that a normal diffusion regime is only achieved after some time. We have shown as all the four models are characterized at shorter times by a subdiffusive behavior. A rough estimation of the slowing factor induced by the sequence dependence for different values of the energy parameter can be easily obtained. This result is of particular interest because, as we have discussed, the anomalous diffusion is observed in a range that corresponds approximatively to the experimentally observed characteristic distance covered by the RNAP during sliding (Shimamoto, 1999). The physical reasons underlying the different diffusion behaviors have been discussed.
Nowadays the existing nano-technologies and single molecule techniques allow for constraining and manipulating single biological objects. The present paper represents a first step towards theoretical picture where some of the resulting experimental results could be analyzed and connected with the known functional properties of the corresponding biological systems. It is important to keep in mind, anyway, that the in vivo dynamics of the corresponding biological processes occurs in a high density environment, in presence of very complex spatial structures and of water molecules mainly bound and structured (Goodsell, 1992). What we usually call the diffusive motion of proteins inside the cell is likely to be instead a motion strongly dependent on a complex set of environmental trapping sites, as in the case considered here. Also in this respect, the approach proposed in this paper may have a larger range of application.
We are grateful to A. Lesne, M. Peyrard and S. Ruffo for helpful discussions. M.B. wishes to thanks the EU and the Physics Department of the University of Salerno, Italy, for a two years post-doctoral research grant during which this work was done. V.P. acknowledges the Physics Department of the University of Salerno for financial support of two short term visits during which part of this work was done. M.S. acknowledges partial support from MURST through a PRIN-2000 Initiative and from the European grant LOCNET n.o HPRN-CT-1999-00163.
References
- Barbi et al. (2002) Barbi, M., V. Popkov, and M. Salerno, 2002, in preparation.
- Baumann (2002) Baumann, C. G., 2002, oral communication, meeting ”DNA in chromatin”, Arcachon, France.
- Berg et al. (1981) Berg, O. G., R. B. Winter, and P. von Hippel, 1981, Diffusion-driven mechanisms of protein translocation on nucleic acids. 1. Models and theory, Biochemistry 20, 6929.
- Chapman and Burgess (1987) Chapman, K. A. and R. R. Burgess, 1987, Construction of bacteriophage T7 late promoters with point mutations and characterization by in vitro transcription properties., Nucleic Acids Res. 15, 5413.
- Cheetam et al. (1999) Cheetam, G. T., D. Jeruzalemi, and T. A. Steitz, 1999, Structural basis for initiation of transcription from an RNA polymerase-promoter complex, Nature 399, 80.
- Cheetham and Steitz (1999) Cheetham, G. M. and T. A. Steitz, 1999, Structure of a transcribing T7 RNA polymerase initiation complex, Science 286, 2305.
- deHaseth et al. (1977) deHaseth, P. L., T. Lohman, and M. T. J. Record, 1977, Nonspecific interaction of lac repressor with DNA: an association reaction driven by counterion release, Biochemistry 16, 4783.
- Diaz et al. (1993) Diaz, G. A., C. A. Raskin, and W. T. McAllister, 1993, Hierarchy of base-pair preference in the binding domain of the bacteriophage T7 promoter., J. Mol. Biol. 229, 805.
- Dowd and Lloyd (1990) Dowd, D. R. and R. S. Lloyd, 1990, Biological significance of facilitated diffusion in protein-DNA interactions. Applications to T4 endonuclease V-initiated DNA repair., J. Biol. Chem. 265, 3424.
- Dunn and Studier (1983) Dunn, J. J. and F. W. Studier, 1983, Complete nucleotide sequence of bacteriophage T7 DNA and the location of the T7 elements, J. Mol. Biol. 166, 477.
- Ehbrecht et al. (1985) Ehbrecht, H., A. Pingoud, C. Urbanke, G. Maass, and C. Gualerzi, 1985, Linear diffusion of restriction endonucleases on DNA, J. Biol. Chem. 260, 6160.
- Endy et al. (2000) Endy, D., L. You, J. Yin, and I. Molineux, 2000, Computation, prediction, and experimental tests of fitness for bacteriophage T7 mutants with permuted genomes., Proc. Natl. Acad. Sci. USA 97, 5375.
- Goodsell (1992) Goodsell, D. S., 1992, A look inside the living cell, Amer. Scientist 80, 457.
- Gueroui et al. (2002) Gueroui, Z., C. Place, E. Freyssingeas, and B. Berge, 2002, Observation by Fluorescence Microscopy of Transcription on single combed DNA, Proc. Natl. Acad. Sci. USA 99, 6005.
- Guthold et al. (1994) Guthold, M., M. Bezanilla, D. A. Erie, B. Jenkins, H. G. Hansma, and C. Bustamante, 1994, Following the assembly of RNA polymerase-DNA complexes in acqueous solutions with the scanning force microscope., Proc. Natl. Acad. Sci. U.S.A. 91, 12927.
- Guthold et al. (1999) Guthold, M., X. Zhu, C. Rivetti, G. Yang, N. H. Thomson, S. Kasas, H. G. Hansma, B. Smith, N. K. Hansma, and C. Bustamante, 1999, Direct observation of one-dimensional diffusion and transcription by escherichia coli RNA polymerase., Biophys. J. 77, 2284.
- Harada et al. (1999) Harada, Y., T. Funatsu, K. Murakami, Y. Nonoyama, A. Ishihama, and T. Yanagida, 1999, Single-molecule imaging of RNA polymerase-DNA interactions in real time, Biophys. J. 76, 709.
- Heslot (2002) Heslot, F., 2002, oral communication, meeting ”DNA in chromatin”, Arcachon, France.
- von Hippel and Berg (1989) von Hippel, P. H. and O. G. Berg, 1989, Facilitated Target Location in Biological Systems, J. Biol. Chem. 264, 675.
- von Hippel et al. (1996) von Hippel, P. H., W. A. Rees, K. Rippe, and K. S. Wilson, 1996, Specificity mechanisms in the control of transcription, Biophys. Chem. 59, 231.
- Imburgio et al. (2000) Imburgio, D., M. Rong, K. Ma, and W. T. McAllister, 2000, Studies of promoter recognition and start site selection by T7 RNA polymerase using a comprehensive collection of promoter variants, Biochemistry 39, 10419.
- Jack et al. (1982) Jack, W. E., B. J. Terry, and P. Modrich, 1982, Involvement of outside DNA sequences in the major kinetic path by which EcoRI endonuclease locates and leaves its recognition sequence, Proc. Natl. Acad. Sci. USA 79, 4010.
- Jeltsch et al. (1994) Jeltsch, A., J. Alves, H. Wolfes, G. Maass, and A. Pingoud, 1994, Pausing of the restriction endonuclease EcoRI during linear diffusion on DNA, Biochemistry 33, 10215.
- Jeruzalmi and Steitz (1998) Jeruzalmi, D. and T. A. Steitz, 1998, Structure of T7 RNA polymerase complexed to the transcriptional inhibitor T7 lysozyme, EMBO J. 17, 4101.
- Jülicher and Bruinsma (1997) Jülicher, F. and R. Bruinsma, 1997, Motion of RNA Polymerase along DNA: A Stochastic Model, Biophys. J. 74, 1169.
- Kabata et al. (1993) Kabata, H., O. Kurosawa, I. Arai, M. Washizu, S. Margarson, R. Glass, and N. Shimamoto, 1993, Visualisation of single molecules of RNA polymerase sliding along DNA., Science 262, 1561.
- Katouzian-Safadi et al. (1993) Katouzian-Safadi, M., B. Blazy, J. Y. Cremet, J. P. Le Caer, J. Rossier, and M. Charlier, 1993, Photo-cross-linking of CRP to nonspecific DNA in the absence of cAMP. DNA interacts with both the N- and C-terminal parts of the protein, Biochemistry 32, 1770.
- Li et al. (1996) Li, T., H. Hung Ho, M. Maslak, C. Schick, and C. T. Martin, 1996, Major Groove Recognition elements in the Middle of the T7 RNA Polymerase Promoter, Biochemistry 35, 3722.
- McAllister (1997) McAllister, W. T., 1997, in Mechanisms of Transcription, edited by F. Eckstein and D. M. J. Lilley (Springer-Verlag, Berlin and Heidelberg), p. 15.
- Nadassy et al. (1999) Nadassy, K., S. J. Wodak, and J. Janin, 1999, Structural Features of Protein-Nucleic Acid Recognition Sites, Biochemistry 38, 1999.
- Park et al. (1982a) Park, C. S., Z. Hillel, and C. W. Wu, 1982a, Molecular mechanism of promoter selection in gene transcription. I Development of a rapid mixing-photocross linking technique to study the kinetics of Escherichia coli RNA polymerase binding to T7 DNA., J. Biol. Chem. 257, 6944.
- Park et al. (1982b) Park, C. S., F. Y. Wu, and C. W. Wu, 1982b, Molecular mechanism of promoter selection in gene transcription. II, J. Biol. Chem. 257, 6950.
- Place (2002) Place, C., 2002, personal communication, see also (Gueroui et al., 2002).
- Record et al. (1977) Record, M. T. J., P. L. deHaseth, and T. Lohman, 1977, Interpretation of monovalent and divalent cation effects on the lac repressor-operator interaction, Biochemistry 16, 4791.
- Reich and Mashhoon (1991) Reich, N. O. and N. Mashhoon, 1991, Kinetic mechanism of the EcoRI DNA methyltransferase, Biochemistry 30, 2933.
- Ricchetti et al. (1988) Ricchetti, M., W. Metzger, and H. Heumann, 1988, One-dimensional diffusion of Escherichia coli DNA-dependent RNA polymerase: A mechanism to facilitate promoter location, Proc. Natl. Acad. Sci. U.S.A. 85, 4610.
- Riggs et al. (1970) Riggs, A. D., S. Bourgeois, and M. Cohn, 1970, The lac repressor-operator interaction. 3. Kinetic studies., J. Mol. Biol. 53, 401.
- Salerno (1991) Salerno, M., 1991, Discrete model for DNA promoters dynamics, Phys. Rev. A 44, 5292.
- Salerno (1995) Salerno, M., 1995, in Nonlinear Excitations in Biomolecules, edited by M. Peyrard (Edition de Physique, Springer), p. 147.
- Schick and Martin (1995) Schick, C. and C. Martin, 1995, Tests of a model of specific contacts in T7 RNA polymerase-promoter interactions, Biochemistry 34, 666.
- Schulz et al. (1998) Schulz, A., N. Mucke, J. Langowski, and K. Rippe, 1998, Scanning Force Microscopy of Escherichia coli RNA Polymerase sigma 54 Holoenzime Complexes with DNA Buffer and in Air, J. Mol. Biol. 283, 921.
- Schurr (1979) Schurr, J. M., 1979, The one-dimensional diffusion coefficient of proteins absorbed on DNA; Hydrodynamic considerations, Biophys. Chem. 9, 413.
- Seeman et al. (1976) Seeman, N. C., J. M. Rosenberg, and A. Rich, 1976, Sequence-specific recognition of double helical nucleic acids by proteins, Proc. Natl. Acad. Sci. USA 73, 804.
- Shimamoto (1999) Shimamoto, N., 1999, One dimensional diffusion of proteins along DNA: its biological and chemical significance revealed by single-molecule measurements., J. Biol. Chem. 274, 15293.
- Sidorova and Rau (2001) Sidorova, N. Y. and D. C. Rau, 2001, Linkage of EcoRI dissociation from its specific DNA recognition site to water activity, salt concentration, and pH: separating their roles in specific and non-specific binding, J. Mol. Biol. 310, 801.
- Singer and Wu (1987) Singer, P. and C. W. Wu, 1987, Promoter search bu Escherichia coli RNA polymerase on a circular DNA template, J. Biol. Chem. 262, 14178.
- Singer and Wu (1988) Singer, P. T. and C. W. Wu, 1988, Kinetics of promoter search by Escherichia coli RNA polymerase. Effects of monovalent and divalent cations and temperature, J. Biol. Chem. 263, 4208.
- Souza (1997) Souza, R., 1997, in Mechanisms of Transcription, edited by F. Eckstein and D. M. J. Lilley (Springer-Verlag, Berlin and Heidelberg), p. 1.
- Spolar and Record (1994) Spolar, R. S. and M. T. J. Record, 1994, Coupling of local folding to site-specific binding of proteins to DNA, Science 263, 777.
- Stanford et al. (2000a) Stanford, N., M. Szczelkun, J. Marko, and S. Halford, 2000a, One- and three-dimensional pathways for proteins to reach specific DNA sites, EMBO J. 19, 6546.
- Stanford et al. (2000b) Stanford, N. P., M. Szczelkun, J. Marko, and S. E. Halford, 2000b, Contribution of facilitated diffusion and processive catalysis to enzyme efficiency: implications for the EcoRI restriction-modification system, EMBO J. 19, 6546.
- Stryer (1995) Stryer, L., 1995, Biochemistry (W. H. Freeman and Company, Inc., New York).
- Surby and Reich (1996) Surby, M. and N. O. Reich, 1996, Contribution of facilitated diffusion and processive catalysis to enzyme efficiency: implications for the EcoRI restriction-modification system, Biochemistry 35, 2201.
- Travers (1993) Travers, A., 1993, DNA-Protein Interactions (Chapman and Hall, London), chapter 3 and 4.
- Újvári and Martin (1997) Újvári, A. and C. T. Martin, 1997, Identification of a minimal binding element within the T7 RNA Polymerase promoter, J. Mol. Biol. 273, 775, and references herein.
- Voet and Voet (1995) Voet, D. and J. G. Voet, 1995, Biochemistry (John Wiley & Sons, New York).
- Winter et al. (1981) Winter, R. B., O. G. Berg, and P. H. von Hippel, 1981, Diffusion driven mechanisms of protein translocation on nucleic acids. 3. The escherichia coli lac-operator interaction : kinetic measurements and conclusions., Biochemistry 20, 6961.