DNA hybridization to mismatched templates: a chip study
Abstract
High-density oligonucleotide arrays are among the most rapidly expanding technologies in biology today. In the GeneChip system, the reconstruction of the target concentration depends upon the differential signal generated from hybridizing the target RNA to two nearly identical templates: a perfect match (PM) and a single mismatch (MM) probe. It has been observed that a large fraction of MM probes repeatably bind targets better than the PMs, against the usual expectation from sequence-specific hybridization; this is difficult to interpret in terms of the underlying physics. We examine this problem via a statistical analysis of a large set of microarray experiments. We classify the probes according to their signal to noise () ratio, defined as the eccentricity of a (PM, MM) pair’s ‘trajectory’ across many experiments. Of those probes having large () only a fraction behave consistently with the commonly assumed hybridization model. Our results imply that the physics of DNA hybridization in microarrays is more complex than expected, and they suggest new ways of constructing estimators for the target RNA concentration.
pacs:
87.15.-v, 82.39.-k, 82.39.PjInterest in the detailed physics of DNA hybridization is rooted in both purely theoretical and practical reasons. Studies of the denaturing transition started with models of perfectly homogeneous DNA PB1 , soon followed by studies of sequence-specific disorder HWA ; ZHANG ; NELSON . The specificity with which DNA binds to its exact complement as opposed to a mismatched copy (a “defect”) has been studied experimentally DEFECT ; BONNET and theoretically SALERNO ; SINGH ; WATTIS . In this context it has been found that a fair fraction of the energetics of DNA hybridization is related to stacking interactions between first-neighbor bases, in addition to the obvious strand-strand contact STACK ; STACK2 . In this paper we present a study of mismatch hybridization stemming from a very practical problem, hybridization in DNA microarrays. We shall show experimental evidence that the system displays behavior which appears to be hard to account for on the basis of the extant view of hybridization specificities.
DNA microarrays provide an experimental technique for measuring thousands of individual mRNA concentrations present in a given target mixture. They are made by depositing DNA oligonucleotide sequences (probes) at specific locations on solid substrates. The probes can be either pre-made sequences as in cDNA spotted arrays, or they can be grown in situ, letter by letter, as in high-density oligonucleotide arrays GC1 . The target mRNA is amplified (into either cDNA or cRNA depending on the protocol) and the product labeled fluorecently before being hybridized onto the array. The spatial distribution of fluorescence is then measured using a laser, providing estimates for the target concentrations. In GeneChip arrays, the synthesis of probe sequences by photolithographic techniques requires a number of different masks and deposition processes per added base, making it impractical to grow more than a few dozen nucleotides. For such lengths, hybridization specificity is not expected to be high enough. To solve this conundrum, GeneChip technology is based on a two-fold approach, involving redundancy and differential signal GC1 ; GC2 ; GC3 . First, several different sequence snippets (each 25 bases long) are used to probe a single transcript; and second, each of these probes comes in two flavors. The perfect match (PM) is perfectly complementary to a portion of the target sequence whereas the single mismatch (MM) carries a substitution to the complementary base at its middle (13th) position. The rationale behind MM sequences is that they are expected to probe for non-specific hybridization in a manner that we shall detail below.
In current incarnations of the chips, each gene is probed by 14-20 (PM,MM) pairs (a probeset), and the task is therefore to reconstruct a single number (the target concentration) from these 28-40 measurements. There are conceivably many ways in which this can be done, with various degrees of noise rejection. The standard algorithm provided in the software suite AFFYSOFT offers one method. However, as independent experimental techniques for measuring mRNA concentrations (like northern blots) provided clues that the analysis process should be improved upon, many researchers attempted to do so; it was then discovered that a fair number of MM probes consistently report higher fluorescence signal than their PM counterpart US . This observation is most intriguing because it violates the standard hybridization model as outlined below. Thus, the notion that the specific binding signal alone can be obtained as a differential of the PM and MM signals appears to fail in a subset of the probes.
We shall show below that it is not a matter of a few stray probes, by carefully examining the statistics of PM-MM pairs. These statistics show that most of the probes misbehave to various degrees. Only a fraction of them, having , exhibit a flagrant violation of the basic assumptions, however, these just point most obviously at the symptoms of a deeper problem which affects all probes. Given the number of laboratories who are currently carrying out such hybridization experiments, squeezing out even a meager extra bit of signal to noise ratio from the data would be very valuable. It has become clear that this shall not happen in the absence of a better understanding of DNA hybridization to slightly mismatched templates. We shall now attempt the first step toward this goal, which is to characterize the problem.
| Chip | Dros | HG-U95A | Mu11K | U74A | YG_S98 |
|---|---|---|---|---|---|
| # pairs per PS | 14 | 16 | 20 | 16 | 16 |
| chips analyzed | 36 | 86 | 24 | 12 | 4 |
| % | 35 | 31 | 34 | 34 | 17 |
| % PS with | 95 | 91 | 95 | 92 | 73 |
| % PS with | 58 | 56 | 71 | 64 | 21 |
| % PS with | 4 | 7 | 26 | 10 | 2 |
The rationale behind the use of MM probes is contained in the standard hybridization model WONG :
Here () are the measured brightness of the PM (MM) probe, the contribution from specific complementary binding, the amount from nonspecific binding assumed to be insensitive to the substitution, and a background of physical origin, i.e. the photodetector dark current or light reflections from the scanning process. Then is the reduction of specific binding due to the single mismatch. These brightnesses are related to the quantity of interest (the RNA concentration in the sample) through:
where denotes the concentration of target RNA, the concentration of whatever mixture contributes to the nonspecific hybridization. and are probe dependent specific and nonspecific susceptibilities (possibly concentration dependent) and include effects such as the areal density of probe, various affinities, transcript length dependent effects (longer transcripts are likely to carry more fluorophors depending on the labeling technique).
While it is no secret that the physics of hybridization is way more complex than this simplistic model, one could still hope that it would essentially provide a correct picture of GeneChip hybridizations. To summarize, let us outline the basic assumptions made so far: (i) non-specific binding is identical in PM and MM, meaning that does not see the letter change; (ii) ; (iii) and identical for PM and MM; (iv) , and are reasonably uniform numbers across a probe set. Notice that (i)+(ii) imply that always (see below).
If is not used as such, the background needs to be subtracted from the intensities, which can be done in a statistically proper way as described in US .
According to the basic tenets of the standard model, it follows that for all probe pairs if the target RNA extract contains no sequences matching exactly the MM. In reality, one observes a vast number of probe pairs for which this assumption is violated; this behavior repeats consistently for a broad range of conditions. Our experience is that most people in the know think of this problem in terms of an imperfect adherence to the standard model, or a bothersome deviation from an otherwise properly behaving norm. In other words, the way this problem is usually characterized is ”there’s a number of probe pairs that don’t work and we don’t understand why”. We shall show now that this is not so: the pairs are so abundant that we like to propose the alternate view that the model is simply inadequate for describing what actually happens, and that we do not understand the basic physics of MM hybridization. Table 1 summarizes the statistics for various chip series.
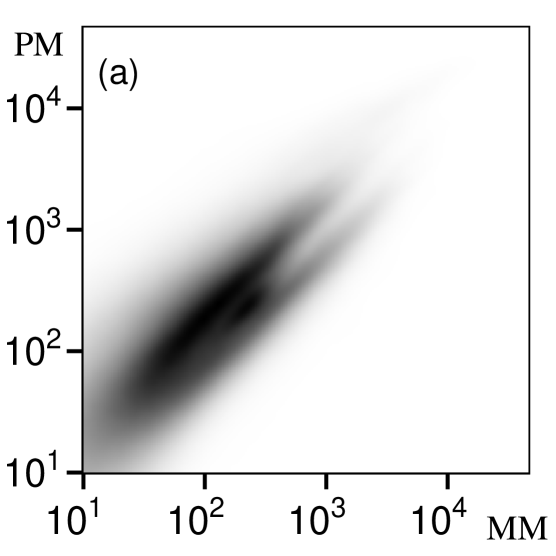
The human HG-U95A chip series, for instance, has ~ 400K probes for 12K different probesets. Across a wide variety of conditions, we have observed approximately of all probe pairs have . This figure, by itself enormous, would be easy to dismiss if most of them were in the low intensity range, where noise is expected to be relatively higher and could conceivably be bigger than , or if they were clustered in a small set of problematic probesets. Neither is true: of all probesets have at least 1 probe pair with , and still of probesets have 5 such probe pairs out of 16. In addition, the pairs are fairly distributed with respect to brightness (cf. Fig. 1).
What could conceivably be the source for observing ? A perplexing extra bit of information lies in a simple statistic, the joint probability distribution . According to the standard model,
If dominates over then , while if vanishes (as when the transcript is just not present in the sample) then .
Thus we expect
Thus, the standard model predicts that should be supported in a band, with lower limit corresponding to the diagonal when cross-hybridization dominates, and with an upper limit given by for fully specific binding. Naively one would further assume that for low brightness most of the signal comes from nonspecific binding, while most would come from specific binding for high brightness. Fig. 1 shows something quite otherwise: as brightness increases, the joint probability distribution forks into two branches. The crest of the lower one lies fully below the diagonal.
The characteristic shapes of are likely signatures of sequence-dependent effects. However, any hypothesis is impossible to verify as the probe sequences are not released to the public. Nevertheless, there are some obvious suspects. First, the nontrivial susceptibilities and mentioned above depend on the areal density of probe, which is sequence-dependent by virtue of the varying efficiencies of the lithography process. Secondly, nucleic acids need to unstack the single-stranded probes in order to form each new duplex as they hybridize. Further, stacking energies are extremely sensitive to sequence details, which might result in large energy barriers. This would translate into kinetics constants that vary exponentially (à la Arrhenius) in these energies, and lead to important consequences as the hybridization reactions are not carried to full thermodynamic equilibrium.
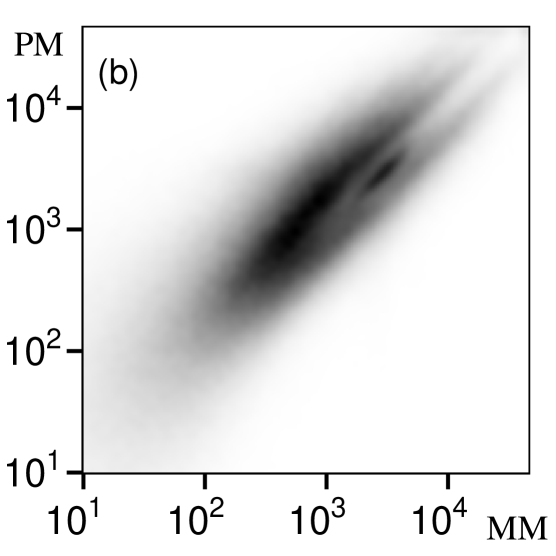
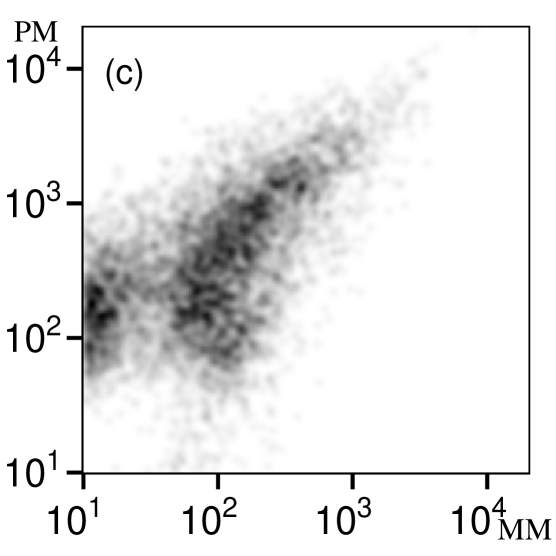
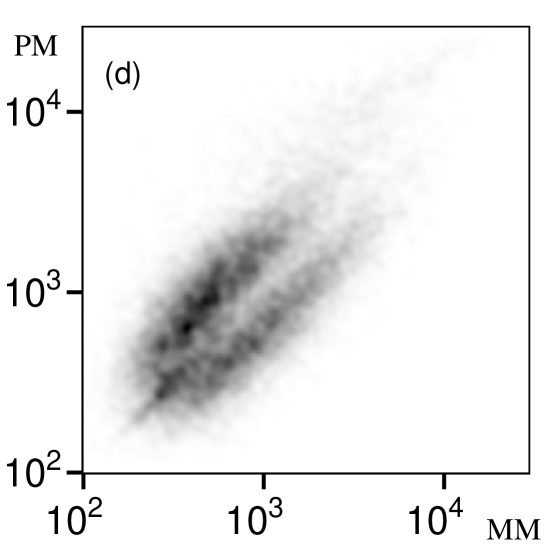
Given a set of experiments, further insight can be obtained by following a pair with across the entire dataset (after subtracting B). Ideally, these points would fall on a curve parametrizable by the mRNA concentration. In reality, however, the observed patterns range from nearly one-dimensional to almost circular clouds. To classify probes, we computed the center of mass CM and inertia tensor of the set of points . The positive eigenvalues of , define the eccentricity and largest excursion . Pairs with high eccentricities are those carrying high S/N, whereas characterizes a very noisy probe pair.
Fig. 2 illustrate the distribution of center of mass after different filtering for and . It turns out that Fig. 2a looks very similar to Fig. 1, which is not a priori evident. On the contrary, this similarity emphasizes that most probes behave in a very reproducible manner. For instance, probes lying below the diagonal at the high-intensity end do so in essentially all of the 86 experiments (leading to a CM that is also below the diagonal), instead of visiting different regions of the plot. Another striking result is that (i) selecting for eliminates most of the low-intensity probes (Fig. 2b), (ii) the remaining set contains two components: one consisting of the large probes (Fig. 2c) lying mostly in the region; and the small component forming an almost perfectly symmetric “tulip” structure (Fig. 2d), containing two forked branches plus the button described in Fig. 1.
Another troubling effect which deeply affects attempts at analysis is the very broad brightness distributions within probes belonging to the same gene. Fig. 4 shows that the probe intensities span up to four decades. Possible reasons for such behavior are again sequence specific effect similar to those discussed in the context of the MM behavior.
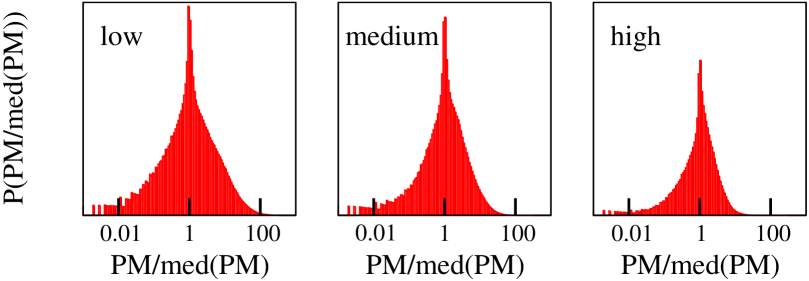
The main practical challenge is reconstructing the target mRNA concentration from the probeset data. As we showed, the variability in the hybridization properties of the probes is larger than naively anticipated, therefore, it is unlikely that a single definitive procedure will be appropriate in all cases. On the contrary, it is desirable to have several analysis tools at hand for viewing the data from different angles. For instance, as a consequence of the strongly probe dependent susceptibilities and , the differential will not consistently be a good estimator of the true signal. Given the unclear information contained in the , one alternative we studied is not considering them at all. The mRNA expression level is then obtained from a robust geometric average of the PM-B values, after a careful estimation of B US . The use of geometric averages (rather that arithmetic) is dictated by the distributions in Fig. 4. Of course, using only PM probes neglects cross-hybridization effects that would be detectable by a working MM probe, and hence tends to be less sensitive at the low-intensity end. One the other hand, it allows to rescue probesets with a high number of misbehaving MMs.
A completely different approach, closer in spirit to the model-based method WONG , would be to extend the ellipsoid of inertia idea to the the full probeset. Concretely, one would take the matrix ( is the probe and the experiment index) and do a principal component analysis to identify the modes carrying the most signal. After singular value decomposition , where and is the center of mass, the signal is given by the projection onto the largest direction of variation. A signal-to-noise measure for the entire probeset is given by . Preliminary testing of the method has lead to very promising results.
In conclusion, we showed that the hybridization of short length DNA sequences to single mismatched templates exhibits a far more diverse picture than what is usually assumed. These observations do not only point at interesting physics in the DNA hybridization process to short sequences with defects, attached to a glass surface; they also have strong consequences for designers of GeneChip analysis tools, especially when it comes to the level of noise rejection of different methods. We hope this will bolster interest in the physics of hybridization and mismatch characterization.
We’d like to thank E. van Nimwegen, E. Siggia, and S. Bekiranov for sharing interesting ideas. MM acknowledges support of the Meyer Foundation; FN is a Bristol-Myers Squibb Fellow in Basic Neurosciences and acknowledges support from the Swiss National Science Foundation.
References
- (1) M. Peyrard and A.R. Bishop, Phys. Rev. Lett. 62, 2755 (1989).
- (2) D. Cule and T. Hwa, Phys. Rev. Lett. 79 2375 (1997).
- (3) Y. Zhang, W.-M. Zheng, J.-X. Liu, and Y.Z. Chen, Phys. Rev. E 56 7100 (1997).
- (4) D. K. Lubensky and D. R. Nelson, Phys. Rev. Lett. 85, 1572 (2000).
- (5) A. Bonincontro, M. Matzeu, F. Mazzei, A. Minoprio, and F. Pedone, Biochim. Biophys. Acta 1171 288 (1993).
- (6) G. Bonnet, S. Tyagi, A. Libchaber, and F.R. Kramer, Proc. Natl. Acad. Sci. U.S.A. 96 6171 (1999).
- (7) M. Salerno, Phys. Rev. A 44 5292 (1991).
- (8) N Singh and Y. Singh, Phys. Rev. E 64 042901 (2001).
- (9) J.A.D. Wattis, S.A. Harris, C.R. Grindon and C.A. Laughton, Phys. Rev. E 63 061903 (2001).
- (10) N.L. Goddard, G. Bonnet, O. Krichevsky, and A. Libchaber, Phys. Rev. Lett.85 2400 (2000).
- (11) Z. Haijun, Z. Yang, and O.-Y. Zhong-can, Phys. Rev. Lett. 82 4560-4563 (1999).
- (12) J. Lockhart and E.A. Winzeler, Nature 405, 827-836 (2000).
- (13) M. Chee et al. Science 274, 610-14 (1996).
- (14) R.J. Lipshutz, S.P. Fodor, T.R. Gingeras, and D.J. Lockhart, Nature Genetics 21, 20-24 (1999).
- (15) Affymetrix Microarray Suite 4.0 User Guise (2000), Affymetrix, Inc., Santa Clara, CA.
- (16) F. Naef, D.A. Lim, N. Patil, and M. Magnasco, Proceedings of the DIMACS Workshop on Analysis of Gene Expression Data 2001, in press; also physics/0102010.
- (17) C. Li and W.H. Wong, Proc. Natl. Acad. Sci. USA 98, 31-36 (2001).