Modeling the effects of tetanus vaccination
on chronically infected HIV patients
L. E. Jones and A. S. Perelson
Theoretical Biology and Biophysics Group
Los Alamos National Laboratory
Los Alamos, NM 87545
Running Head: Modeling effects of vaccination
Corresponding author: Alan S. Perelson, Theoretical Biology and Biophysics, MS-K710, Los Alamos National Laboratory, Los Alamos, NM 87545, asp@lanl.gov
Requests for reprints: Alan S. Perelson, Theoretical Biology and Biophysics, MS-K710, Los Alamos National Laboratory, Los Alamos NM 87545, (505)667-6829, asp@lanl.gov
This work was performed under the auspices of the U.S. Department of Energy and was supported by NIH grants AI28433 and RR06555.
Objective: To model the effects of vaccination with a common recall antigen on chronically infected HIV-1 patients.
Background: T-cell activation plays a critical role in the initiation and propagation of HIV-1 infection and yet transient activation of the immune system is a normal response to immunization. While it is now considered wise to vaccinate HIV-1 positive patients, it is crucial to anticipate any lasting effects of vaccination on plasma HIV-1 RNA levels and on infected T cell populations.
Method: We extend a simple dynamical model of HIV infection to include T cell activation by vaccination. We show that the model can reproduce many but not all of the features of the post-tetanus immunization rise in viral load observed and reported on by Stanley et al. [N. Engl. J. Med., 334:1222–1230 (1996)].
Results and conclusions: Amplitudes and approximate timing of post immunization peak viral loads were matched in nine of eleven cases; in patients with double post immunization peaks of nearly equal amplitude the later peaks were matched. Furthermore, our simulations suggest that productively infected cell populations track post-vaccination increases in plasma viral load, rising and falling in concert on a period of about 4 weeks, while chronically infected cells peak later and remain elevated over baseline levels for up to six weeks post-vaccination.
Keywords: chronic infection, mathematical models, plasma viral load
Introduction
T-cell activation plays a critical role in HIV infection and progression to AIDS [1–4]. In vitro studies have demonstrated the importance of cell activation in establishing productive HIV infection. For example, reverse transcription within resting cells may be incomplete and integration of proviral DNA may not occur, resulting in abortive infection [5–6]. In contrast, activated peripheral blood mononuclear cells are readily infected in culture [5–7]. The course of HIV infection in vivo appears to be influenced by cell activation. High levels of activated peripheral T cells are a predictor of early progression to AIDS [8–9], and chronic immune activation due to frequent and repeated parasitic infection has been suggested as the probable cause of the increased rate of HIV progression to AIDS and the greater susceptibility to infection observed in sub-Saharan Africa as compared to the developed countries [10–12].
Transient activation of the immune system occurs during infections and is a normal response to immunization. Such activation can affect the course of HIV infection. Numerous studies have examined the consequences of vaccinating untreated HIV-infected individuals [2, 13–17]. Stanley et al. [2] found that giving a booster dose of tetanus toxoid resulted in transient increases in plasma viremia in all 13 HIV-infected subjects studied. Staprans et al. [13] found that influenza vaccination led to transient increases of plasma HIV-1 RNA, and that patients with higher CD4 T-cell counts had larger and more rapid increases in viral load. The large immunization-related increases in virus reported by Staprans et al. [13] suggest that the observed viral replication may be correlated with activation of both antigen-specific T-cells and other non-specific T-cell populations, which once activated, then become targets for infection [3].
Other studies using influenza vaccination and pneumococcal vaccine have confirmed that vaccination can trigger increases in plasma HIV RNA [14–17]. Thus a number of data sets are available that illustrate a relationship between immune system activation and changes in HIV viral load. This data presents an interesting challenge to current mathematical models of HIV infection [18–20]. In an early theoretical paper, McLean and Nowak [21] examined the effects of infection with pathogens other than HIV as a cofactor in HIV progression. However, no quantitative data was available at the time for direct comparison of model and theory. A more recent study [22] presented a model and some comparisons with averaged data for untreated patients, but concentrated primarily on antigen-driven T-cell proliferation and residual viral replication for patients on anti-retroviral therapy. Here we focus on the effects of vaccination on untreated HIV-infected patients. We construct a simple model of HIV-infection and immune system activation via vaccination, and then compare the model with data from the study of Stanley et al. [2] in which 13 HIV seropositive, asymptomatic individuals were vaccinated with tetanus toxoid.
A simple vaccination model
To understand the effects of vaccination with a common recall antigen (tetanus toxoid) on chronically infected, untreated HIV patients whose viral loads have reached steady state, we modify what has become a standard HIV infection model [18-19]. The model includes uninfected, infected and chronically infected T-cell populations, HIV and other antigens . We assume that the vaccine–introduced antigens, , activate CD4+ T-cells. For simplicity, the model ignores latently infected cells, which in untreated individuals are an extremely minor source of virus; Chun and Siliciano [23] estimate that only 1 in T cells are latently infected. We also do not separately consider vaccine-specific or HIV specific T-cell populations, since this leads to a model with more parameters than the data reported by Stanley et al. [2] will support.
The model, like that of McLean and Nowak [21], includes vaccine antigen , which we assume is eliminated from the body at a rate proportional to both the antigen concentration and the CD4+ T cell density. The rate of proportionality implicitly includes a factor that accounts for the fact that only a fraction of T cells are antigen specific and accounts for complexities of the antigen specific, helper cell dependent response that leads to antigen elimination.
Since individuals would be expected to vary with regard to the time of their last tetanus vaccination, one might assume that levels of antibody and T memory cells specific for tetanus toxoid would also vary. In our model we avoid this level of detail, but simply assume that the antigen clearance rate constant, , and parameters that determine the rate of T cell activation vary for each patient.
The model we use is given by the following system of differential equations:
| (1) | |||||
| (2) | |||||
| (3) | |||||
| (4) | |||||
| (5) |
where is the vaccine antigen, are uninfected CD4+ T cells, are productively infected cells, are chronically infected cells, and represents HIV. Vaccine antigen is cleared in a T cell-dependent manner with rate constant . Uninfected T cells, , are produced at a rate , die at a rate , and are infected by virus with rate constant . In the presence of antigen, we assume T cells are activated into proliferation at a maximum rate , and that the proliferation rate depends on the antigen concentration with a half-saturation constant . is thus the antigen concentration that drives T cell proliferation to half its maximal value. Productively infected cells, , are generated by infection of target T-cells, , at a rate , and die at rate , as in the standard model [18]. Chronically infected T-cells, , are produced from susceptible T-cells at a rate , where . Thus, the production of chronically infected cells occurs at a fraction of the rate productively infected cells are generated. Chronically infected cells die at a rate , which we assume is less than , so that chronically infected cells are longer-lived than productively infected cells. Free virus, , is produced by productively infected cells at average rate , by chronically infected cells at rate , and is cleared at rate per virion. Based on previous work we assumed [24]; [25]; [18]; [24]; [19]; [24], and [22, 26]. Prior to vaccination, each patient was assumed to be in steady state with a known total baseline T cell count, , and viral load, .
Given these measurements and the steady-state conditions derived from equations (1) – (5) (see Appendix), initial numbers of infected cells can be derived as well as a set of parameters describing chronic HIV infection for each patient.
At time , we assume a dose of antigen, , was given in a vaccine, which perturbed the steady state. We assume the same dose of vaccine was given to all individuals, and then model the antigen remaining in each individual as a fraction of the immunizing dose. This is equivalent to setting . We numerically solve the system of differential equations given by (1) - (5), with the initial conditions , and , , , and set to their steady state values. For each individual studied, the parameters , and were allowed to vary so that the amplitude and timing of the response could be best matched to the observed post-vaccination viremia.
Data and sampling
Stanley et al. [2] studied 16 asymptomatic homosexual men seropositive for HIV-1. Thirteen subjects were given an 0.5 ml tetanus booster intramuscularly and three were mock immunized. After vaccination, viral load measurements were taken on days 0 (baseline), 4, 7, 14, 21, 28 and 42. No information on prior vaccination history, i.e., date of last tetanus booster, or general quality of health was given. It was noted that one patient developed cavitary pneumonia about a month following vaccination.
Of the thirteen patients reported on by Stanley et al. [2], we did not include patients 12 and 13 in our study. Published data for patient 12 had inconsistencies, and patient 13 had a T-cell count, , of 8 cells per , which is too low to be consistent with our parameter assumptions and the pre-vaccination steady state assumption of our model (see Appendix). Thus either the patient was not at true steady state, or the parameter values chosen from the literature are not applicable to this patient. The baseline characteristics for the remaining eleven patients are given in Table 1.
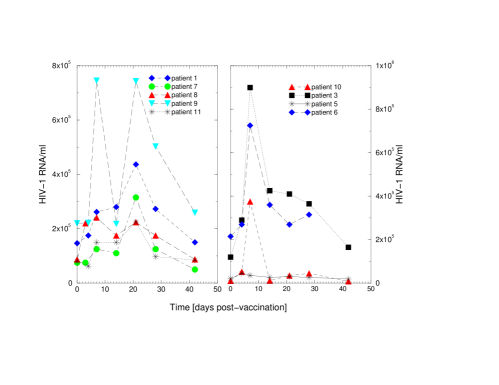
Data obtained for a subset of the patients are shown in Figures 1a and 1b. The data sampling was too sparse to determine the exact peak of viremia or the time the peak was attained. However, Stanley et al.[2] report the apparent peak and the time it was measured. Many patients had two post-immunization peaks in viral load. The larger peak was the earlier of the two observed peaks in patients 3, 5, 10, and the second of two peaks in patients 1, 4, 7, and 11. Patients 2, 8, and 9 had two peaks of nearly equal amplitude (Figure 1a).
Of the patients with double post-immunization peaks in viremia, patients 1, 7, 8, 9 and 11 had peaks at days 7 and 21 (Figure 1a), though in some of these cases the earlier peak can be classified as a minor peak or an inflection point. Of those with single observed post-immunization peaks, patients 3, 5, and 10 have primary peaks at day 7, and inflection points, shoulders, or minor peaks at day 28 (Figure 1b).
Table 1. Baseline characteristics and post-immunization plasma viremia
| Patient | T cells, | ||||||
|---|---|---|---|---|---|---|---|
| cells/ | cells/ | cells/ | cells/ | RNA/ml | RNA/ml | ||
| 1. | 362 | 336 | 7.6 | 18.5 | 147,000 | 437,000 (21/20) | 2.97 |
| 2. | 271 | 241 | 8.7 | 21.1 | 3,850 | 10,500 (14,28/14) | 2.73 |
| 3. | 350 | 323 | 7.8 | 18.8 | 120,000 | 900,000 (7/8) | 7.50 |
| 4. | 389 | 364 | 7.3 | 17.7 | 100,000 | 700,000 (3,21/18) | 7.00 |
| 5. | 586 | 569 | 4.9 | 12.0 | 21,000 | 45,000 (3,21/19) | 2.14 |
| 6. | 336 | 309 | 7.9 | 19.3 | 215,000 | 725,000 (7/9) | 3.37 |
| 7. | 336 | 309 | 7.9 | 19.3 | 75,000 | 315,000 (7,21/18) | 4.20 |
| 8. | 361 | 335 | 7.6 | 18.5 | 87,500 | 241,000 (7,21/19) | 2.75 |
| 9. | 497 | 476 | 6.0 | 14.6 | 220,000 | 745,000 (7,21/23) | 3.38 |
| 10. | 615 | 599 | 4.6 | 11.1 | 10,500 | 375,000 (7/7) | 35.7 |
| 11. | 363 | 337 | 7.6 | 18.5 | 80,000 | 225,000 (7,21/18) | 2.81 |
baseline viral load, peak viremia
First number(s) are observed time(s); second number, modeled time to peak viremia (d).
Results
For each of the eleven patients studied, the model was fit to the data on viral load changes after vaccination. Using nonlinear regression techniques, the best-fit set of parameters were then determined for each patient (Table 2).
The amplitude and the approximate timing of the post-immunization maximum viremia were matched in nine of eleven cases; in patients with double peaks of nearly equal amplitude (i.e., patients 8, 9), the later peaks were matched. The results are summarized in Tables 1 and 2.
Early peaks in post-vaccination plasma viral load
Patients with relatively high baseline CD4 T-cell counts (patients 5, 9, 10), as well as those with high baseline viremia (patients 6, 9) all had early peak viremia, at either 3 days (patient 5) or 7 days (patients 6, 9, 10) post-immunization. This is reasonable since patients with a high baseline T-cell count or high viral load would be expected to have a larger population of target cells that could respond post-immunization. Thus, a vigorous early response by the immune system ensures an early peak in viremia.
The “viremia factor”, or ratio of peak viremia to baseline viremia, given as in Table 1, was generally rather low for most patients, ranging between 2 and 4 (mean = 2.92) for nine of twelve patients. Three remaining patients with unusually high “viremia factor” ratios, patients 3 (), 4 () and 10 () also had early peaks, though in patient 4 this was a minor inflection followed by peak viremia at 21 days, whereas both patients 3 and 10 had single early peaks.
Table 2. Best-fit parameter values for modeling post-immunization plasma viremia
| Patient No. | |||||
|---|---|---|---|---|---|
| 1. | 356 | 3.66 | 187.1 | ||
| 2. | 7 | 1.8 | 41.1 | ||
| 3. | 285 | 1.60 | 3.36 | ||
| 4. | 253 | 1.02 | 31.3 | ||
| 5. | 78 | 0.78 | 3.68 | ||
| 6. | 501 | 2.49 | 2.20 | ||
| 7. | 174 | 3.63 | 169.0 | ||
| 8. | 211 | 2.00 | 95.2 | ||
| 9. | 678 | 1.96 | 115.2 | ||
| 10. | 41 | 1.75 | 0.39 | ||
| 11. | 194 | 1.91 | 86.3 |
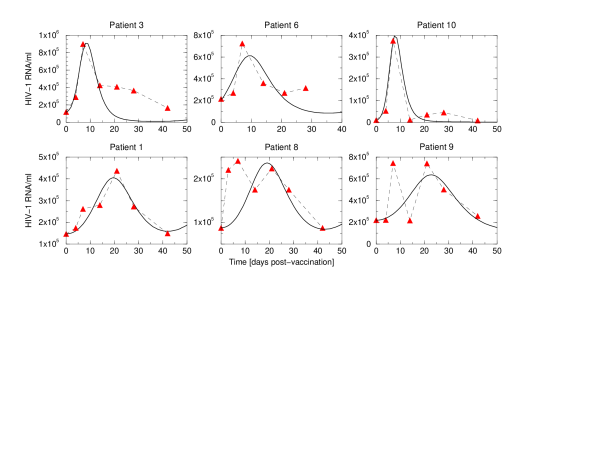
We were able to match well the amplitude and timing of peak viremia for patients 3, 6, and 10 (Figure 2), all of whom had early peaks in viremia and were best-fit with relatively high antigen clearance rate constants, , in our simulations (Table 2).
Double peaks in post-vaccination plasma viral load
Over half of the patients studied had multiple peaks in viremia, though often the first peak might be classified as ‘minor’. For patients with a minor early peak, usually at day 7, followed by a maximum in viral load at day 21, we were able to fit the amplitude and timing of the maximum peak. Patients 1, 4, 7, and 11 exemplify this behavior; results for patient 1 are shown in Figure 2. These patients were best-fit with values that were low relative to those given for patients with true early peaks in viremia (Table 2). Patient 5 had very early viremia [day 4] followed by a second peak at day 21. We were able to model the second peak, and from this obtained a relatively high antigen clearance constant.
Some patients experienced early and late peaks in viremia of equal or nearly equal amplitude. Of the patients with double peaks in viremia, our model generally fit the later peak at day 21. These patients were assigned much lower clearance rates then were the patients who experienced single early peaks in viremia. However, in patients with double peaks (e.g., patients 8 and 9, Figure 2) fits to the earlier peaks, unobtainable with this model, might require higher values of .
T-cell - Antigen Interactions
The rate of antigen induced T-cell activation/proliferation is given in the model by [equations 2 and 7]. Recall that the antigen concentration has been normalized, so that and . Thus, the initial rate of interaction, which is the highest rate since the antigen has not yet decayed, is given by For patients 1, 2, 4, 7, 8, 9, and 11, (Table 2). Thus, the denominator in the T cell activation term is approximately equal to , and the initial activation/proliferation rate is .
Substituting in and values (Table 2) for these patients yields initial values ranging from 0.017 d-1 to 0.043 d-1 (mean value sample standard deviation d-1) with most values clustered around 0.02 d-1. These patients all had low values for the T-cell activation/proliferation term, and late peaks (day 21) in observed and modeled viremia.
Higher initial values of the activation term would increase the interaction between T-cells and antigen A, resulting in swifter activation of T-cells and an earlier increase in virus. For patients 3, 5, 6, and 10, and were the same order of magnitude or within one order of magnitude in value, and the approximation for the interaction term shown above does not hold. In this case, the initial interaction term for these patients ranged from d-1 to d-1 (mean value ), which is between one and two orders of magnitude greater than the interaction terms found for the prior group of ‘late peaking’ patients. Patients 3, 6, and 10 all had early viremia, and relatively high values for the antigen clearance term . Note that patient 5 also had an early peak in observed viremia at day 4 that we could not fit with this model. Patient 5 had a second peak in viral load which we could fit, obtaining both a high initial interaction rate and a high antigen clearance rate. In patients 5 and 10, the large interaction term and antigen clearance rates may reflect relatively high baseline T-cell levels.
The parameter in our model represents the maximum rate of antigen–driven T-cell proliferation. From Table 2, the mean sample standard deviation of . For a cell population dividing at rate , (days) is the average division time. Using the parameter estimates from Table 2, one can compute the mean of , and find that the mean value of average division times is (days) or (hours).
Productively and Chronically infected cells
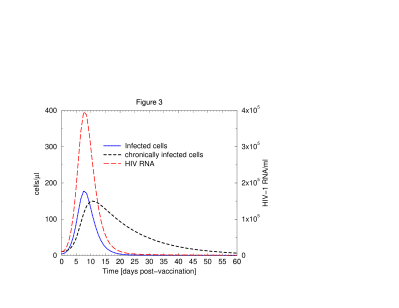
Of concern for HIV-infected patients are any potentially long-lasting effects, aside from protective immunity to the vaccine antigen, associated with immunization. According to our model, the density of productively infected cells, , tracks changes in viral load, peaking and falling at the same time. The effects of vaccination on longer lived chronically infected cells, , however, are more lingering. According to our model, the ratio of maximum chronically infected cell level over baseline for all but one patient ranged from 1.6 to 3.6, with a mean of , and the one outlier value of a 13–fold increase in chronically infected cells [patient 10]. At 28 days post immunization, our simulations show these long-lived cells still elevated with respect to their initial (steady state) values, yielding increases of 1.4 to 3.0 over baseline, with a mean of , disregarding the outlier value which is still high at 4.3 above baseline. At 42 days post immunization, chronically infected cells are still a factor of on average above baseline, again disregarding the outlier value of 1.9 above baseline. Indeed, focusing only on late-peaking patients, for whom infected and chronically infected cells are later to reach maximum, yields ratios of at maximum, at 28 days, and at 42 days. By contrast, at 42 days post immunization, productively infected cells for both patient populations have achieved or fallen below their baseline values. Modeled infected cell densities from patient 10 are shown plotted against plasma viral load (Figure 3); note that chronically infected cells remain elevated long after infected cell populations have fallen to baseline values even in this early peaking patient. Thus while vaccination gives rise to short-term changes in viral load and productively infected cells, it may also produce longer lasting increases in the populations of chronically infected cells.
Discussion
With a simple modification of a standard HIV-infection model that takes into account antigen-driven proliferation of T cells, we are able to reproduce the general features of the post-vaccination rise in viral load reported on by Stanley et al. [2]. This implies that simply increasing the number of cells susceptible to infection by antigen activation, i.e., vaccination, can account for the modest rises in viral load observed by Stanley et al. [2] after tetanus booster vaccination. Interestingly, more than half of the patients in this study had double peaks in plasma HIV-1 RNA post-vaccination. While assay variability might account for some of these peaks, in other cases the peaks were sufficiently large that this seems unlikely. For patients with double peaks we were only able to fit the later of the two peaks, which was often the larger peak. These patients were assigned lower pathogen clearance rate constants, , than patients with early single peaks in viremia, which we also successfully modeled.
The fact that we could not approximate the earlier peaks in those patients with double peaks in viremia suggests that our model may lack some features present in the actual biology. For example, individuals vaccinated recently may have a larger and more robust memory cell response than individuals vaccinated a long time in the past. The two peaks may represent an early memory response followed by a naive cell response. In individuals with little remaining memory, one may speculate that only the later naive response would be observed. However, since the two peaks frequently occur 14 days apart, this explanation would require a substantial difference in the time to activate naive and memory cell responses. Another possible explanation for double peaks is that the first peak is due to stimulation and infection of tetanus specific T cells, whereas the second peak is caused by the rise in viremia stimulating HIV specific T cells, or increasing the level of immune system activation, which in turn leads to an increase in target cell availability. We do not favor this explanation because our model, which follows the activation of T cells by antigen, had difficulty mimicking the fast rise in viremia needed to explain an early peak. One can speculate then that the early peak is not due to the infection of vaccine-induced target cells, but rather to an effect such as the cytokine-induced enhancement of HIV transcription and release from infected cells as has been seen in vitro with the use of tumor necrosis factor- [5].
Despite the fact that the model failed to reproduce double peaks in viral load, the model could account for the timing and amplitude of the major peak in post-vaccination plasma viremia. Because HIV-1, as observed in plasma, is produced by infected cells, the model suggests that levels of both productively infected and chronically infected cells also increase due to vaccination. Levels of latently infected cells presumably also increase, but in untreated individuals this population makes a minor contribution to plasma viral load. According to the model the increase in productively infected cells mirrored the observed changes in plasma viral load, and due to the short lifespan of these cells led to little long-term perturbation of this population. However, chronically infected cells have longer lifetimes and hence vaccination led to a larger period of increase in this population. Nevertheless, in all but one patient the increase was not large, with the maximum increase being 3.6–fold, and in the most extreme case studied here, the increase was 13–fold. However, by day 42 the chronically infected cell elevations were less than 2-fold in all patients. This, coupled with the fact that chronically infected cells generally produce only 1-7% of plasma virus [19], implies that the long-term impact of this change on disease progression should be small.
Acknowledgements
We thank Rob J. DeBoer for helpful discussions.
Appendix
The steady state productively infected and chronically infected cell concentrations, , and , the infection rate constant, , and burst size, , may be calculated from the following steady state equations, derived by setting the left-hand sides of equations (2)-(5) to zero.
| (6) | |||||
| (7) | |||||
| (8) | |||||
| (9) |
In addition, we impose the following conservation rule:
| (10) |
where is the observed (total) T-cell count, comprising uninfected cells , productively infected cells , and chronically infected cells . From the above condition and equations (7) and (8), we derive the following relation for :
| (11) |
Parameters other than and were set as indicated in the text. Note that with these parameter choices, and the measured baseline T cell and viral load levels in the patients studied by Stanley et al. [2] this model generally yields larger steady state levels of chronically infected cells than of productively infected cells in these untreated patients (Table 2).
Note that according to equation (11), the T cell count at steady state has to be larger than a minimal value for the numerator of equation (11) to be positive. For patient 13, with a T cell count of 8 cells per , this condition is violated due to our choice of fixed parameters that were originally chosen from published data related to less advanced patients.
References
- [1] Fauci A. S.: Multifactorial nature of human immunodeficiency virus disease: implications for therapy. Science 1993, 262:1011–1018.
- [2] Stanley S. K., Ostrowski M. A., Justement J. S., et al.: Effect of immunization with a common recall antigen on viral expression in patients infected with human immunodeficiency virus type 1. N. Engl. J. Med. 1996, 334:1222–1230.
- [3] Wahl S. M., Orenstein J. M.: Immune stimulation and HIV-1 replication. J. Leukocyte Biol. 1997, 62:67–71.
- [4] Lawn S. D., Butera S. T., Folks T. M.: Contribution of immune activation to the pathogenesis and transmission of human immunodeficiency virus type 1 infection. Clin. Microbiol. Rev. 2001, 14:753-777.
- [5] Zack J. A., Arrigo S., Weitsman S. R., Go A. S., Haislip A., Chen I. S. Y.: HIV-1 entry into quiescent primary lymphocytes: molecular analysis reveals a labile, latent viral structure. Cell 1990, 61:213-222.
- [6] Bukrinsky M. I., Stanwick T. L., Demspey M. P., Stevenson M.: Quiescent T lymphocytes as an inducible virus reservoir in HIV-1 infection. Science 1991, 254: 423–427.
- [7] Folks T., Kelly J., Benn S., et al.: Susceptibility of normal human lymphocytes to infection with HTLV-III/LAV. J. Immunol. 1986, 136: 4049-4053.
- [8] Levacher M., Tallet S., Dazza M., Dournon E., Rouveix B., Pocidalo J. J.: T cell activation marker evaluation in ARC patients treated with AZT: comparison with CD4+ lymphocyte count in non-progressors and progressors towards AIDS. Clin. Exp. Immunol. 1990, 81: 177-182.
- [9] Giorgi J. V. and Detels R.: T-cell subset alterations in HIV-infected homosexual men: NIAID multicenter AIDS cohort study. Clin. Immunol. Immunopathol. 1989, 52:10–18.
- [10] Medley G. F., Anderson R. M., Cox D. R., Billard I. L.: Incubation period of AIDS in patients infected via blood transfusion. Nature 1987, 328:719–721, 1987.
- [11] Bentwich Z., Kalkinovich A., Weisman, Z.: Immune activation is a dominant factor in the pathogenesis of African AIDS. Immunol. Today 1995, 16: 187–191.
- [12] Weissman D., Barker T. D., Fauci A. S.: The efficiency of acute infection of CD4+ T cells is markedly enhanced in the setting of antigen-specific immune activation. J. Exp. Med. 1996, 183:687–692.
- [13] Staprans S. I., Hamilton B. L., Follansbee S. E., Elbeik T., Barbosa P., Grant R. M., Feinberg M. B.: Activation of virus replication after vaccination of HIV-1-infected individuals. J. Exp. Med. 1995, 182: 1727-1737.
- [14] O’Brien W. A., Grovit-Ferbas K., Namazi A., et al.: Human immunodeficiency virus type 1 replication can be increased in peripheral blood of seropositive patients after influenza vaccination. Blood 1995, 86:1082–1089.
- [15] Brichacek B., Swindells S., Janoff E. N., Pirruccelo S., Stevenson M.: Increased plasma human immunodeficiency virus type 1 burden following antigenic challenge with pneumococcal vaccine. J. Infect. Dis. 1996, 174: 1191-1199.
- [16] Glesby M. J., Hoover D. R., Farzadegan H., Margolick J. B., Saah A. J.: The effects of influenza vaccination on human immunodeficiency virus type 1 load: a randomized, double-blind, placebo-controlled study. J. Infect. Dis. 1996, 174: 1332–1226.
- [17] Rosok B., Voltersvik P., Bjerknes R., Axelsson M., Haaheim L. R., Asjo B.: Dynamics of HIV-1 replication following influenza vaccination of HIV+ individuals. Clin. Exp. Immunol. 1996, 104:203–7.
- [18] Perelson A. S., Essunger P., Cao Y., et al.: Decay characteristics of HIV-1 infected compartments during combination therapy. Nature, 1997 387:188-191.
- [19] Perelson A. S., Neumann A. U., Markowitz M., Leonard J. M., Ho D. D.: HIV-1 Dynamics in vivo: virion clearance rate, infected cell life-span, and viral generation time. Science 1996, 271:1582-6.
- [20] Nowak M. A., May R. M.: The basic model of virus dynamics. In: Virus Dynamics: Mathematical Principles of Immunology and Virology. New York: Oxford University Press, 2000:16–26.
- [21] McLean A. R., Nowak M. A.: Models of interactions between HIV and other pathogens. J. Theor. Biol. 1992, 155:69-102.
- [22] Ferguson N. M., deWolf F., Ghani A. C., et al.: Antigen-driven CD4+ T-cell and HIV-1 dynamics: residual viral replication under highly active antiretroviral therapy. Proc Natl Acad Sci USA 1999, 96:15167–72.
- [23] Chun T.-W., Carruth L., Finzi D., et al.: Quantification of latent tissue reservoirs and total body viral load in HIV-1 infection. Nature 1997, 387:183–187.
- [24] Callaway D., Perelson A. S.: HIV-1 infection and low steady-state viral loads. Bull. Math. Biol., in press, October 2001.
- [25] Mohri H., Bonhoeffer S., Monard S., Perelson A. S., Ho D. D.: Rapid turnover of T-lymphocytes in SIV-infected rhesus macaques. Science 1988, 279: 1223-7.
- [26] Mittler J. E., Markowitz M., Ho D. D., Perelson A. S.: Improved estimates for HIV-1 clearance rate and intracellular delay. AIDS 1999, 13:1415–7.