A single hollow beam optical trap for cold atoms
Abstract
We present an optical trap for atoms that we have developed for precision spectroscopy measurements. Cold atoms are captured in a dark region of space inside a blue-detuned hollow laser beam formed by an axicon. We analyze the light potential in a ray optics picture and experimentally demonstrate trapping of laser-cooled metastable xenon atoms.
1 Introduction
Precision spectroscopy and experiments to test discrete fundamental symmetries in atomic systems, such as Parity or Time, benefit from long coherence times and perturbation-free environments. Blue-detuned optical dipole traps, in which atoms are confined to minima of the light field, may meet both of these requirements: Trapping insures long interrogation times of the atoms, while the low light level, or sometimes the absence of light in the trapping region reduces perturbations from the trap itself.
There are several realizations of such blue-detuned optical traps in the literature, and the geometrical and optical arrangements vary considerably. The first traps of this kind used multiple laser beams to provide a closed trapping volume for the atoms. Sodium atoms were captured in between sheets of laser light [1], cesium atoms were stored in a trap that uses gravity and a combination of an evanescent wave and a hollow beam [2], and rubidium atoms were trapped inside a doughnut beam closed by additional laser beams along the direction of propagation [3]. More recently, three far off resonant traps for cold atoms that use a single laser beam were demonstrated experimentally. In one case the dark trapping region was achieved by use of a phase plate that introduces a phase difference of between the central and outer part of the laser beam [4]. In the other two experiments a rotating focused Gaussian beam produced the confining potential that enclosed a light-free volume [5, 6].
We present in this article a new single beam optical dipole trap [7], which we have developed for possible use in a measurement of parity non-conservation (PNC) in francium [8]. The cold atoms are trapped inside a hollow beam which is obtained by placing an axicon or conical lens into the path of the laser light that forms the “axicon trap”. Because in PNC experiments the signals are generally rather small, we are interested in a large trapping volume. In the case of the axicon trap the dark volume can be as large as mm3 and we have trapped up to one million atoms in it.
This paper is organized as follows. We first discuss the formation of the region of darkness using ray optics (section II). Predictions are compared to measurements of the intensity at different positions along the optical axis. In section III we present the experimental implementation of the axicon trap using a sample of precooled metastable xenon atoms. Finally, we comment on conditions and usage of the axicon trap for PNC experiments in francium.
2 Ray optics of the axicon trap
In a far-off-resonance blue-detuned optical dipole trap the atoms experience a confining potential and may spend most of their time in the dark, provided the trap is designed appropriately. The simplest implementation of such a trap uses a single hollow laser beam. The atoms are captured in a region of darkness that is completely surrounded by light. We realize this confining “black-box” by means of an axicon. The use of axicons in atom manipulation is well established [2, 9, 10], as they are a way to produce hollow beams of light.
Axicons, originally proposed by McLeod [11], have also been studied for imaging systems, and to produce Bessel beams [12, 13, 14, 15]. In contrast to an ordinary lens which has a spherical surface, the axicon has a conical surface. For an apex angle of and an index of refraction , all incident rays are deviated by the same angle . Fig. 1 illustrates the path of a diverging light beam through an axicon lens. The incident beam is split into two beams of opposite inclinations.
We use the optical setup shown in Fig. 2 in order to produce a region of darkness enclosed by light. It employs two spherical lenses and of focal lengths and respectively, in addition to the axicon . The two lenses are placed at a distance before and behind the axicon. We denote the radius of the light beam that enters the setup at lens .
When a parallel light beam enters the setup a region of darkness forms beyond the second lens. A simple ray optics diagram (Fig. 3) illustrates the formation of this region in which no rays cross. The conical lens focuses incident diverging light into a circle, rather than a spot as would be the case for a spherical lens. The distance from the second lens at which the circle of foci forms, in the paraxial and thin lens approximation is given by:
| (1) |
The position of the focal plane of the setup, at , is independent of the presence of the axicon.
Ray tracing allows us to determine which rays cross in order to form the cusps that appear at the closer () and distant () boundaries of the dark region. Rays originating from the outer edge of the incident parallel beam cross at , whereas incident rays very close to the optical axis (when ) form the cusp at . With this in mind, we find the positions of the cusps (measured from the lens , provided that ):
| (2) |
and
| (3) |
In order to calculate the total volume of the dark region we need to determine the radius of the circle of foci. Again, using only geometric optics we find that the largest transverse size of the dark region (at ) is given by:
| (4) |
This equation shows that the size of the circle of foci depends directly on the deflection angle and thus the angle of the axicon.
The ray optics calculations can predict the shape and the location of the dark region in space, but cannot give any information about the size of the beam at the focal plane, or more precisely, the width of the ring of foci . We can, however, determine the divergence angle of the beam at the circle of foci. It equals half the divergence angle of the beam that would be focused at in absence of the axicon lens. In the large distance limit of Gaussian optics the waist at the focus is inversely proportional to the divergence angle. Therefore , where designates the waist of the beam formed without the axicon. This result agrees with calculations of Refs. [13, 14, 15].
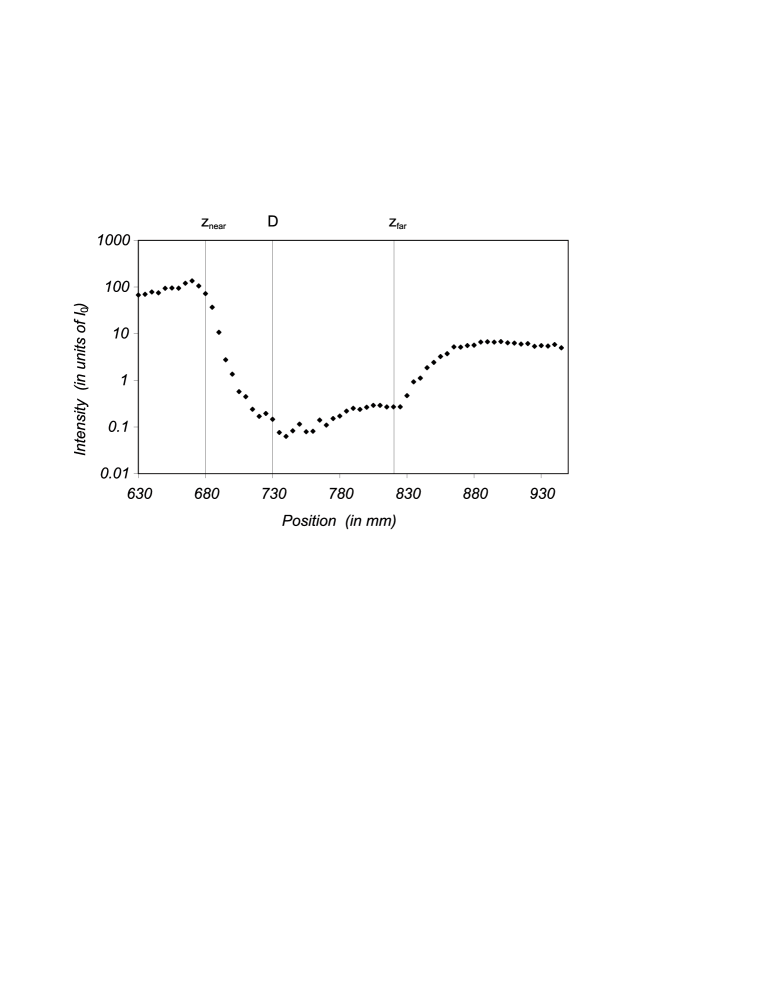
We measured the intensity profile of the laser beam shaped by the optical setup of Fig. 2 by using a charged coupled device (CCD) camera with 16 bit resolution. The parameters used in the experiment are: mm, mm, mm, mm. In an independent measurement we determined mrad, which leads to mrad. The trap region is an elongated diamond of revolution with a diameter of roughly 1.5 mm and 150 mm of length. The measured intensity distributions in the radial direction, at the location of the circle of foci (), and along the optical axis are shown in figures 4 and 5, respectively. The recorded intensities are normalized to , the intensity at lens . The location of the circle of foci mm agrees with the theoretical calculation from Eq. (1) of mm. The measured distance between the two maxima, mm, is in accord with the prediction of the diameter of the circle of foci mm (eq. (4)).
In Fig. 5 the calculated locations of the cusp positions mm and mm are indicated. Because in the vicinity of these points the intensity does not increase sharply, it is difficult to clearly identify and in the measured intensity distribution. Diffraction smoothes the onset of the intensity maxima and imperfections of the axicon lens can further deteriorate the dark region. Because the axicon is not a perfect cone, and in particular when it has a slightly flattened apex, light may pass directly on axis. By approximating the trapping volume with two cones that share a base we infer a volume of mm3 in which atoms may be captured.
The optical potential seen by the trapped atoms is directly proportional to the light intensity [17], for large detuning from the optical transition. Figure 6 shows a three dimensional rendition of the axial and radial intensities in the neighborhood of the dark region. We calculate the intensities by finding the number of rays that cross in any given area. The potential of the axicon trap is similar to the potential produced when using a phase plate [4, 16] or a hologram [18]. In all setups, the height of the potential well forming the trap is non-uniform. The depth of the trap is determined by the location with the smallest potential barrier which occurs slightly off axis in all cases. In the axicon trap, the points of lowest intensity barrier are close to and have an intensity of , where is the intensity at lens . These points form a ring of escape avenues for atoms from the trap. The point of highest intensity is located at , where almost all intensity is concentrated and not at , where the intensity is distributed in a ring of diameter and width . These features render the axicon trap very attractive when combined with gravity, i.e. when the laser beam propagates upwards. However, in this work for technical reasons related to the geometry of the vacuum chamber, the trap is formed using a light beam that propagates horizontally.
3 Experimental implementation
In the laboratory we realized the axicon trap using laser-cooled metastable xenon atoms. The choice of the atom was arbitrary, simply that xenon was available for this work. In xenon the optical dipole transition at nm from the metastable state to the state is used for laser cooling. The lifetime of the lower state is s, and is much longer than the typical time scale of about s for each individual experiment. The apparatus, as well as the slowing and trapping sequence have been described in detail in Ref. [19]. The infrared laser light for all cooling and trapping is provided by Ti:sapphire lasers. Briefly, we collect a few million atoms in the magneto-optical trap which has an rms radius of m. Cooling by optical molasses further reduces the temperature of the atoms to about K. We record the number of atoms and their arrival times onto a microchannel plate detector located about cm below the interaction region. In all experiments the time origin is established by extinction of the light forming the optical molasses. The atoms reach the detector after about ms of free flight. The spread in arrival times reflects the spread in velocities of the atoms and can be related to their temperature.
We load cold atoms from the magneto-optical trap into the co-located axicon trap to test it. Light for this trap comes from a second Ti:sapphire laser and is detuned above resonance by about from the cooling transition, where MHz is the natural linewidth of the upper level. The optical power in the beam is typically between mW and the size of the beam at lens is approximately mm in diameter. In the time sequence of the experiment we switch off the near resonant laser light of the optical molasses and simultaneously turn on the far detuned light of the axicon trap. The results for different durations during which the axicon beam is turned on are shown in Fig. 7. The first time of flight signal shown is a reference signal (a): all atoms are released from the optical molasses without being loaded into the axicon trap. All other signals correspond to situations in which the axicon trap was kept on for variable trapping durations . A second peak, displaced in arrival time by from the reference peak, appears in the signal and represents atoms held in the axicon trap. Atoms that were lost in the transfer form a peak centered around ms, the ballistic time of flight.
To ensure an efficient loading of the axicon trap, care is taken to spatially overlap the dark region in the laser beam forming the axicon trap with the magneto-optical trap. We achieved transfers of up to % of the atoms from the magneto-optical trap into the axicon trap. It is difficult to precisely determine the fraction of atoms captured by the axicon trap. When ms the two peaks in the time of flight signal partly overlap, whereas at larger values of loss of atoms from the axicon trap starts to become important.
We vary the duration of time during which atoms are held in the axicon trap to determine the lifetime of the trap. The result of a series of such measurements is shown in Fig. 8. After about ms half of the initially trapped atoms are still in the trap. This characteristic time strongly depends on the detuning and the total intensity of the laser forming the trap. In order to study how the lifetime of the trap is affected by the detuning we performed a measurement in which we vary the spontaneous scattering rate (), but keep the height of the potential barrier experienced by the atoms() constant. The lifetime of the trap increases with the detuning, consistent with heating due to spontaneous emission.
We have estimated the number of spontaneous emission events as an atom with an energy corresponding to 10 K climbs the potential barrier in various locations inside the trap. The recoil energy for a Xe* atom per scatter is 0.186 K. For atoms at 10K, the effect of gravity on the energy of the atoms cannot be neglected. The ramp which gravity superimposes onto the light potential has a slope of mK/cm. An atom released on axis at z=D falls mm hitting the focal ring in ms with a maximum horizontal excursion of mm while gaining K in kinetic energy. During the fall the atom remains primarily in the dark region of the trap and scatters about 160 photons per second (70 mW power, 11.7 GHz detuning). The atom, which now has a kinetic energy of somewhat below K, is repelled by a potential wall of nearly K. Atoms released within an interval of 12 mm, roughly centered at are repelled by a potential wall of at least K. Outside this range, the atoms can gain enough kinetic energy as they fall down to jump the potential wall. This confining region is of the total trapping volume. This emphasizes the importance of a careful overlap between the region in space where the magneto-optical trap is formed and the location of the bright ring of the axicon trap.
At this point we can say that our results are consistent with losses due to gravity and the effect of heating due to spontaneous scattering [17] and we can not exclude losses due to light assisted collisions [20]. The effective volume of the trapping region may be increased by overlapping the confining regions of two such axicon traps (orthogonal optical axes) or by directing the optical axis of a single trap vertically.
4 Conclusions
We have demonstrated a new optical arrangement to generate regions of darkness that we have used to trap laser cooled xenon atoms. We created this dark volume by placing an axicon lens in the path of a single laser beam tuned below the atomic resonance. Geometric optics allows quantitative understanding of the shape and size of the trapping potential. The dark volume can be as large as mm3 and we have trapped up to one million atoms in it.
Due to its simplicity the axicon trap may be an attractive tool for precision experiments. We would like to use this blue-detuned optical trap for francium atoms on which we perform parity nonconservation (PNC) measurements. We can extract the PNC information from precision measurements of electromagnetically forbidden transitions that are investigated in an environment of well defined handedness. A far detuned blue optical dipole trap has the advantage that the externally applied DC electric and magnetic fields, as well as the of the laser excitation field are decoupled from the light field that provides the trap. We have demonstrated trapping of 210Fr atoms in a magneto-optical trap [22], a number that we have increased by a factor of ten [23]. We are currently working on improving the number of trapped atoms by using a double MOT system and thus having a much longer trap life-time. Radioactive 210Fr has a lifetime of approximately min which, when contained in a trap, is long enough to perform the sequence of measurements necessary for determining the parity violation signal [21]. With respect to other precision spectroscopy to test discrete symmetries, Romalis and Fortson [24] have shown that to perform a more sensitive test of time invariance with trapped atoms in a dipole trap than presently done, it is necessary to have about trapped atoms interrogated for about s.
Francium is the heaviest alkali atom, and thus the fine structure of the line is significantly modified by relativistic effects. The fine splitting between the (817 nm) and the (718 nm) lines of Fr is 100 nm. For all PNC measurements the atoms have to be prepared in one magnetic substate and this is generally done with optical pumping. In the sequence of PNC determination, the m-state will be flipped from to . Therefore it is important that the light shifts in the dipole trap be the same for all Zeeman sublevels. In order to minimize the sensitivity to polarization effects due to the trapping light, the detuning has to be larger than the fine structure splitting of the line [25]. This requires W of laser power at nm in order to produce an axicon trap a fifth of the size of the one discussed in this work, i.e. a trap with a ring diameter of m and ring width of m. In such a trap francium atoms cooled to the Doppler limit (K) can be trapped in the dark. In the above considerations linearly polarized light was employed. When using circularly polarized light, the laser can be tuned between the and line and the required intensity is much lower. However, in such a trap, which was demonstrated experimentally for rubidium atoms [26], atoms are trapped in the region of highest intensity, and therefore it is not an appropriate trap for precision measurements.
We are currently also investigating a new configuration of far detuned trap, formed by two counter-propagating “axicon beams” which permit a much tighter and more symmetric trapping potential. However, the simplicity of the single beam axicon trap may remain preferable.
We thank T. Killian for assistance with data acquisition. S. Kulin acknowledges support from the Alexander von Humboldt Foundation, S. Christe and B. Peker received REU support from the NSF. This work has been supported by NSF and the Guggenheim Foundation.
References
References
- [1] Davidson N, Lee H J, Adams C S, Kasevich M and Chu S 1995 Phys. Rev. Lett. 74 1311
- [2] Ovchinnikov Yu B, Manek I, and Grimm R 1997 Phys. Rev. Lett. 79 2225; Ovchinnikov Yu B, Manek I, Sidorov A I, Wasik G and Grimm R 1998 Opt. Commun. 147 67
- [3] Kuga T, Torii Y, Shiokawa N, Hirano T, Shimizu Y and Sasada H 1997 Phys. Rev. Lett. 78 4713
- [4] Ozeri R, Khaykovich L and Davidson N 1999 Phys. Rev. A 59 R1750
- [5] Friedman N, Khaykovich L, Ozeri R and Davidson N 2000 Phys. Rev. A 61 031403
- [6] Rudy P, Ejnisman R, Rahman A, Lee S and Bigelow N P 2001 Optics Express 8 159
- [7] While preparing this manuscript, we became aware of similar work pursued independently in the group of Tino G at the University of Naples, Italy. The work there is focussed on making an axicon trap as small as possible in order to trap cold atoms from a Bose Einstein condensate.
- [8] Simsarian J E, Aubin S, Grossman J S, Orozco L A, Pearson M, Sprouse G D and Zhao W Z 1999 Parity Violation in Atoms and Polarized Electron Scattering Ed. Frois B Bouchiat M-A (Singapore: World Scientific) p 312
- [9] Golub I and Tremblay R 1990 J. Opt. Soc. Am. B 7 1264 and references therein
- [10] Song Y, Milam D and Hill III W T 1999 Opt. Lett 24 1805
- [11] McLeod J H 1954 J. Opt. Soc. of Am. 44 592
- [12] Soroko Lev M 1989 Axicons and Meso-Optical Imaging Devices in Progress in Optics XXVII ed. Wolf E (Amsterdam: Elsevier Science publishers B V) p 109
- [13] Parigger C, Tand Y, Plemmons D H and J. W. L. Lewis 1997 Appl. Opt. 36 8214
- [14] Bélanger P A and Rioux M 1976 Can. J. Phys. 54 1774
- [15] Bélanger P A and Rioux M 1978 Appl. Opt. 17 1080
- [16] Chaloupka J L and Meyerhofer D D 1999 Phys. Rev. Lett. 83 4538
- [17] Metcalf H J and van der Stratten P 1999 Laser cooling and trapping (Berlin: Springer Verlag)
- [18] Arlt J and Padgett M J 2000 Opt. Lett. 25 191
- [19] Walhout M, Megens H J L, Witte A and Rolston S L 1993 Phys. Rev. A 48 R879
- [20] Lawall J, Orzel C and Rolston S L 1998 Phys. Rev. Lett 80 480
- [21] Wood C S, Bennett S C, Cho D, Masterson B P, Roberts J L, Tanner C E and Wieman C E 1997 Science 275 1759
- [22] Simsarian J E, Ghosh A, Gwinner G, Orozco L A, Sprouse G D and Voytas P 1996 Phys. Rev. Lett. 76 3522
- [23] Sprouse G D and Orozco L A 1997 Annu. Rev. Nucl. Part. Sci. 47 429
- [24] Romalis M V and Fortson E N 1999 Phys. Rev. A 59 4547
- [25] Boiron D, Michaud A, Fournier J M, Simard L, Sprenger M, Grynberg G and Salomon C 1998 Phys. Rev. A 57 R4106
- [26] Cho D 1997 J. Korean Phys. Soc. 30 373
- [27] Corwin K L, Kupperns S J M, Cho D and Wieman C E 1999 Phys. Rev. Lett. 83 1311