Phase-transitions in a model for the formation of herpes simplex ulcers
Abstract
The critical properties of a cellular automaton model describing the spreading of infection of the Herpes Simplex Virus in corneal tissue are investigated through the dynamic Monte Carlo method. The model takes into account different cell susceptibilities to the viral infection, as suggested by experimental findings. In a two-dimensional square lattice the sites are associated to two distinct types of cells, namely, permissive and resistant to the infection. While a permissive cell becomes infected in the presence of a single infected cell in its neighborhood, a resistant cell needs to be surrounded by at least infected or dead cells in order to become infected. The infection is followed by the death of the cells resulting in ulcers whose forms may be dendritic (self-limited clusters) or amoeboid (percolating clusters) depending on the degree of resistance of the resistant cells as well as on the density of permissive cells in the healthy tissue. We show that a phase transition between these two regimes occurs only for and, in addition, that the phase-transition is in the universality class of the ordinary percolation.
1 Introduction
One of the most common and intensively studied diseases among humans is the herpes simplex virus (HSV) infection. Apparently, the unique symbiosis that exists in nature between humans and the HSV allows the viral particles to remain inactive (latent infection) in the cranial nerve ganglia after a primary infection, producing frequently recurring localized infections during the host’s lifetime [1]. The reactivation of HSV from latency may occur at any time and it is characterized by active viral replication in the epithelium causing vesicular eruptions in human mucosae and skin. The rupture of these vesicles and the consequent cell necrosis leave the characteristic herpetic lesion or ulcer.
Basically, there are two distinct types of herpes simplex virus, namely, HSV Type I and HSV Type II. The former generally involves infection above the waist (ocular and facial) while the latter infects tissues below the waist. Here we discuss a mathematical model proposed to describe the growth of corneal ulcers caused by HSV Type I [2]. This infection is common and frequently causes corneal opacification. Traditionally the morphology of the corneal ulcers has been described as either dendritic or amoeboid. The dendritic ulcers are by far the more frequent form and, though they are self-limited in general, ocasionally they can enlarge progressively changing to the amoeboid form. This is actually the natural course of the infection in the case of immunocompromised hosts or of inappropriate use of topic corticosteroids. In general, the amoeboid ulcers have a prolonged clinical course when compared to the dendritic ones. Regardless of their morphology, the ulcers are epithelial lesions that extend through the basement membrane whose swollen epithelial borders contain active viral particles.
In order to carry out a more quantitative study of the ulcer morphology, the fractal dimension of clinically diagnosed HSV ulcers (including both dendritic and amoeboid forms) have been estimated suggesting that their outlines are fractal objects [3]. While the dendritic ulcers include branching and linear lesions, the geographic ulcers are no longer linear and as they increase in size, their perimeters become less and less irregular. In addition to its usefulness as a classification tool, the fractal properties of the ulcers may give information on the underlying mechanisms of viral spread within the epithelial tissue. For instance, a theory based only on the neurotropism of HSV and the dendritic-like distribution of nerve terminals can explain the branching pattern observed in dendritic ulcers [4], but it fails to explain the decrease of the fractal dimension (perimeter irregularity) with increasing ulcer sizes. An alternative explanation put forward by Landini et al [2], which will be the main focus of this paper, considers the ulcer shape as the natural outcome of the contiguous spread of viral particles modulated by variations in the cell susceptibilities to infection. To take into account the fact that viruses only infect cells that have appropriate receptor molecules on their surface, those authors proposed a cellular automaton model for the HSV I spread in which the corneal epithelial tissue is modeled by a two-dimensional lattice. In their model, each lattice site may be occupied either by a permissive cell (with probability ) or by a resistant cell (with probability ). More pointedly, a permissive cell becomes infected whenever there are at least one infected cell in its neighborhood, while a resistant cell becomes infected if the number of infected and dead neighboring cells is larger than or equal to the integer parameter that measures the degree of resistance of the cell [2].
The simulated ulcers obtained with the cellular automaton have the same qualitative features of the clinical lesions and, in addition, for appropriate choices of the degree of resistance a dramatic change on the morphology of the ulcers is observed as the initial concentration of permissive cells increases beyond a certain value [2]. This phenomenon was conjectured to be of a (qualitatively) similar nature as the ordinary percolation phase transition. The main contribution of this paper is to show, through the calculation of the dynamic and static critical exponents, that in the cases where a phase-transition does occur (), the transition belongs indeed to the universality class of the ordinary percolation [5, 6]. To carry out this analysis we use the so-called dynamic Monte Carlo method or spreading analysis [7, 8] whose idea is to study the spreading of the infection starting from a configuration with a single infected cell on the center of the lattice. Clearly this technique is very well suited to our investigation since the characterization of the spreading behavior of the infection is exactly the issue we address in this paper.
The remainder of the paper is organized as follows. Following Landini et al [2], in Sec. 2 we give the set of rules that govern the evolution of the HSV I infection in a two-dimensional square lattice and present the evidences for the existence of a threshold phenomenon or phase transition for . In Sec. 3 we characterize this phase transition using the dynamic Monte Carlo method which allows the computation of the critical dynamic exponents that describe quantitatively the spreading of the infection from a single infected cell. Finally, some concluding remarks are presented in Sec. 4.
2 Model
The cellular automaton model is defined in a square lattice consisting of sites, where each site is associated to a cell. Each cell is modeled by a four-state automaton corresponding to the different states of this cell: healthy permissive, healthy resistant, infected and dead. Except for the central cell, the initial state of any cell in the lattice is set either as permissive or resistant with probabilities and , respectively, so that there are no dead cells at the outset. The infection spreads from the single central infected cell and the ulcer (i.e., the cluster of dead cells) grows according to the following deterministic rules [2]:
-
(1)
An infected cell dies in the next time step.
-
(2)
A healthy permissive cell becomes infected if at least one of its neighboring cells is infected.
-
(3)
A healthy resistant cell becomes infected if at least of its neighboring cells are infected or dead.
The neighborhood of a given cell consists of its first and second nearest neighbors (Moore neighborhood). The infection and subsequent death of a resistant cell surrounded by or more dead cells is justified by the lack of tissue support. In addition, this is necessary to prevent the occurrence of large ulcers with small islands of resistant cells, which are not observed clinically [2]. The four-state automaton considered allows transitions of one of the healthy states to the infected and dead states in a cyclic manner. At each time step we perform a parallel updating of all cell states.
For we are dealing with a variant of the so-called diffusion percolation process where the geometry changes via a dynamic process and the nature of the growth depends on the local environment [9]. For finite lattice sizes and open boundary conditions the above rules are repeated until either there are no more cells to infect or an infected cell reaches the lattice boundary. These different modes of termination generate dendritic (self-limited) and amoeboid (irrestricted) ulcers, respectively. It is interesting to note that the ordinary site percolation process is recovered for , since in this case a resistant cell can never become infected and so the infection can propagate only through the permissive cells.
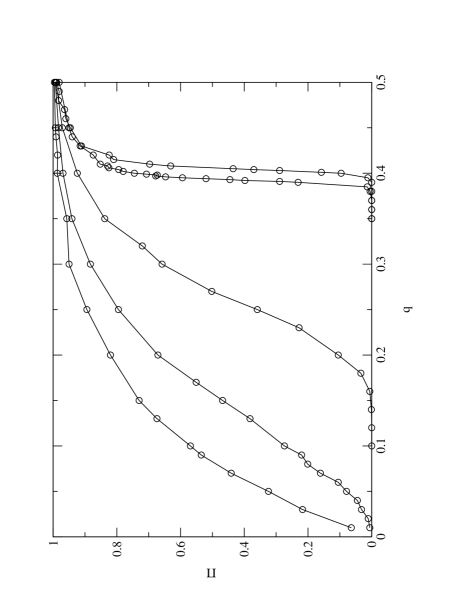
To illustrate the dependence of the different termination modes, and hence ulcer forms, on the control parameters and of the model we present in Fig. 1 the fraction of irrestricted ulcers generated in runs. Each run corresponds to a different initial configuration of the lattice. Clearly, this fraction can be identified with the percolation probability [5, 6]. Rather interestingly, we have found that the results for are indistinguishable within the numerical precision. Actually, this is expected since there is a preferred direction for the propagation of the infection, namely, from the center to the lattice boundaries, and so only the neighborhood facing the infection front matters to update the state of a healthy cell. Since the largest size of the error bars in this as well as in the next figure is twice the size of the symbols, they were ommited for the sake of clarity. More importantly, we have found that for , the results become independent of the lattice size already for .
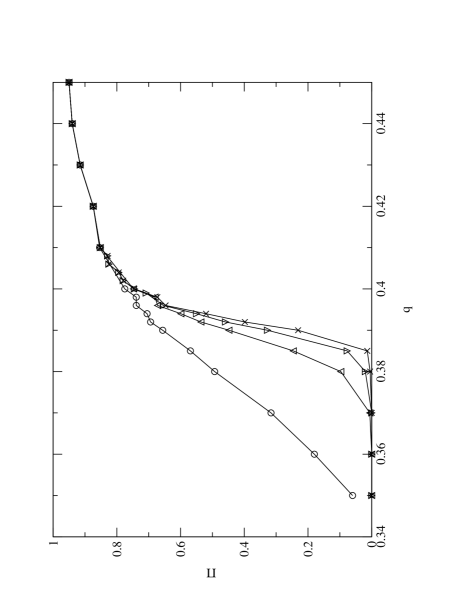
However, for the dependence on the lattice size, illustrated in Fig. 2 for , indicates the occurrence of an atypical threshold phenomenon at a critical value in the limit . In fact, as increases from to the percolation probability vanishes for , undergoes a discontinuous transition to some value at and then increases monotonically towards . This transition is atypical in the sense that is not equal to above , as in the case of the ordinary percolation transition [5, 6], which means that in this regime there is a finite probability that the infection does not percolate, i.e., a dendritic ulcer is formed. The reason for that is due simply to the fact that the spreading process starts from a single central cell so that if the infection happens to percolate in a lattice of a given size then it is certain to percolate in a smaller lattice too, i.e., for . In particular, yields an upper bound to . Of course, if the initial setting is such that there is an extensive number of infected cells, say with , randomly distributed over the bottom side of the lattice and periodic boundary conditions on the lateral sides, then the usual result is recovered [10]. In fact, since the curves for different lattice sizes do not cross, the standard finite size scaling analysis aiming at determining both and the spatial correlation length exponent for (see, e.g., Ref. [5]) fails spectacularly and so we have to resort to other means to estimate those quantities.
3 Spreading analysis
We turn now to the analysis of the spreading behavior of the viral infection starting from a single infected cell located in the center of a lattice of infinite size. Finite size effects are absent because the lattice size is taken large enough so that during the time we follow the evolution the infection front can never reach the lattice boundaries. This of course sets an upper limit to the time we can follow the viral spread and so, for instance, for lattices of size we let the infection evolve up to . As usual, we concentrate on the time dependence of the following key quantities [7]: (i) the average number of dead and infected cells ; (ii) the survival probability of the infection ; and (iii) the average mean-square distance over which the ulcer has spread . For each time we carry out independent runs, hence is simply the fraction of runs for which there is at least one infected cell in the lattice at time . At the transition point we expect that the measured quantities obey the following scaling laws [7]
| (1) | |||||
| (2) | |||||
| (3) |
where , and are dynamic exponents. Since the fractal dimension of the ulcer at a given time is defined as we have
| (4) |
at the critical point. Note that this equation is different from the one used in the studies of directed percolation (see, e.g., Ref. [11]) because in the present case all runs generate an ulcer and so as well as are averages taken over all runs.
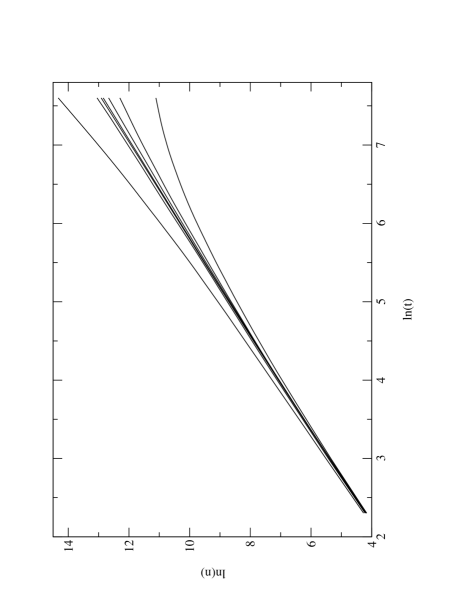
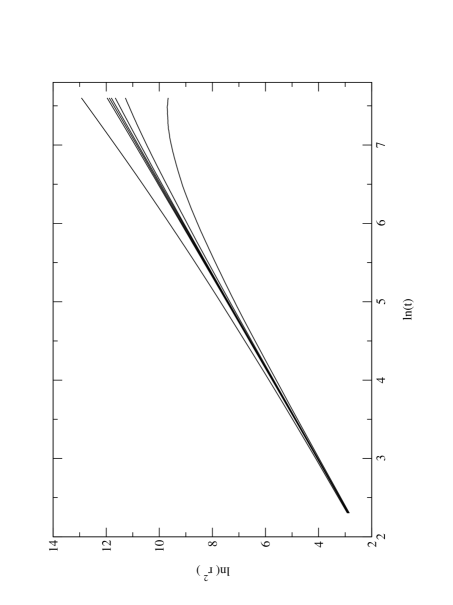
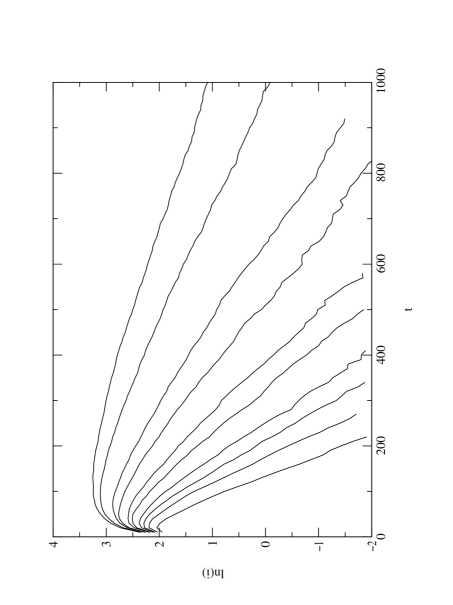
In Figs. 3, 4 and 5 we present log-log plots of , and , respectively, as functions of in the vicinity of the critical point for . The asymptotic straight lines observed in these figures are the signature of critical behavior while upward and downward deviations indicate supercritical () and subcritical () behaviors, respectively. We recall that in the subcritical regime only dendritic ulcers are formed, while in the supercritical regime the formation of amoeboid ulcers is much more frequent (see Fig. 2). The data shown in Fig. 3 yield where the error is estimated by determining two values of as close as possible to the critical point for which upward and downward deviations can be observed. A precise estimate for the dynamic critical exponents is obtained by considering the local slopes of the curves shown in the previous figures. For instance, the local slope is defined by [11]
| (5) |
which for large behaves as
| (6) |
where is a constant. Analogous expressions hold for and . Hence plots of the local slopes as functions of allow the calculation of the critical exponents. Applying this procedure for the critical curves we find the exponents , and . The errors in the critical exponents are, as usual, the statistical errors obtained by fitting the local slopes by straight lines in the large regime. We expect, of course, that the (uncontrolled) systematic errors are much larger than those. Using Eq. (4) we obtain which is in very good agreement with the analytical prediction for the ordinary percolation [5, 6].
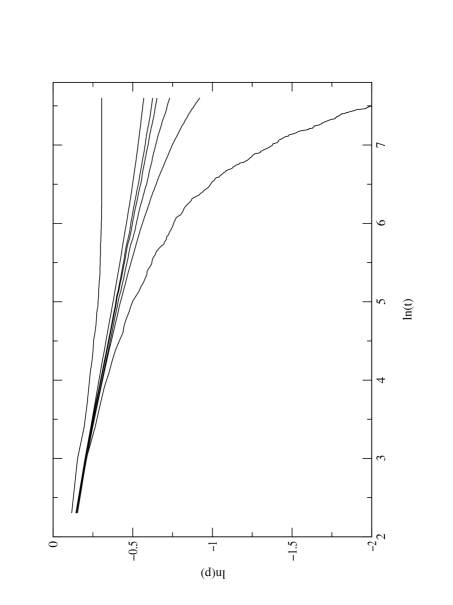
As the dynamic exponents , and for the ordinary percolation problem are not very well known, to show unambiguously that this ulcer formation model belongs to the universality class of the ordinary percolation we ought to estimate the static exponents and . We recall that the exponent gives a measure of how the fraction of lattice cells belonging to an infinite cluster vanishes as the percolation threshold is approached in the supercritical regime while is the correlation-length exponent in the space direction. To do so we calculate first the exponent which governs the decay of the concentration of infected cells in the subcritical regime. In fact, since in this regime the correlations are short-ranged one expects to decay exponentially [7]
| (7) |
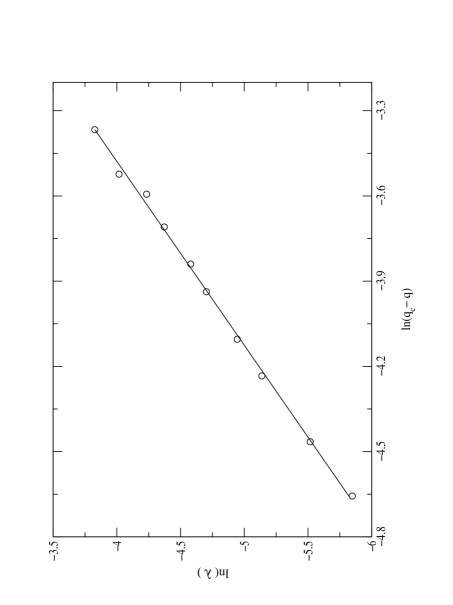
where is some time independent function. Fig. 6 not only illustrates the adequacy of this assumption but permits also the evaluation of the decay constant
| (8) |
from the asymptotic slopes of the curves vs. . The results presented in Fig. 7, showing the dependence of on the distance from the critical point, allows the calculation of the exponent as the slope of the straight line, yielding . Once this exponent is known we can use the scaling relations and [7] to estimate the static exponents. We find and which, within error bars, are in agreement with the exact values of the corresponding exponents of the ordinary percolation, namely, and [5, 6].
We have carried out a similar spreading analysis for and, as hinted in Fig. 1, we have found a slightly larger percolation threshold, namely, which, within error bars, is shown to be independent of the value of . Furthermore, since the larger the resistance parameter , the more similar the ulcer formation problem is to the ordinary site percolation, we have found the same dynamic and static critical exponents as for the case , as expected.
4 Conclusion
Using the dynamic Monte Carlo method we have shown unambiguously that the phase transition observed in the model for formation of herpes simplex ulcers proposed by Landini et al [2] belongs to the universality class of the ordinary percolation. The value of this finding should not be underrated since the infection process actually resembles a diffusion percolation process where the growth depends on the local environment, in the sense that the decision on whether or not a resistant cell will become infected depends on the time-dependent states of several of its neighbors. Furthermore, since the ulcer formation model described here may be thought of as a damage spreading process, one could expect that the transition were in the universality class of the directed percolation instead. However, as pointed out by Grassberger [12], this is not so because in the ulcer formation model the damage never heals (even if it does not spread), i.e., the probability that an infected or dead cell becomes healthy is zero.
The finding that for the model does not present a phase transition reflects the nontrivial role played by the resistance parameter in this percolation process. In these noncritical cases the probability that an infinite or irrestricted ulcer is generated is given by the smooth size-independent curves shown in Fig. 1. Similarly to a noncritical forest fire model [13, 14] the growing of this type of ulcer may be characterized by infection fronts with fractal dimension whose value probably depends on the resistance parameter (of course, for ). An additional feature that makes the quantitative study of this viral spreading model rather challenging is the result that the percolation probability curves for different lattice sizes do not cross (see Fig. 2), which complicates enormously the estimate of the percolation threshold and critical exponents through the standard finite size scaling method.
Some remarks on the biological interpretation of our results are in order. According to the specialized literature [1, 2, 3, 4], amoeboid ulcers are, in general, observed in immunocompromised patients or in patients that made inappropriated use of corticosteroids. In the present model, these conditions would correspond to a decrease of the degree of resistance of the resistant cells or to an increase of the initial concentration of permisssive cells. Although this model does not take into account the recurrent characteristic of this kind of infection, in which case the variability of would probably play an important role, nor the possibility of variation of during the course of the infection, its predictions are in qualitative agreement with the clinical observations. In fact, Fig. 1 points out the prevalence of amoeboid ulcers when decreases or increases. This agreement lends support to the hypothesis that the morphology of the ulcers is determined by the viral spreading through cells with different susceptibilities to infection.
To conclude we should mention that an extension of the original model proposed by Landini et al in which both the regeneration of dead cells as well as the spontaneous outbreak of infection anywhere in the lattice are taken into account has already been considered in the literature [15]. Interestingly, in this case the viral spreading model becomes very similar to the critical forest fire model with immune trees [16, 17]. In particular, the resistance parameter of the ulcer formation model is akin to the immunity probability, i.e., the probability that a tree is not ignited though one of its neighbors is burning. According to a conjecture put forward by Grassberger [12], the extended ulcer formation model should be in the universality class of directed percolation, since it allows for the regeneration of dead cells. This suggestion is strengthened by the finding that the forest fire model with immune trees is in that class of universality [17].
The work of J.F.F. is supported in part by Conselho Nacional de Desenvolvimento Científico e Tecnológico (CNPq) and Fundação de Amparo à Pesquisa do Estado de São Paulo (FAPESP), Proj. No. 99/09644-9. The work of R.M.Z.S. is partially supported by CNPq. C.P.F. is supported by FAPESP. We thank FAPESP for supporting R.M.Z.S’s visit to São Carlos where part of her work was done.
References
- [1] T. J. Liesegang, Ophtalmology 99, 781 (1992).
- [2] G. Landini, G. P. Misson and P. I. Murray, Fractal in the Natural and Applied Sciences A-41 241 (1994).
- [3] G. Landini, G. P. Misson and P. I. Murray, Cornea 11, 510 (1992).
- [4] C. R. Dawson, B. Togni and T. E. Moore, Arch. Ophthalmol. 79, 740 (1968).
- [5] D. Stauffer and A. Aharony, Introduction to Percolation Theory (Taylor & Francis, Londres, 1992)
- [6] M. B. Isichenko, Rev. Mod. Phys. 64, 961 (1992).
- [7] P. Grassberger and A. de La Torre, Ann. Phys. 122, 373 (1979).
- [8] P. Grassberger, Math. Biosc. 63, 157 (1983).
- [9] J. Adler and A. Aharony, J. Phys. A 21 1387 (1988).
- [10] M. E. Levinshtein, B. L. Shklovskii, M. S. Shur and A. L. Éfros, Sov. Phys. JETP 42 197 (1975).
- [11] P. Grassberger, J. Phys. A 22, 3673 (1989).
- [12] P. Grassberger, J. Stat. Phys. 79, 13 (1995).
- [13] P. Bak, K. Chen and C. Tang, Phys. Lett. A 147, 297 (1990).
- [14] P. Grassberger and H. Kantz, J. Stat. Phys. 63, 685 (1991).
- [15] G. Camelo-Neto and S. Coutinho, Fractals 4, 113 (1996).
- [16] B. Drossel and F. Schwabl, Physica A 199, 183 (1993).
- [17] E. V. Albano, J. Phys. A 27, L881 (1994).