Quantum and Classical Dynamics
of Methane Scattering
PROEFSCHRIFT
ter verkrijging van de graad van doctor
aan de Technische Universiteit Eindhoven,
op gezag van de Rector Magnificus,
prof.dr. M. Rem,
voor een commissie aangewezen
door het College voor Promoties
in het openbaar te verdedigen
op donderdag 14 juni 2001 om 16.00 uur
door
Robin Milot
geboren te Utrecht
Dit proefschrift is goedgekeurd door de promotoren:
prof.dr. R.A. van Santen
en
prof.dr. A.W. Kleyn Copromotor: dr. A.P.J. Jansen
CIP-DATA LIBRARY TECHNISCHE UNIVERSITEIT EINDHOVEN
Milot, Robin.
Quantum and classical dynamics of methane scattering /
by Robin Milot. - Eindhoven: Technische Universiteit Eindhoven,
2001. - Proefschrift. - ISBN 90-386-2782-3
NUGI 813
Trefwoorden: moleculaire dynamica / rotationele en vibrationele
energie-overdracht / overgangsmetaal-katalysatoren / dissociatieve
chemisorptie; methaan
Subject headings: molecular dynamics / rotational and vibrational energy
transfer / transition metal catalysts / dissociative chemisorption; methane
Printed at Universiteitsdrukkerij, Eindhoven University of Technology
This research has been financially supported by the Council for
Chemical Sciences of the Netherlands Organization for Scientific
Research (CW-NWO).
The work described in this thesis has been carried out at the Schuit Institute of Catalysis (part of NIOK, the Netherlands School for Catalysis Research), Eindhoven University of Technology, The Netherlands.
Chapter 1 General introduction
This thesis describes the scattering dynamics of methane from transition metals. The dynamics is studied by wave packet (quantum dynamics) and classical (Newtonian) trajectory simulations. Although the dissociation of methane is not studied itself, I try to deduce consequences for the dissociation from the scattering simulations. I give a general introduction in this chapter with a description of theoretical research in general, and explain the chemical theories which are used nowadays. Next I discuss catalysis and how my research is related to this. I end with an overview of the next chapters.
1.1 Theory in action
This dissertation describes theoretical chemical research on the scattering of methane from transition metal surfaces. I try to deduce from the scattering consequences for the dissociation of methane, which is important for catalysis. I will explain in this introduction: What is theoretical research supposed to do? What kind of chemical theories are in use? What can be the relevance of my research for catalysis? And finally: What can be found in the rest of this book?
The core business of theoretical research is a mixture of speculation, calculation, model building, and approximation.***I follow here Chapter 12 of Ref. [representing], which you can read for a more extended discussion on theoretical research. There are different levels of speculation, which you normally can find back if words like hypotheses and assumption are used. Simple speculation can be for example that there are particles, and these particles have interactions with each other. More complex speculation occurs if the interaction is expressed by a mathematical equation, which is called then a theory. The theory has some parameters, which can be later on filled in for a specific experiment. The parameters can be fitted on the experiment, obtained from other theories, or just guessed for a lucky shot. At that moment we are already busy with calculations. If the parameters are filled in or the mathematical equations are combined, we apply the general theory into a specific model. Sometimes the model is too complex for drawing simple conclusions from it, or it is very hard or even impossible to solve all the equations (calculation) within a reasonable amount of time. Approximation is then a way to overcome such a problem. Approximation contains also a bit of speculation itself. We assume that the subset of the model will be able to describe the experiment (at less in part) the same as the original model. The subset of the original is an model itself on which the same tricks can be applied later on.
Most experimentalists do use theory for the interpretations of their experiments. For some problems the developed theory or the system under study will become so complex or the model so big, that calculation can only be performed if one only focus on theory. My research is an example of this. A lot of approximation have been done to obtain models, which are small enough to be calculated on a computer. I need to know something about computer programming and numerical methods, before I can put them into a computer. I also have to compare the results of my calculated approximated models with the available experiments. I have to look for agreement, and speculate how we can overcome the disagreements between the models and experiments. Of course my models are not build totally from scratch, but are developed from established chemical theories.
1.2 Chemical theory
Chemistry studies things we normally denote with substance, matter, material, and chemicals. It is not only interested in the matter itself, but also how it can be changed in something else. We all know a lot of this matter, because we use at lot of it on a daily basis. We cook, eat, do the dishes, wash our clothes, clue our fingers, and making fire for heating. Still there are some things we let over to specialists. The chemists are specialists in (change of) matter. Chemist make use of theoretical concepts for the description of chemical phenomena. I will give an small and global overview of the three most important theoretical concepts; Thermodynamics, kinetics, and molecular dynamics.
1.2.1 Thermodynamics and kinetics
Thermodynamics is a very well established chemical theory. It is a spin off from the developments on the steam engine at the end of the 18th century, to which its name still refer. Thermodynamics stands for how heat is transfered into work [thermodyn]. The theory itself is not about dynamics at all, but deals with thermostatic phenomena. Thermodynamics describes equilibrium conditions.
In thermodynamics everything is related to different kinds of energy. A chemical reaction is thermodynamical possible (runs on its own), if the energy of the products is lower then the energy of the reactants. Such an reaction is then called exothermic, because the loss of energy from the reactants to the products is given back as heat. If the products have a higher energy than the reactants, then the chemical reaction is called endothermic. An endothermic reaction cannot run independently, but it needs a side reaction that delivers the heat necessary for the reaction.
If a reaction is thermodynamical possible (exothermic), then a reaction does not have to occur at all. Thermodynamics does not say anything about the time-scale of a reaction. The time-scale is left over to chemical kinetics, which studies the rate of the reaction as a function of concentration, pressure, and temperature. The reaction rate can be linear dependent of the concentration (or pressure) of the reactants in a simple case. This can be written as
| (1.1) |
where is the rate constant. The rate constant can be expressed by the Arrhenius rate law
| (1.2) |
where is the prefactor, is the activation energy, is the gas constant, and the temperature. The activation energy can be seen as a barrier which needs to be overcome to let the reaction occur. This barrier is sketched in Figure 1.1 for an exothermic reaction. We can see now that we first need energy to overcome the barrier before the reaction can occur, although the energy of the products is lower then the energy of the reactants. Thermal energy can be used to overcome the barrier. Raising the temperature increases the rate of the reaction, while a higher activation energy decreases it. The backward reaction from product to reactant is also possible, but the activation energy for the backward reaction () is higher than for the forward reaction (). The consequence of this is that the rate constant of the forward reaction is larger than the rate constant of the backward reaction, which means that the concentration of the product is higher than of the reactants at the time the thermodynamics equilibrium is reached.

A conversion from reactants to products does not always occur in one step, but can consist out of multiple steps. In such a case we have to overcome multiple barriers. The reactants are then converted into an intermediate, and the intermediate into other intermediates or finally into the products. The reaction step with the highest barrier is the rate limiting step, because it is the bottle neck for the overall reaction rate.
1.2.2 Molecular dynamics
Nowadays the world is full of molecules. However, this was not always the case. Of course there was an atomic world-view suggested by Democritus, and the corpuscles of Boyle went in the direction of molecules, but they were not very useful at their time. Thermodynamics and kinetics works very well without any notion of molecules. The real victory of the atoms and molecules is established at the beginning of the twentieth century. Beside that (chemist assume that) there are small particles like molecule, we also take for granted that they move and do interact with each other. The kinetic energy of the random motion of particles is now associated with the temperature.
Chemists think that molecules exist out of positive charged nuclei and negative charged electrons. If the molecule has only one nucleus then it is called an atom. Electrons have always an electron charge of , and nuclei can have charges of to more than . The mass of an electron is much lower than the mass of a nucleus. The mass of the nucleus increases with the charge of the nucleus, but there can exist nuclei with different masses while their charge is the same. These nuclei are called isotopes.
Negative and positive charged particle have an attractive interaction with each other. Two negative or positive charged particles have a repulsive interaction. If the nuclei are in a certain position from each other with in between them some electrons, and the total attraction is larger than the total repulsion, then the result is a stable molecule. The spatial arrangement of a stable molecule, which is normally called the molecular structure, is responsible for the physical and chemical properties of a substance. The structure of a stable molecule has a lower energy than other spatial arrangements near that structure. We are talking about isomers, if two molecule have the same number of electrons and types of nuclei, but the nuclei are arranged different in space.
Within the molecular world-view a chemical reaction is a spatial rearrangement of nuclei and electrons over a period of time, which gives molecules with a different structure (the products) than the original molecules (the reactants). This rearrangement is possible, because the nuclei have kinetic energy that can be used to overcome a barrier of potential energy between different molecular structures. We do not only have to know the height of the barrier, but we are also interested how we can use the kinetic energy to overcome this. We do so by studying the dynamics of nuclei during the reaction. We do not have to look at the rearrangement of the electrons, because they rearrange much faster than nuclei. Three things are important for the reaction dynamics; The initial momentums and positions of the nuclei, and the potential energy for each spatial arrangement of the nuclei. If we know these, then we can calculate for every time the positions of the nuclei with a dynamical theory.
There are at least three dynamical theories, which are all useful for a specific set of natural phenomena. Classical dynamics is very useful for describing the fall of an apple out of a tree. Quantum dynamics needs to be used for very small particles like electrons. For spaceships traveling near the speed of light we apply relativistic dynamics. Molecules have properties such as translational and rotational motion, which can be described sometimes as accurate with classical and as with quantum dynamics. Quantum dynamics is better in treating vibrational motion, but it has the draw back that is harder to calculate with. In this thesis I use both classical and quantum dynamics for simulating the scattering of methane on transition metal surfaces. (We use normally the term wave packet dynamics for quantum dynamics applied on molecular motion.)
1.3 Catalysis
A catalyst is a chemical, which can change the rate of a reaction step without ending up in a reaction product. This means that it changes the kinetics of a reaction and not the thermodynamics. A catalyst can be used for changing the reactivity or the selectivity of a reaction. Reactivity means that the reaction rate of a reaction is enhanced, and by so that the reactants are converged faster into the products. However, there is not always only one reaction possible if we start with a set of reactants. This can result in a bunch of products. We have not always equal interest in all products. If we are not interested in a product at all, then we call it even waste. We can try to avoid this undesired product by increasing the reaction rate of the reactions to the desired products more than the reaction rate of the reactions to the waste or less desired products. In this case we make use of the selectivity of a catalysts.
Catalysis is the name of the science that studies catalysts. Catalysis has many technological aspects, because the output of the research has to benefit us. The main goal is to let make catalysts better. The main question is: What is the optimal catalyst for a given reaction? Chemistry is not the only science that plays a role in answering this question. Of course we can search for an optimum between reactivity and selectivity. The found optimum catalyst is not always the most economic favourable catalysts. The optimum catalyst in terms of reactivity and selectivity is unfortunately most of the time also the most expensive, so a cheaper but less selective or reactive catalyst can give more profit. Another chemical and economical problem is the stability of the catalyst. After a certain time a catalyst is not anymore as reactive and selective as at the time it was placed in the reactor. This can be caused by thermal instability or poisoning of the catalyst. The consequence of this is that the original catalyst has to be replaced in the reactor by a new one. This can be very costly, because one has to buy a new catalyst and the reactor cannot be used during the replacement of the catalyst.
Catalysts can be divided into two classes: Homogeneous and heterogeneous catalysts. Homogeneous catalysts are in the same phase as the reactants, and has the advantage that they are well-dispersed and well-mixed with the reactants. They are also in general more complex, and by so more selective than heterogeneous catalysts. Examples of homogeneous catalyst are the enzymes in living creatures, and organo-metallic complexes used for polymerisation reactions. A disadvantage of homogeneous catalyst is that the products are hard to separate from the catalyst.
Heterogeneous catalysts are in a different phase than the reactants and products. Normally this means that the catalyst is solid and the reactants are gaseous or liquid. The reaction takes place at the interphase between the catalyst and reactant phase. Heterogenous catalysts are widely used in industry for the conversion of bulk chemicals. Examples of industrial heterogeneous catalysts are zeolites and transition metal clusters deposited on micro-porous carrier materials.
The last example is important for steam (H2O) reforming of methane (CH4) for the production of syngas (CO + H2). Syngas can be used as building blocks for the productions of various organic molecules. The rate limiting step in the steam reforming of methane is the breaking of an C–H bond [hoo80]. It is very difficult to study this reaction step on its own in an industrial catalyst. Therefore we have to look for model systems which make it possible to do so.
Surface science has given us such a model. The metal clusters are modeled by a metal surface with a well-defined topology. The metal surface can be placed in a box and deposited on a gas mixture. If the box is under ultra high vacuum (UHV), then it is also possible to study reactions at the interphase with spectroscopic techniques. One can also shoot molecules with a specific velocity at the surface with a gun called molecular beam. Over the last decades a lot of new phenomena have been created with these molecular beams, which have never been seen before. I did not work with molecular beams, but I have tried to make some dynamical models for describing the observations with molecular beams of methane on metal surfaces. So at the end my research might contribute a very little bit to a better understanding of the working of a heterogeneous industrial catalyst. If you like to see any relevance of my research with daily live issues, then you can find it through this small connection. I leave the judgement to you.
1.4 Overview of this thesis
This thesis describes simulations of methane scattering on a nickel metal surface. Although the dissociation of methane is not studied, I try to deduce from the scattering simulations implication for the dissociation and to relate them with the available molecular beam studies. Therefore, I will give an overview of the experimental and theoretical studies on methane dissociation on transition-metal surfaces in Chapter 2 first.
Chapter 3 gives an introduction and the computational details of our wave packet simulations discussed in Chapters 4, 5, and 6. It describes four model potential energy surfaces (PESs) for the scattering of oriented of CH4 and CD4 from a flat surface on which we performed our wave packet simulations. I also gives a short survey of the multi-configurational time-dependent Hartree (MCTDH) method, which we have used for our wave packet propagation, because it can deal with a large number of degrees of freedom and with large grids [bec00].
The scattering of CH4 in the vibrational groundstate on the model PESs is presented in Chapter 4. At a translational energy up to 96 kJ/mol we find that the scattering of almost completely elastic. Therefore, we used vibrational excitations when the molecule hits the surface and the corresponding deformation for the analysis of the scattering. From these we deduce consequences for the dissociation mechanism, and find that for methane to dissociate the interaction of the molecule with the surface should lead to an elongated equilibrium C–H bond length close to the surface.
The isotope effect is described in Chapter 5 by comparing the scattering of CD4 with CH4. First, we look again at the scattering, excitation probabilities when the molecule hits the surface, and the corresponding deformations. The scattering is still predominantly elastic, but less so for CD4. Second, we do an energy distribution analysis of the kinetic energy per mode and the PES terms when the molecule hits the surface. They indicate that the orientation with three bonds pointing towards the surface is mostly responsible for the isotope effect in methane dissociation.
Chapter 6 presents the role of vibrational excitation of a single mode in the scattering of CH4 and CD4. Energy distribution analysis shows that initial vibrational excitations enhance the transfer of translational energy towards vibrational energy and increase the accessibility of the entrance channel for dissociation. The simulations predict that initial vibrational excitations of the asymmetrical stretch () and especially the symmetrical stretch () modes will give the highest enhancement of the dissociation probability of methane.
In Chapter 7 I study the full rotational vibrational scattering of a non-rigid CH4 molecule on a Ni(111) surface with classical (Newtonian) trajectory calculations. Energy dissipation and scattering angles have been studied as a function of the translational kinetic energy, the incidence angle, the (rotational) nozzle temperature, and the surface temperature. Scattering angles are somewhat below the incidence angles of 30∘, 45∘, and 60∘ at a translational energy of 96 kJ/mol. Energy loss is primarily from the normal component of the translational energy and transfered for somewhat more than half to the surface and the rest mostly to rotational motion.
I will end this thesis with some concluding remarks, and suggestion for further research in Chapter 8.
References
- [1] I. Hacking, Representing and Intervening (Cambridge Univ. Press, Cambridge, 1983).
- [2] Ref. [representing], pages 162-4.
- [3] J. P. Van Hook, Catal. Rev. Sci. Eng. 21, 1 (1980).
- [4] M. H. Beck, A. Jäckle, G. A. Worth, and H.-D. Meyer, Phys. Rep. 324, 1 (2000).
Chapter 2 The dissociation of methane
I will give in this chapter an overview of the experimental and theoretical studies on methane dissociation on transition-metal surfaces. The dissociation of methane on transition metals occurs in general through a direct dissociation mechanism. Vibrational energy is overall about as efficient in enhancing dissociation as translational energy, which suggests a late reaction barrier.
2.1 General theory of surface catalytic dissociation
I will now give an overview of the experimental and theoretical literature of methane dissociation on surfaces. Before we enter into details, I will discuss the catalytic activity of metal surfaces in general qualitative terms. Let us assume therefore a diatomic molecule A–B, which we want to dissociate by an catalytic metal surface. The overall reaction will be:
| (2.1) |
In this reaction equation we only see the initial reactant (molecule A–B) and the final products (A and B atoms adsorbed on the metal surface). We are interested in the mechanism of this catalytic reaction: What is the nature of the interaction of the reactant with the surface during the reaction? Of course there are a lot of mechanisms imaginable, but they can all be classified in two types of mechanism. One of these mechanisms is the so called direct activated process, where the molecule will dissociate directly at the moment that the molecule approaches the surface. The A–B bond will be activated by energy transfer at the collision with the surface. The direct reaction can be written as:
| (2.2) |
The other mechanism is an indirect process, which is also called a trapping mediated process. The molecule has to adsorb at the surface first, before it can dissociate. The indirect reaction can be written as:
| (2.3) |
The differences between both mechanisms can be explained theoretically on the basis of the interaction potentials of the surface with the molecule and its dissociation products. Figure 2.1 a) shows the potential energy of the molecule AB and its dissociation products A and B as a function of the distant to the surface. The molecule AB has far away from the surface a much lower energy than the dissociation product A and B. It is therefore hard to dissociate for the molecule AB in the gas phase. If the molecule comes close to the surface, then its energy will go up. The energy of the dissociation product A and B drops towards the surface. The dissociate product A and B are even lower in energy at the point were the line of AB crosses the line of A + B.***The actual location and height of the crossing point cannot be taken from the one dimensional schematic plots of Figure 2.1, because it also dependent of other coordinates like the bond length. The energy difference between the gas phase energy of the molecule and the energy of the crossing point is smaller than the difference between the molecule and dissociation products in the gas phase. The surface is now a catalyst, because it makes the dissociation easier. The molecule needs translational energy to run up against the surface repulsion and reach the crossing point. This is the picture of a direct dissociation mechanism, because the dissociation occurs directly at the collision with the surface.
Figure 2.1 b) shows again the potential energy of the molecule AB and its dissociation products A and B as a function of the distant to the surface. The energy difference in the gas phase is still large, so dissociation is hard. The main difference with Figure 2.1 a) is that the interaction of the molecule AB with the surface is changed. There is a well in the potential near the surface. Because of this it is possible for the molecule AB to adsorb at the surface. Translational energy is not needed to do so. The molecule can now reach the crossing point with use of the available kinetic energy at the surface, when it is adsorbed at the surface. The dissociation occurs then through a indirect trapping mediated process. It is still possible to see a direct dissociation mechanism within the potential energy scheme of Figure 2.1 b), if the translational energy of the molecule AB is high and it will be able to reach the crossing point without absorbing first.
It is now clear how we can experimentally distinguish a direct and indirect dissociation mechanism. The dissociation probability of a direct mechanism is primary dependent on the translational energy of the molecules in the gas phase, and by so on the gas temperature. An indirect mechanism is on the other hand primary dependent on the surface temperature.

Another point of interest is the role of the internal vibrations. Sometimes the dissociation probability is enhanced by both vibrational and translational energy. We need a potential, which is dependent of two dimensions to explain how this is possible. Figure 2.2 shows two possible contour plots of potentials which are dependent of the distance between the molecule and the surface, and the bond length within the molecule. The difference between the two plots is the location of the reaction barrier. Figure 2.2 a) shows a potential with a so called early barrier. The reaction barrier can be accessed by moving the molecule towards the surface. For a potential with a late barrier as sketched in Figure 2.2 b) a movement of the molecule towards the surface is not enough. The bond need also be lengthened to before the reaction barrier can be reached. For a potential with an early barrier only translational energy is needed to overcome the barrier. For a potential with a late barrier also vibrational energy is needed. Vibrational energy can be available initial by vibrational excitations, or generated during the reaction by transferring translational energy to vibrational energy.

The real interaction potential is even more complex than I sketched here. It is also dependent of the translational coordinates parallel to the surface and the orientation of the molecule. For a polyatomic molecule such as methane it becomes even more complicates, because the potential is then dependent of multiple vibrational modes.
2.2 Experimental studies
The dissociation mechanism on transition metal have been studied by either bulb gas or molecular beam experiments. A bulb gas experiment is performed by placing a metal surface in reactor and exposing it to a methane gas (mixture) with a certain pressure and temperature. The surface is placed in a ultra high vacuum chamber at molecular beam studies. The velocity and rovibrational temperature of the molecules in the beam can be varied by changing the gas mixture and temperature of the nozzle. Table 2.1 shows that one can get more direct detailed information from molecular beam than from bulb gas experiments. It is possible with the use of lasers to study the role of rotational en vibrational excitation in more detail, which can be later on compared with the outcome of molecular dynamics simulations. I will give here a now small survey of all experimental studies. A more extended review can be read in Ref. [lar00].
| Bulb gas | Molecular beam | Simulations |
|---|---|---|
| Translational energy | Translational energy | |
| Gas temperature | Nozzle | Rotational energy |
| temperature | Vibrational energy | |
| Surface temperature | Surface temperature | Surface motion |
2.2.1 Bulb gas
One of the first surface science studies of the methane dissociation was under bulb gas condition on a tungsten surface [win75]. A large kinetic isotope effect was observed for CH4 in comparison with CD4. In a second article also the dissociative chemisorption of CH3D, CH2D2, and CHD3 were reported [win76]. The apparent activation energies were discussed in terms of tunneling of hydrogen through a potential barrier, vibrational excitation, and the lifetime of undissociated methane on the surface. Around the same time, it was reported that the dissociation on rhodium surfaces can be enhanced by raising only gas temperature of methane [stew75]. A large kinetic isotope effect was observed again, and this was attributed to the dominant role of vibrational activation. Nevertheless two independent bulb gas experiment with laser excitation of the asymmetrical stretch and umbrella modes on the Rh(111) surface,[yates79] and laser excitation of the and modes on thin films of rhodium[brass79] have not revealed any noticeable enhancement in the reactivity of CH4.
Many years later, new thermal activation studies on rhodium by raising independently the gas temperature and the surface temperature observed that the dissociation increases in all cases with the surface temperature [brass87a, brass87b]. It was suggested therefore that both a direct and an (indirect) trapping mediated mechanism plays a role. The differences in activation energies between CH4 and CD4 were again explained in terms of internal vibrational excitations. A measurement of the kinetic isotope effect on W(211) [lo87] initiated a debate, whether this experiment could be [kay88a, kay88b] or could not be [lo88a, lo88b] described by a tunneling mechanism. An article about thermal activation experiment under isothermal conditions reported a kinetic isotope effect of a factor 20 on Ni(100), whereas none was observed on Ni(110) [bee87]. However, Ref. [cho90, olg95] found under the same conditions an activation energy twice as high for CH4 on Ni(100) as Ref [bee87]. A direct reaction mechanism has been found on Ni(111)[han91] and Pt(110)[lun94], which contrasts reported trapping mediated mechanism on Ni(100)[cam93]. On Ir(111) both mechanisms have been reported for 13CH4 and CD4 [jachim97].
2.2.2 Molecular beam
A large number of molecular beam experiments in which the dissociation energy was measured as a function of translational energy have already been done on many different surfaces. The first experiments were performed on W(110) and show that the sticking probability increases exponentially with the normal component of the incident translational energy [ret85, ret86]. This is in agreement with a direct dissociation mechanism, and is observed by all later molecular beam experiments (at the higher incident translational energies). It was also observed that vibrationally hot dissociates more readily than cold , with the energy in the internal vibrations being about as effective as the translational energy in inducing dissociation, which have been confirmed by studies on other surfaces: Ni(111)[lee87, hol96], Ni(100)[xxx13, hol95], Pt(111)[lun89], Pt(110)[walker99, walker00], and Ru(0001)[lar99]. There has been also measured a substantial kinetic isotope effect for CD4 compared with CH4 on W(110), which have been reported also on Ir(110)[ver93, ver94, ver95], Ni(100)[hol95], and Pt(111)[lun89]. This indicates again that the internal vibrational do play an important role in the dissociation mechanism. A more detailed assessment of the importance of the internal vibrations could not be made, because of the large number of internal vibrations. However, two models about the role of the internal coordinates have been suggested in relation with the experiments on Ni(111). By making use of EELS vibrational spectroscopy it is demonstrated that the initial step in the dissociation is the breaking of a single CH bond and the formation of adsorbed CH3 and H fragments [lee86, lee87, cey87]. One of the suggestions is the direct activation of the C–H bond, and another the so-called splats model [lee87]. The splats model suggests that the critical requirement for methane dissociation is angular deformation of methane which allows a Ni–C bond to form before a C–H bond breaks. In the splats model the increased transfer of translational kinetic energy to the bending and umbrella vibrational energy is responsible for the strong dependency on normal incident translational energy. This has been tested by inert gas atoms induced chemisorption [bec87, bec89, ceyer90]. Later studies on Ni(100) have related the enhancement of dissociation probability by nozzle temperature to the excitation of a general vibrational stretch mode [hol95].
A molecular beam experiment with laser excitation of the mode succeeded in measuring a dramatical enhancement of the dissociation on a Ni(100), which was still, however, much too low to account for the vibrational activation observed in previous studies. This indicates that other vibrationally excited modes contribute significantly to the reactivity of thermal samples [juur99, mcc00]. It has been shown also that the laser excitation of the mode can be used to deposit carbon on a sub-micrometer scale [juur00]. Later on, the effect of rotational excitation in combination with the vibrational mode was studied, which indicated that rotational excitation does not alter reactivity by more than a factor two [juur00b]. Very recently the effect of a 2 excitation on the methane dissociation probability on Pt(111) has been measured [higgins01]. They find that 72 kJ/mol of vibrational energy in the excited CH4 is approximately equivalent to at least 30 kJ/mol normal translational energy.
Although one does not expect strong surface temperature effects on the sticking probability for a direct dissociation mechanism, it has been reported anyway for some metal surfaces. It has been noticed for the first time by Ref. [lun89] on Pt(111), but it was not observed by Ref. [xxx11]. Later on surface temperature effects were observed on Ir(110)[see97, see97c], Ir(111)[see97b], and Pt(110)[walker99, walker00] at the lower incident translational energies.
There are further more some other molecular beam experiments, which studies the effect of adsorbate coverage on the dissociation probability; oxygen on Pt(111)[val96a], Pd(110)[val96b], and Pt(110)[walker00b]; and the effect of surface alloying coverage; Au on Ni(111)[hol96], Co on Cu(111)[lar98, lar98b], and K on Ni(100) and Ni(111)[beng99]. The dissociation probability of methane was also compared with higher alkanes [xxx13, mcmaster93, kel97, wea97, wea00].
Summarizing, we can say that the current opinion about methane dissociation on transition metals based on the beam molecular studies is as follow: The dissociation is dominated by a direct dissociation mechanism, because it is strongly dependent on translational energy. A trapping mediated mechanism can also play a role on some metals at low translational energies, because the dissociation probability is sometimes enhanced by the surface temperature. Vibrational excitation also enhances strongly the dissociation probability, which suggest a late barrier for dissociation. State resolved information has only been reported for the asymmetrical stretch mode. This mode enhances the dissociation probability, but another mode is possibly more reactive.
The scattering of methane has also been studied with molecular beams on Ag(111) [asada81, asada82], Pt(111) [yagyu99, yagyu99b, yagyu00, hiraoka00], and Cu(111) [Andersson00] surfaces. It was reported in Refs. [yagyu99, yagyu99b] that the scattering angles are in some cases anomalous with the outcome of the classical Hard cube model (HCM) described in Ref. [logan66]. We will show in Chapter 7 that the assumption of the HCM model are too crude for describing the processes obtained from our simulation. The time of flight experiments show that there is almost no vibrational excitation during the scattering [yagyu00, hiraoka00].
2.3 Theoretical studies
There are multiple ways to study a chemical reaction. One can simulate a model of the dynamics, or use transition state theory. For both methods it is necessary to obtain an idea of the interaction between particles in the system. Information of an interaction is theoretically expressed as the potential. The potential can be calculated empirical from fitting experimental data (dissociation energies, spectra, etc.) or from electronic structure calculation. If we want information about the thermodynamic properties of the system, then we only have to calculate the potential energies of the reactant and the products.
Reaction rates can be obtain with transition state theory. This means that we calculate the minimum energy path between reactants and products, which will give us the energy of the transition state. Transition state theory gives us only thermally average dissociation probabilities, which is useful if we have to deal with trapping mediated dissociation mechanism. The main assumption of transition state theory is that the available thermal energy will be distributed equally over all modes. This is not the case for molecular beam studies on a direct dissociation of methane on transition metal surfaces. The energy can be distributed unequally over translational, rotational, and vibrational modes. So it is not in thermal equilibrium. The best way to study theoretically in detail the contribution of kinetic energy available in specific modes to the reaction probability from the molecular beam experiments, is with molecular dynamics simulations. For an accurate molecular dynamics simulation we do not only need to know the minimum energy path, but also the potential energy of other possible paths (in other directions). The reaction path does not necessary have to be the minimum energy path, but can occur also over a higher barrier which is better accessible with the available kinetic energy. Non reactive paths are only important for calculating the reaction probability. This means that we need to calculate for more points the potential energy. We can construct with these points a potential energy surface (PES) in multiple dimensions. The number of points we can calculate is limited by the availability of computer resources. The number of points increases dramatically with the dimensionality of the dynamical system. Computer resources limits also the dimensionality and the time-scale of the dynamics simulation itself.
2.3.1 Electronic structure calculations
A convenient way of performing electronic structure calculations involving metal atoms is by using density functional theory (DFT). Full configurational interaction (CI) are too hard to perform, since the metal atoms in the surface model consist of too many electrons. The surface can be either modeled as a cluster of a few metal atoms or as a periodic slab consisting of a few layers of metal atoms.
The first electronic structure calculations of methane dissociation were self consisted field (SCF) calculations on Ni(111) and substitutional Fe/Ni(111) clusters [yan92, yan93]. We performed in our group DFT calculation on Ni and Co clusters [bur93a, bur93b, bur93c, bur94, bur95a, burghgraefPhD]. Others have done the same on various clusters of Ru, Os, Rh, Ir, Pd, Pt, Cu, Ag, and Au [au97, liao97, au98, au99].
DFT calculations on periodic slabs have studied the methane dissociation reaction on pure and gold-alloyed Ni(111) [kra96], Ni(100) and Ni(111) with preadsorbed potassium [beng99, watwe00], Ru(0001) [ciob99, ciob00], and Ir(111) [henkelman01] surfaces. The obtained transition state for CH4 dissociation on Ni(111) involves considerable internal excitation of the molecule [kra96]. The breaking of the C–H bond occurs preferentially on top of a Ni atom, with a dissociation barrier of about 100 kJ/mol. The reaction coordinate is mainly a C–H stretch.
There is also calculated a PES for the methyl radical and methane in interaction with nickel surfaces based on the embedded diatomics-in-molecules (EDIM) formalism, which involves mixing the semi-empirical diatomics-in-molecules (DIM) valence bond method for the covalent part of the system with the embedded atom method (EAM) for the metal [wonchoba98].
2.3.2 Dynamics simulations
Wave packet simulations are being used more and more to study the dynamics of molecule surface reactions. A lot of progress have been made over the decade especially for the reaction of H2 on metal surfaces [darling95, kroes99]. It is very interesting to simulate the dynamics of the dissociation, because of the direct dissociation mechanism, and the role of the internal vibrations. The published wave packet simulations on the methane dissociation reaction on transition metals have treated the methane molecule always as a diatomic up to now [har91, lun91, lun92, lun95, jan95, car98]. Besides the C–H bond and molecule surface distance, a combination of other coordinates were included, like (multiple) rotations and some lattice motion. None of them have looked at the role of the other internal vibrations.
The first model included the C–H bond, the molecule surface distance, and a dynamic surface. It has been used for comparison of molecular beam experiments of the dissociation of methane on Pt(111) [har91, lun91, lun92], and Ni(100) [lun95]. The second included a rotational degree of freedom, but left out the dynamical surface for a study on Ni(111) [jan95]. Both models found that the dissociation occurs via a tunneling mechanism.
The most recent wave packet simulation on the dissociation probability of CH4 and CD4 on Ni(100) used both a dynamic surface and rotational freedom. It showed a semiquantitative agreement between the theoretical results and the experiments of Ref. [hol95], except for the isotope effect and the extracted vibrational efficacy [car98]. One of the possible explanation of the incorrect isotope effect can be the role played by the non-included intramolecular vibrations.
Finally, I like to mention that there have also been performed some classical stochastic trajectory simulations [ukr94, sti96].
References
- [1] J. H. Larsen and I. Chorkendorff, Surf. Sci. Rep. 35, 163 (2000).
- [2] H. F. Winters, J. Chem. Phys. 62, 2454 (1975).
- [3] H. F. Winters, J. Chem. Phys. 64, 3495 (1976).
- [4] C. N. Stewart and G. Ehrlich, J. Chem. Phys. 62, 4672 (1975).
- [5] J. T. Yates, Jr., J. J. Zinck, S. Sheard, and W. H. Weinberg, J. Chem. Phys. 70, 2266 (1979).
- [6] S. B. Brass, D. A. Reed, and G. Ehrlich, J. Chem. Phys. 70, 5244 (1979).
- [7] S. B. Brass and G. Ehrlich, J. Chem. Phys. 87, 4285 (1987).
- [8] S. B. Brass and G. Ehrlich, Surf. Sci. 187, 21 (1987).
- [9] T. C. Lo and G. Ehrlich, Surf. Sci. 179, L19 (1987).
- [10] B. D. Kay and M. E. Coltrin, Surf. Sci. 198, L375 (1988).
- [11] B. D. Kay and M. E. Coltrin, Surf. Sci. 205, L805 (1988).
- [12] T. C. Lo and G. Ehrlich, Surf. Sci. 198, L380 (1988).
- [13] T. C. Lo and G. Ehrlich, Surf. Sci. 205, L813 (1988).
- [14] T. P. Beebe, Jr., D. W. Goodman, B. D. Kay, and J. T. Yates, Jr., J. Chem. Phys. 87, 2305 (1987).
- [15] I. Chorkendorff, I. Alstrup, and S. Ullmann, Surf. Sci. 227, 291 (1990).
- [16] B. Ø. Nielsen, A. C. Luntz, P. M. Holmblad, and I. Chorkendorff, Catal. Lett. 32, 15 (1995).
- [17] L. Hanley, Z. Xu, and J. T. Yates, Jr., Surf. Sci. Lett. 248, L265 (1991).
- [18] A. C. Luntz and H. F. Winters, J. Chem. Phys. 101, 10980 (1994).
- [19] R. A. Campbell, J. Szanyi, P. Lenz, and D. W. Goodman, Catal. Lett. 17, 39 (1993).
- [20] T. A. Jachimowski, C. J. Hagedorn, and W. H. Weinberg, Surf. Sci. 393, 126 (1997).
- [21] C. T. Rettner, H. E. Pfnür, and D. J. Auerbach, Phys. Rev. Lett. 54, 2716 (1985).
- [22] C. T. Rettner, H. E. Pfnür, and D. J. Auerbach, J. Chem. Phys. 84, 4163 (1986).
- [23] M. B. Lee, Q. Y. Yang, and S. T. Ceyer, J. Chem. Phys. 87, 2724 (1987).
- [24] P. M. Holmbad, J. H. Larsen, and I. Chorkendorff, J. Chem. Phys. 104, 7289 (1996).
- [25] A. V. Hamza and R. J. Madix, Surf. Sci. 179, 25 (1987).
- [26] P. M. Holmbad, J. Wambach, and I. Chorkendorff, J. Chem. Phys. 102, 8255 (1995).
- [27] A. C. Luntz and D. S. Bethune, J. Chem. Phys. 90, 1274 (1989).
- [28] A. V. Walker and D. A. King, Phys. Rev. Lett. 82, 5156 (1999).
- [29] A. V. Walker and D. A. King, J. Chem. Phys. 112, 4739 (2000).
- [30] J. H. Larsen, P. M. Holmblad, and I. Chorkendorff, J. Chem. Phys. 110, 2637 (1999).
- [31] R. W. Verhoef, D. Kelly, C. B. Mullins, and W. H. Weinberg, Surf. Sci. 287, 94 (1993).
- [32] R. W. Verhoef, D. Kelly, C. B. Mullins, and W. H. Weinberg, Surf. Sci. 311, 196 (1994).
- [33] R. W. Verhoef, D. Kelly, C. B. Mullins, and W. H. Weinberg, Surf. Sci. 325, 93 (1995).
- [34] M. B. Lee, Q. Y. Yang, S. L. Tang, and S. T. Ceyer, J. Chem. Phys. 85, 1693 (1986).
- [35] S. T. Ceyer, J. D. Beckerle, M. B. Lee, S. L. Tang, Q. Y. Yang, and M. A. Hines, J. Vac. Sci. Technol. A 5, 501 (1987).
- [36] J. D. Beckerle, Q. Y. Yang, A. D. Johnson, and S. T. Ceyer, J. Chem. Phys. 86, 7 (1987).
- [37] J. D. Beckerle, A. D. Johnson, Q. Y. Yang, and S. T. Ceyer, J. Chem. Phys. 91, 5756 (1989).
- [38] S. T. Ceyer, Science 249, 133 (1990).
- [39] L. B. F. Juurlink, P. R. McCabe, R. R. Smith, C. L. DiCologero, and A. L. Utz, Phys. Rev. Lett. 83, 868 (1999).
- [40] P. R. McCabe, L. B. F. Juurlink, and A. L. Utz, Rev. Sci. Instrum. 71, 42 (2000).
- [41] L. B. F. Juurlink, R. R. Smith, and A. L. Utz, J. Phys. Chem. B 104, 3327 (2000).
- [42] L. B. F. Juurlink, R. R. Smith, and A. L. Utz, Faraday Discuss. 117, 147 (2000).
- [43] J. Higgins, A. Conjusteau, G. Scoles, and S. L. Bernasek, J. Chem. Phys. 114, 5277 (2001).
- [44] G. R. Schoofs, C. R. Arumanayagam, M. C. McMaster, and R. J. Madix, Surf. Sci. 215, 1 (1989).
- [45] D. C. Seets, M. C. Wheeler, and C. B. Mullins, J. Chem. Phys. 107, 3986 (1997).
- [46] D. C. Seets, C. T. Reeves, B. A. Ferguson, and C. B. Mullins, Chem. Phys. Lett. 266, 431 (1997).
- [47] D. C. Seets, C. T. Reeves, B. A. Ferguson, M. C. Wheeler, and C. B. Mullins, J. Chem. Phys. 107, 10229 (1997).
- [48] M. Valden, N. Xiang, J. Pere, and M. Pessa, App. Surf. Sci. 99, 83 (1996).
- [49] M. Valden, J. Pere, N. Xiang, and M. Pessa, Chem. Phys. Lett. 257, 289 (1996).
- [50] A. V. Walker and D. A. King, Surf. Sci. 444, 1 (2000).
- [51] J. H. Larsen and I. Chorkendorff, Surf. Sci. 405, 62 (1998).
- [52] J. H. Larsen and I. Chorkendorff, Catal. Lett. 52, 1 (1998).
- [53] H. S. Bengaard, I. Alstrup, I. Chorkendorff, S. Ullmann, J. R. Rostrup-Nielsen, and J. K. Nørskov, J. Catal. 187, 238 (1999).
- [54] M. C. McMaster and R. J. Madix, J. Chem. Phys. 98, 9963 (1993).
- [55] D. Kelly and W. H. Weinberg, J. Vac. Sci. Technol. A 15, 1663 (1997).
- [56] J. F. Weaver, M. A. Krzyzowski, and R. J. Madix, Surf. Sci. 393, 150 (1997).
- [57] J. F. Weaver, M. A. Krzyzowski, and R. J. Madix, J. Chem. Phys. 112, 396 (2000).
- [58] H. Asada, Jpn. J. Appl. Phys. 20, 527 (1981).
- [59] H. Asada and T. Matsui, Jpn. J. Appl. Phys. 21, 259 (1982).
- [60] S. Yagyu, Y. Kino, K. Ozeki, and S. Yamamoto, Surf. Sci. 433-435, 779 (1999).
- [61] S. Yagyu, Y. Kino, T. Ikeuchi, T. Hiraoka, T. Kondo, and S. Yamamoto, Jpn. J. Appl. Phys. 38, 6910 (1999).
- [62] S. Yagyu, T. Hiraoka, Y. Kino, and S. Yamamoto, Appl. Surf. Sci. 165, 217 (2000).
- [63] T. Hiraoka, S. Yagyu, T. Kondo, T. Ikeuchi, and S. Yamamoto, Jpn. J. Appl. Phys. 39, 612 (2000).
- [64] T. Andersson, F. Althoff, P. Linde, M. Hassel, M. Persson, and S. Andersson, J. Chem. Phys. 113, 9262 (2000).
- [65] R. M. Logan and R. E. Stickney, J. Chem. Phys. 44, 195 (1966).
- [66] H. Yang and J. L. Whitten, J. Chem. Phys. 96, 5529 (1992).
- [67] H. Yang and J. L. Whitten, Surf. Sci. 289, 30 (1993).
- [68] H. Burghgraef, A. P. J. Jansen, and R. A. van Santen, J. Chem. Phys. 98, 8810 (1993).
- [69] H. Burghgraef, A. P. J. Jansen, and R. A. van Santen, Chem. Phys. 177, 407 (1993).
- [70] H. Burghgraef, A. P. J. Jansen, and R. A. van Santen, Faraday Discuss. 96, 337 (1993).
- [71] H. Burghgraef, A. P. J. Jansen, and R. A. van Santen, J. Chem. Phys. 101, 11012 (1994).
- [72] H. Burghgraef, A. P. J. Jansen, and R. A. van Santen, Surf. Sci. 324, 345 (1995).
- [73] H. Burghgraef, Ph.D. thesis, Eindhoven University of Technology, 1995.
- [74] C.-T. Au, M.-S. Liao, and C.-F. Ng, Chem. Phys. Lett. 267, 44 (1997).
- [75] M.-S. Liao, C.-T. Au, and C.-F. Ng, Chem. Phys. Lett. 272, 445 (1997).
- [76] C.-T. Au, M.-S. Liao, and C.-F. Ng, J. Phys. Chem. A 102, 3959 (1998).
- [77] C.-T. Au, C.-F. Ng, and M.-S. Liao, J. Catal. 185, 12 (1999).
- [78] P. Kratzer, B. Hammer, and J. K. Nørskov, J. Chem. Phys. 105, 5595 (1996).
- [79] R. M. Watwe, H. S. Bengaard, J. R. Rostrup-Nielsen, J. A. Dumesic, and J. K. Nørskov, J. Catal. 189, 16 (2000).
- [80] I. M. Ciobîcă, F. Frechard, R. A. van Santen, A. W. Kleyn, and J. Hafner, Chem. Phys. Lett. 311, 185 (1999).
- [81] I. M. Ciobîcă, F. Frechard, R. A. van Santen, A. W. Kleyn, and J. Hafner, J. Phys. Chem. B 104, 3364 (2000).
- [82] G. Henkelman and H. Jónsson, Phys. Rev. Lett. 86, 664 (2001).
- [83] S. E. Wonchoba and D. G. Truhlar, J. Phys. Chem. B 102, 6842 (1998).
- [84] G. R. Darling and S. Holloway, Rep. Prog. Phys. 58, 1595 (1995).
- [85] G.-J. Kroes, Prog. Surf. Sci. 60, 1 (1999).
- [86] J. Harris, J. Simon, A. C. Luntz, C. B. Mullins, and C. T. Rettner, Phys. Rev. Lett. 67, 652 (1991).
- [87] A. C. Luntz and J. Harris, Surf. Sci. 258, 397 (1991).
- [88] A. C. Luntz and J. Harris, J. Vac. Sci. A 10, 2292 (1992).
- [89] A. C. Luntz, J. Chem. Phys. 102, 8264 (1995).
- [90] A. P. J. Jansen and H. Burghgraef, Surf. Sci. 344, 149 (1995).
- [91] M.-N. Carré and B. Jackson, J. Chem. Phys. 108, 3722 (1998).
- [92] V. A. Ukraintsev and I. Harrison, J. Chem. Phys. 101, 1564 (1994).
- [93] J. A. Stinnett and R. J. Madix, J. Chem. Phys. 105, 1609 (1996).
Chapter 3 Wave packet simulations
We have used the multi-configurational time-dependent Hartree (MCTDH) method for our wave packet simulations, because it can deal with a large number of degrees of freedom and with large grids. We have developed four efficient model potentials for this method for studying the full vibrational scattering of oriented methane on a flat surface. We have described the MCTDH method and the model potentials for the simulations discussed in the next three chapters.
3.1 Introduction
Every wave packet simulation consist of three parts. First we have to define the potential energy surface (PES) and generate an intial state (wave packet) of the system. Secondly we have to propagate the wave packet during a certain time. Finally we have to analyse the final and intermediate states of the wave packets.
A general problem of computer simulations is that the size and simulation time of the system under study is limited by the available computational resources. Wave packet simulations are mainly limited by the number of dimensions, because the total number of grid point for the numerical integration scales with the product of the number of grid points per dimension. This means that we have to keep the system small (typically 6 dimensions or less) or we have to use a computational trick. We did both. We reduced the dimensionality to ten by leaving out three rotional and two translational coordinates of methane. The computational trick is that we used an approximation method for our wave packet propagation for which the total number of grid points scales with the sum of the number of grid points per dimension.
The published wave packet simulations on the methane dissociation reaction on transition metals have treated the methane molecule always as a diatomic up to now [har91, lun91, lun92, lun95, jan95, car98]. Besides the C–H bond and molecule surface distance, a combination of other coordinates were included, like (multiple) rotations and some lattice motion. None of them have looked at the role of the other internal vibrations.
We are not able yet to simulate the dissociation including all internal vibrations. Instead we have simulated the scattering of methane, for which all internal vibrations can be included. We deduce the consequences for the dissociation at of them. In this chapter I will give the theoretical background and computational details of our wave packet simulations of the scattering of fixed oriented methane on a flat surface described in the Chapters 4, 5, and 6. I describe our wave packet propagation method first. Then the various potential energy surfaces (PESs) that we have used are derived. (A harmonic intramolecular PES is adapted to include anharmonicities in the C–H/D distance, the decrease of C–H/D bond energy due to interactions with the surface, and the increase of C–H/D bond length also due to interactions with the surface.) I end with a description of the initial states.
3.2 The MCTDH Method
The multi-configurational time-dependent Hartree (MCTDH) method is an approximation method, which has like every approximation method advantages and disadvantages. Its main advantages are that it can be several orders of magnitude faster than conventional methods, and it requires a very small amount of memory. It is especially very usefull if it has to deal with large number of degrees of freedom and with large grids. The main disadvantage is that the MCTDH method requires the Hamiltonian to be expanded as a sum of products of one-particle operators. Normally the kinetic energy is already in the right form. The potential is often only in such a form when considering model problems. So most of the time it is necessary to transform a potential to MCTDH. Since the computation time grows linearly with the number of Hamiltonian terms, the MCTDH method can become slow, if an accurate transformation requires a lot of potential terms. Another drawback of this is that the MCTDH method is only fast if the time dependent wavepacket can be expanded into a small product basis set. The MCTDH method has been applied successfully to gas phase reactions and reactions at surfaces, and further method development is still going on [man92, jan93, man92b, man93, meyer93, ham94, fan94, fan95, fan95b, fan95c, liu95, cap95, eha96, wor96, jac96, man96, mat96, ger97a, ger97, bec97, jac98a, jac98b, wor98, mil98, meyer98, mat99, jac99, worth99, raab99, raab99b, raab00, raab00b, mil00a, mil00b, worth00, heitz01, burghardt01, worth01, beck01]. It has been reviewed recently in Ref. [bec00].
We give here a short overview of the MCTDH formalism for completeness. More details can be found in Refs. [man92] and [jan93]. The exact wave-function of a -dimensional system, is approximated by an expression of the form
| (3.1) |
From this expression, it is possible to obtain the equations of motion for the one-dimensional functions and for the correlation coefficients . Without loss of generality we can choose the ’s to be natural single-particle states [jan93]. They insure that we obtain the best approximation to the exact for a fixed number of configurations; i.e., they minimize the expression where
| (3.2) |
and where is the exact wave-function. The natural single-particle functions are eigenstates of the reduced density operators.
| (3.3) | |||
The equations of motions for the natural single-particle states can be obtained by differentiation of the eigenvalue equation:
| (3.4) |
This gives us
| (3.5) | |||||
where
| (3.6) |
and
| (3.7) |
with the Hamiltonian given by
| (3.8) |
The equations of motion for the coefficients
| (3.9) |
are again obtained by differentiation.
| (3.10) |
Equations (3.5) and (3.10) are a particular form of the more general equations obtained from a time-dependent variational principle [man92]. They conserve the norm of the wave-function and the mean energy of a time-independent Hamiltonian. The resulting system of first-order differential equations, has to be solved with a general-purpose integrator. We used the variable-order variable-step Adams method, as implemented in the NAG library [nag93]. This method gave good convergence for all described simulations. The singularities in Eqs. (3.5), (3.6), and (3.10) have been treated numerically by the regularization procedure described in Ref. [jan93].
The natural single-particle states have some small advantages over other possible choices of single-particle states. The most important one is that one can directly see from how well approximates the exact wave-function. How much a natural single-particle functions contributes to the wave-function is given by the eigenvalue of the reduced density matrix. In an approximate MCTDH simulation is an approximation for this exact eigenvalue. The natural single-particle functions are also convenient for interpreting the results of a simulations.
3.3 Potential energy surfaces
The PESs we used for our wavepacket simulations (as described in Chapters 4, 5, and 6) can all be written as
| (3.11) |
where is the intramolecular PES and is the repulsive interaction with the surface. For the we looked at four different types of PESs. Two of the four different PESs include changes in the intramolecular potential due to interactions with the surface in .
3.3.1 A harmonic potential
The first one is completely harmonic. We have used normal mode coordinates for the internal vibrations, because these are coupled only very weakly. In the harmonic approximation this coupling is even absent so that we can write as
| (3.12) |
the summation is over the internal vibrations, ’s are mass-weighted displacement coordinates and are mass-weighted force constants. (see Table 3.1 for definitions and values); ( is the mass-weighted overall translation along the surface normal) [wil55]. The force constants have been obtained by fitting them on the experimental vibrational frequencies of CH4 and CD4 [gray79, lee95].
| (CH4) | (CD4) | designation | Td | C3v | C2v | |
|---|---|---|---|---|---|---|
| translation | ||||||
| ; symmetrical stretch | ||||||
| ; umbrella | ||||||
| ; asymmetrical stretch | ||||||
| ; bending | ||||||
| ; bending | ||||||
| ; umbrella | ||||||
| ; umbrella | ||||||
| ; asymmetrical stretch | ||||||
| ; asymmetrical stretch |
We have assumed that the repulsive interaction with the surface is only through the hydrogen or deuterium atoms that point towards the surface. We take the -axis as the surface normal. In this case the surface PES is given by
| (3.13) |
where is the number of hydrogens or deuteriums that points towards the surface, =1.0726 atomic units and =6.4127 Hartree. These parameters are chosen to give the same repulsion as the PES that has been used in an MCTDH wavepacket simulation of CH4 dissociation [jan95].
If we write in terms of normal mode coordinates, then we obtain for one hydrogen or deuterium pointing towards the surface
| (3.14) |
where as above, and ’s as given in Tables 3.2 and 3.3. , and correspond all to modes of the C3v symmetry (see Fig. 3.1). There is no coupling between the modes to in the part of the PES, which are all modes of the C3v symmetry. Figure 3.2(a) shows a contour plot of the cross-section of the total harmonic PES with one hydrogen pointing towards the surface in the translational mode and the asymmetrical stretch mode .

| one | two | three | |
|---|---|---|---|
| one | two | three | |
|---|---|---|---|
For two hydrogens or deuteriums we obtain
| (3.15) | |||||
with again as above, ’s and ’s as given in Tables 3.2 and 3.3. , , and correspond all to modes of C2v. , , and correspond to and modes of C2v. corresponds to the mode of C2v and has no coupling with the other modes in .
For three hydrogens or deuteriums we obtain
| (3.16) | |||||
with again as above, ’s and ’s as given in Table 3.2 and 3.3. , and corresponds to modes in the C3v symmetry (see Fig. 3.1). Because these last six coordinates correspond to degenerate modes of the C3v symmetry, the parameters are not unique.

3.3.2 An anharmonic intramolecular potential
Even though we do not try to describe the dissociation of methane in this paper, we do want to determine which internal vibration might be important for this dissociation. The PES should at least allow the molecule to partially distort as when dissociating. The harmonic PES does not do this. A number of changes have therefor been made. The first is that we have describe the C–H/D bond by a Morse PES.
| (3.17) |
where Hartree (the dissociation energy of methane in the gas-phase) and the change in bond length from the equilibrium distance. was calculated by equating the second derivatives along one bond of the harmonic and the Morse PES. If we transform Eq. (3.17) back into normal mode coordinates, we obtain
| (3.18) |
with as above. ’s are given in Tables 3.4, 3.5, 3.6, and 3.7. Note that, although we have only changed the PES of the bond lengths, the umbrella modes are also affected. This is because these modes are not only bending, but also contain some changes of bond length.
| one | three | value |
|---|---|---|
| two | value |
|---|---|
| one | three | value |
|---|---|---|
| two | value |
|---|---|
The new intramolecular PES now becomes
| (3.19) |
where is as given in Eq. (3.12) and is the quadratic part of , which is already in . Figure 3.2(b) shows a contour plot of the cross-section of this total anharmonic PES with one hydrogen pointing towards the surface in the translational mode and the asymmetrical stretch mode . (We would like to point out that there are, of course, various anharmonic PESs for methane in the literature. There are two reasons why we haven’t use them. First, these PESs are not in appropriate form to use then with the MCTDH method [man92, jan93]. Second, these PESs are generally quite complicated. We prefer to keep it as simple as possible, because at this moment we’re only interested in qualitative effects.)
3.3.3 Intramolecular potential with weakening bonds
When the methane molecule approach the surface the overlap of substrate orbitals and anti-bonding orbitals of the molecule weakens the C–H bonds. We want to include this effect for the C–H bonds of the hydrogens pointing towards the surface. We have redefined the given in Eq. (3.18) and also replace it in Eq. (3.19). A sigmoidal function is used to switch from the gas phase C–H bond to a bond close to the surface. We have used the following, somewhat arbitrary, approximations. (i) The point of inflection should be at a reasonable distance from the surface. It is set to the turnaround point for a rigid methane molecule with translation energy 93.2 kJ/mol plus twice the fall-off distance of the interaction with the surface. (ii) The depth of the PES of the C–H bond is 480 kJ/mol in the gas phase, but only 93.2 kJ/mol near the surface. The value 93.2 kJ/mol corresponds to the height of the activation barrier used in our dissociation [jan95]. (iii) The exponential factor is the same as for the interaction with the surface.
If we transform to normal-mode coordinates for the particular orientations, we then obtain
| (3.20) |
where for non-interacting bonds and
| (3.21) |
for the interacting bonds pointing towards the surface. is as given in Table 3.2, ’s are given in Tables 3.4, 3.5, 3.6, and 3.7, and . Figure 3.2(c) shows a contour plot of the cross-section of this total anharmonic PES with weakening C–H bond for the orientation with one hydrogen pointing towards the surface in the translational mode and the asymmetrical stretch mode .
3.3.4 Intramolecular potential with elongation of the bond
A weakened bond generally has not only a reduced bond strength, but also an increased bond length. We include the effect of the elongation of the C–H/D bond length of the hydrogens or deuteriums that point towards the surface due to interactions with the surface. We have redefined the given in Eq. (3.18) and also replace it in Eq. (3.19) for this type of PES. We have used the following approximations: (i) The transition state, as determined by Refs.[bur93b, bur93c], has a C–H bond that is 0.54 Å longer than normal. This elongation should occur at the turn around point for a rigid methane molecule with a translation energy of 93.2 kJ/mol. (ii) The exponential factor is again the same as for the interaction with the surface.
If we transform to normal-mode coordinates for the particular orientations, then we obtain
| (3.22) |
where is as given in Tables 3.2 and 3.3, ’s are given in Tables 3.4, 3.5, 3.6, and 3.7. For orientation with one hydrogen or deuterium towards the surface we obtain; and , with two hydrogens or deuteriums; and , and with three hydrogens or deuteriums; and . Figure 3.2(d) shows a contour plot of the cross-section of this total anharmonic PES with elongation of the C–H bond for the orientation with one hydrogen pointing towards the surface in the translational mode and the asymmetrical stretch mode , and Fig. 3.3 shows a contour plot of a cross-section in the translational and the symmetrical stretch mode in the three different orientations.

Finally we like to note that the monotonic behaviour of all PES types in the translational mode does not contradict with the fact that the dissociative adsorption of methane is activated. The activation barrier for dissociative adsorption in the translational mode is situated in a region with very high excitations of the stretch modes, which we do not reach in these simulations.
3.4 Initial States
All initial states in the simulations start with the vibrational ground state. The initial translational part is represented by a Gaussian wave-packet,
| (3.23) |
where is the width of the wave-packet (we used atomic units), is the initial position (we used , which is far enough from the surface to observe no repulsion) and is the initial momentum. We performed simulations in the energy range of 32 to 96 kJ/mol. We present in Chapters 4 and 5 only the results of 96 kJ/mol (equivalent to atomic units), because they showed the most obvious excitation probabilities for . We used seven natural single-particle states, 512 grid points and a grid-length of for the translational coordinate. With this grid-width we can perform simulation with a translational energy up to 144 kJ/mol.
Gauss-Hermite discrete-variable representations (DVR) [light85] were used to represent the wavepackets of the vibrational modes. We used for all simulations 5 DVR points for the bending modes and 8 DVR points for the umbrella, asymmetrical stretch, and symmetrical stretch mode for an numerical exact integration, except for the simulations with , where we used 16 DVR points for the symmetrical stretch mode, because of the change in the equilibrium position.
We did the simulation with one hydrogen pointing towards the surface in eight dimensions, because the bending modes and do not couple with the other modes. We needed four natural single-particle states for modes , and , and just one for the others. So the number of configurations was . The simulation with two hydrogens pointing towards the surface was performed in nine dimensions. One of the bending mode () does not couple with the other modes, but for the other mode we needed four natural single-particle states. The number of configurations was , because we needed the same number of natural single-particle states as mentioned above for the other modes. We needed ten dimensions to perform the simulation with three hydrogens pointing towards the surface. We used here one natural single-particle state for the modes to and four natural single-particle states for to , which gave us configurations.
References
- [1] J. Harris, J. Simon, A. C. Luntz, C. B. Mullins, and C. T. Rettner, Phys. Rev. Lett. 67, 652 (1991).
- [2] A. C. Luntz and J. Harris, Surf. Sci. 258, 397 (1991).
- [3] A. C. Luntz and J. Harris, J. Vac. Sci. A 10, 2292 (1992).
- [4] A. C. Luntz, J. Chem. Phys. 102, 8264 (1995).
- [5] A. P. J. Jansen and H. Burghgraef, Surf. Sci. 344, 149 (1995).
- [6] M.-N. Carré and B. Jackson, J. Chem. Phys. 108, 3722 (1998).
- [7] U. Manthe, H.-D. Meyer, and L. S. Cederbaum, J. Chem. Phys. 97, 3199 (1992).
- [8] A. P. J. Jansen, J. Chem. Phys. 99, 4055 (1993).
- [9] U. Manthe, H.-D. Meyer, and L. S. Cederbaum, J. Chem. Phys. 97, 9062 (1992).
- [10] U. Manthe and A. D. Hammerich, Chem. Phys. Lett. 211, 7 (1993).
- [11] H.-D. Meyer, U. Manthe, and L. S. Cederbaum, in Numerical Grid Methods and their Applications to Schrödinger’s Equations, edited by C. Cerjan (Kluwer Academic Publishers, Dordrecht, 1993), Chap. The multiconfigurational Hartree approach, pp. 141–152.
- [12] A. D. Hammerich, U. Manthe, R. Kosloff, H.-D. Meyer, and L. S. Cederbaum, J. Chem. Phys. 101, 5623 (1994).
- [13] J.-Y. Fang and H. Guo, J. Chem. Phys. 101, 5831 (1994).
- [14] J.-Y. Fang and H. Guo, Chem. Phys. Lett. 235, 341 (1995).
- [15] J.-Y. Fang and H. Guo, J. Chem. Phys. 102, 1944 (1995).
- [16] J.-Y. Fang and H. Guo, J. Mol. Struct. (Theochem) 341, 201 (1995).
- [17] L. Liu, J.-Y. Fang, and H. Guo, J. Chem. Phys. 102, 2404 (1995).
- [18] A. Capellini and A. P. J. Jansen, J. Chem. Phys. 104, 3366 (1996).
- [19] M. Ehara, H.-D. Meyer, and L. S. Cederbaum, J. Chem. Phys. 105, 8865 (1996).
- [20] G. A. Worth, H.-D. Meyer, and L. S. Cederbaum, J. Chem. Phys. 105, 4412 (1996).
- [21] A. Jäckle and H.-D. Meyer, J. Chem. Phys. 105, 6778 (1996).
- [22] U. Manthe and F. Matzkies, Chem. Phys. Lett. 252, 71 (1996).
- [23] F. Matzkies and U. Manthe, J. Chem. Phys. 106, 2646 (1997).
- [24] T. Gerdts and U. Manthe, J. Chem. Phys. 106, 3017 (1997).
- [25] T. Gerdts and U. Manthe, J. Chem. Phys. 107, 6584 (1997).
- [26] M. H. Beck and H.-D. Meyer, Z. Phys. D 42, 113 (1997).
- [27] A. Jäckle and H.-D. Meyer, J. Chem. Phys. 109, 2614 (1998).
- [28] A. Jäckle and H.-D. Meyer, J. Chem. Phys. 109, 3772 (1998).
- [29] G. A. Worth, H.-D. Meyer, and L. S. Cederbaum, J. Chem. Phys. 109, 3518 (1998).
- [30] R. Milot and A. P. J. Jansen, J. Chem. Phys. 109, 1966 (1998).
- [31] H.-D. Meyer, in The Encyclopedia of Computanional Chemistry, edited by P. V. R. Schleyer (John Wiley and Sons, Chicester, 1998), Chap. Multiconfigurational time-dependent Hartree method.
- [32] F. Matzkies and U. Manthe, J. Chem. Phys. 110, 88 (1999).
- [33] A. Jäckle, M.-C. Heitz, and H.-D. Meyer, J. Chem. Phys. 110, 241 (1999).
- [34] G. A. Worth, H.-D. Meyer, and L. S. Cederbaum, Chem. Phys. Lett. 299, 451 (1999).
- [35] A. Raab, G. A. Worth, H.-D. Meyer, and L. S. Cederbaum, J. Chem. Phys. 110, 936 (1999).
- [36] A. Raab, I. Burghardt, and H.-D. Meyer, J. Chem. Phys. 111, 8759 (1999).
- [37] A. Raab and H.-D. Meyer, J. Chem. Phys. 112, 10718 (2000).
- [38] A. Raab and H.-D. Meyer, Theo. Chem. Acc. 104, 358 (2000).
- [39] R. Milot and A. P. J. Jansen, Surf. Sci. 452, 179 (2000).
- [40] R. Milot and A. P. J. Jansen, Phys. Rev. B 61, 15657 (2000).
- [41] G. A. Worth, J. Chem. Phys. 112, 8322 (2000).
- [42] M.-C. Heitz and H.-D. Meyer, J. Chem. Phys. 114, 1382 (2001).
- [43] I. Burghardt, J. Chem. Phys. 114, 89 (2001).
- [44] G. A. Worth, J. Chem. Phys. 114, 1524 (2001).
- [45] M. H. Beck and H.-D. Meyer, J. Chem. Phys. 114, 2036 (2001).
- [46] M. H. Beck, A. Jäckle, G. A. Worth, and H.-D. Meyer, Phys. Rep. 324, 1 (2000).
- [47] The NAG Fortran Library Manual, Mark 16 (NAG Ltd., Oxford, 1993), Vol. 2, routine D02CBF.
- [48] E. B. Wilson, J. C. Decius, and P. C. Cross, Molecular Vibrations. The Theory of Infrared and Raman Spectra. (McGraw-Hill, London, 1955).
- [49] D. L. Gray and A. G. Robiette, Mol. Phys. 37, 1901 (1979).
- [50] T. J. Lee, J. M. L. Martin, and P. R. Taylor, J. Chem. Phys. 102, 254 (1995).
- [51] H. Burghgraef, A. P. J. Jansen, and R. A. van Santen, Chem. Phys. 177, 407 (1993).
- [52] H. Burghgraef, A. P. J. Jansen, and R. A. van Santen, Faraday Discuss. 96, 337 (1993).
- [53] J. C. Light, I. P. Hamilton, and J. V. Lill, J. Chem. Phys. 82, 1400 (1985).
Chapter 4 Vibrational scattering of methane
We present results of wavepacket simulations of scattering of an oriented methane molecule from a flat surface including all nine internal vibrations. At a translational energy up to 96 kJ/mol we find that the scattering is almost completely elastic. Vibrational excitations when the molecule hits the surface and the corresponding deformation depend on generic features of the potential energy surface. In particular, our simulation indicate that for methane to dissociate the interaction of the molecule with the surface should lead to an elongated equilibrium C–H bond length close to the surface.***This chapter has been published as a part of Ten-dimensional wave packet simulations of methane scattering [mil98], © 1998 American Institute of Physics.
4.1 Introduction
At the time I started my research, our group had just performed a multi-configurational time-dependent Hartree (MCTDH) study of CH4 dissociation on Ni(111)[jan95] with a potential energy surface (PES) based on earlier density functional theory (DFT) calculations within the group [bur93a, bur93b, bur93c, bur94, bur95a]. The simulations included the distance of the methane molecule to the surface, a C–H distance, and the orientation of methane as coordinates. Previous wavepacket simulations focused on the molecule-surface and C–H distance too, and combination it with lattice motion on several metals[lun91, lun92, lun95]. When I finished the simulations described in this chapter, a wave packet simulation of methane dissociation on a Ni(111) atop site including all these coordinates [car98]. None of the wavepacket simulations published so far have looked at the role of the internal vibrations of methane. It was observed experimentally at the time that vibrationally hot dissociates more readily than cold , with the energy in the internal vibrations being about as effective as the translational energy in inducing dissociation [ret85, ret86, lee87, hol95, lun89]. However, a more detailed assessment of the importance of the internal vibrations could not be made, because of the large number of internal vibrations. A DFT calculation at that time also showed that the transition state for CH4 dissociation on Ni(111) involves considerable internal excitation of the molecule [kra96].
In this chapter we report on wavepacket simulations that we have done to determine which and to what extent internal vibrations are important for the dissociation of methane on transition-metals. We are not able yet to simulate the dissociation including all internal vibrations. Instead we have simulated the scattering of methane, for which all internal vibrations can be included. By looking at vibrational excitations and the deformation of the molecule when it hits the surface we can derive information that is relevant for the dissociation. We have used model PESs that have been developed with Ni(111) in mind, but our results should hold for other surfaces as well. The various model PESs we have derived are described in Section 3.3 of this thesis. A harmonic intramolecular PES [, see Eq.(3.12)] is adapted to include anharmonicities in the C–H distance [, see Eq.(3.18)], the decrease of the C–H bond energy due to interactions with the surface [, see Eq.(3.20)], and the increase of the C–H bond length also due to interactions with the surface [, see Eq.(3.22)]. We have used the multi-configurational time-dependent Hartree (MCTDH) method for our wave packet simulation [man92, jan93]. This method can deal with a large number of degrees of freedom and with large grids. (See Ref. [bec00] for a recent review, or Section 3.2 of this thesis for a survey.) Initial translational energy has been chosen in the range of 32 to 96 kJ/mol. We present only the results of the simualtions at 96 kJ/mol here (equivalent to mass-weighted atomic units), because they showed the most obvious excitation probabilties for . The initial state has been written as a product state of ten functions; one for the normally incident translational coordinate, and one for each internal vibration. All vibrations were taken to be in the ground state. Grid methods, number of points, and the configurational basis have been described in Section 3.4. The results of the simulations are presented and discussed next. We focus on excitation probabilities and deformation of the molecule when it hits the surface. The implications for the dissociation are discussed separately. We end with a summary and some general conclusions.
4.2 Scatter Probabilities
We found that the scattering is predominantly elastic. The elastic scattering probability is larger than 0.99 for all orientations and PESs at a translational energy of 96 kJ/mol, except for the PES with and three hydrogens pointing towards the surface for which it is 0.956. This agrees with the observation that the translation-vibration coupling is generally small[lev87].
If we would have wanted to determine the role of the internal vibrations from the scattering probabilities, we would have to do quite accurate simulations. We have opted instead to look at the molecule when it hits the surface, which enables us to obtain good results with much less costly simulations.
4.3 Excitation Probabilities
The surface PES has C3v (with one or three hydrogens towards the surface) or C2v symmetry (with two hydrogens towards the surface). If we expand this PES in a Taylor-series of internal vibrations, we see that the linear terms contain only those vibrations that transform as in C3v, respectively, C2v. These are therefore easier to excite than others; We did not find any appreciable excitation of modes of C3v and the , , and modes of C2v.
We will not present results of the simulations with the harmonic PES, because they give almost the same excitation probabilities as the PES with . The maximum excitation probabilities at the surface for the PES with are given in Table 4.1. We have observed the highest excitations for this PES in the umbrella and bending modes in the orientation with two hydrogens, and for the umbrella mode in the orientation with three hydrogens pointing towards the surface. The excitation probabilities for the and stretch modes at this orientations are a factor of magnitude lower.
| orientation | PES | ||||
|---|---|---|---|---|---|
| stretch | bending | stretch | umbrella | ||
| one | Morse | 0.023 | 0.054 | 0.030 | |
| weak | 0.135 | 0.308 | 0.075 | ||
| shift | 0.340 | 0.727 | 0.067 | ||
| two | Morse | 0.010 | 0.108 | 0.009 | 0.104 |
| weak | 0.067 | 0.135 | 0.073 | 0.107 | |
| shift | 0.707 | 0.065 | 0.768 | 0.331 | |
| three | Morse | 0.003 | 0.006 | 0.102 | |
| weak | 0.038 | 0.019 | 0.208 | ||
| shift | 0.819 | 0.674 | 0.214 |
We have observed higher excitation probabilities for the and stretch modes in the one hydrogen orientation. The excitation probability of the umbrella mode is here lower then for the other orientations, but still in the same order as the stretch modes for this orientation. This can be explained by the values of the ’s of [see Table 3.2] and the force constants of [see Table 3.1], because is approximately for the ground state. The force constants of for the symmetrical stretch and asymmetrical stretch are of the same order, but the parameter in in the orientation with one hydrogen pointing towards the surface for the asymmetrical stretch is around twice as large as for the symmetrical stretch, which explains why is more excited as . The surface repulsion on the umbrella mode is even three times lower then on the symmetrical stretch mode, but the force constant is also much lower. It results in a little more excitation of the umbrella then in the symmetrical stretch.
For the orientation with two hydrogens pointing towards the surface the repulsion on the vibrational modes is for all modes in the same order ( bending a little higher), so the difference in excitation probabilities correlate here primarily with the force constants. The force constants of the bending and umbrella modes are of the same order, as are those of and . The stretch force constants are higher, however, so that the excitation probabilities are lower. The repulsion on the umbrella mode is the largest in the orientation with three hydrogens pointing towards the surface. The force constants is lower for this modes then for the and stretch modes, so the primary excitation is seen in the umbrella mode.
For the orientation with three hydrogens pointing towards the surface the repulsion on the umbrella mode is the highest in combination with a low force constant, so this mode has a much higher excitation probability than the and stretch modes. Another interesting detail is that the parameter is higher for the orientation with two than with three hydrogens pointing toward the surface, but the excitation probabilities for the umbrella in this orientations are equal. This is caused by a coupling between the excitation of the bending and the umbrella mode in the orientation with two hydrogens pointing towards the surface.
We observed with [see Table 4.1] that all excitation probabilities become much higher than with , except for the umbrella mode with two hydrogens towards the surface, which stays almost the same. It is caused by the fact that, although the symmetrical stretch and asymmetrical stretch contribute almost completely to , the umbrella does so just for a small part. The umbrella contributes primarily, and the bending completely, to the harmonic terms of intramolecular PES . gives only a lowering in the terms of , so we should expect primarily an higher excitation probability in the and stretch modes. This will also cause a higher excitation probability of the other modes, because the turn-around point will be some what later, which give effectively more repulsion on the other modes.
We also observed that for both stretches the excitation probabilities shows the following trend; three hydrogens two hydrogens one hydrogen pointing towards the surface. For one hydrogen pointing towards the surface the excitation probability of the asymmetrical stretch is around twice that of the symmetrical stretch, they are almost equal for two hydrogens, and for three hydrogens the is twice the stretch. Some of these trends can also be found for the PES with , but are not always that obvious. They follow the same trends as the parameters of in Table 3.2.
[see Table 4.1] gives also higher excitation probabilities for almost all modes than , but for the bending mode in the two hydrogens pointing towards the surface orientation it became lower. This means that the repulsion of the surface is here caused for a large part by the terms [see Eq. (3.22)], where the bending modes don’t contribute. It is also in agreement with the fact that we have observed the excitation maximum earlier, so the repulsion on the bending modes will be lower. Fig. 3.2 shows that the repulsion for the PES with is stronger than for the other three PESs.
The excitations in the and stretch modes are extremely high with , because they contribute strongly to the C–H bond elongation. The trend in the excitation probabilities of the symmetrical stretch mode is caused by the number of bonds pointing towards the surface, because the parameters are for all bonds and orientations the same, so only the strength of the coupling with the shift-factor dominates. This effect is illustrated in Fig. 3.3. We didn’t observe this trend in the asymmetrical stretch mode, because there is also difference between the parameters as can be seen in Table 3.4 and 3.5.
4.4 Structure Deformation
If we put the methane molecule far from the surface, then all PESs are identical. For this situation we calculated a bond distance of 1.165 Å and bond angle of 109.5 degrees in the ground state. The results of the maximum structure deformations are shown in the Table 4.2. Figure 4.1 shows the names of the bonds and angles for the three orientations.
| Orientation | PES | |||||
|---|---|---|---|---|---|---|
| gas phase | all | 1.165 | 109.5 | |||
| one | Morse | 1.123 | 1.166 | 108.5 | 110.4 | |
| weak | 1.051 | 1.167 | 108.2 | 110.7 | ||
| shift | 1.397 | 1.158 | 109.9 | 109.0 | ||
| two | Morse | 1.157 | 1.165 | 116.7 | 108.9 | 107.8 |
| weak | 1.137 | 1.163 | 117.6 | 109.0 | 107.5 | |
| shift | 1.386 | 1.159 | 115.7 | 106.9 | 108.5 | |
| three | Morse | 1.164 | 1.160 | 111.2 | 107.7 | |
| weak | 1.167 | 1.155 | 112.4 | 106.3 | ||
| shift | 1.389 | 1.144 | 111.2 | 107.7 |
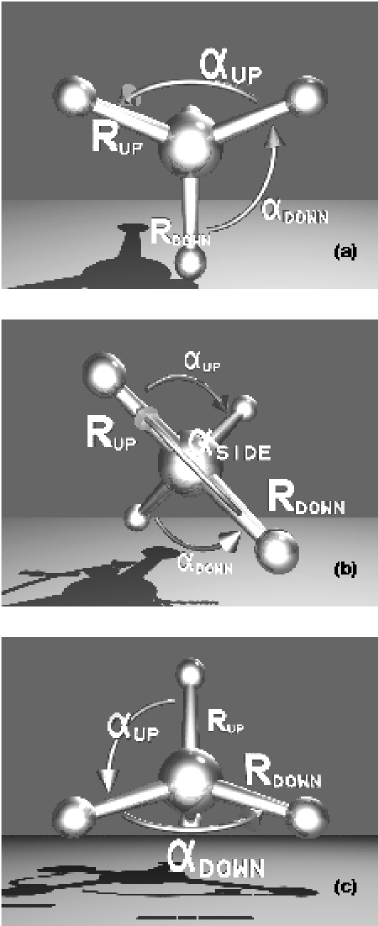
We observed that the PESs with and give again the same trends, but that for the PES with these trends are much stronger. This is in agreement with the observations discussed for the excitation probabilities above. The deformations for the PES with are dominated by the change of the bond distances for the bonds which are pointing towards the surface. These bonds become longer for all orientations in the same order. So there is no orientational effect and this will be probably caused completely by the terms [see Eq. (3.22)].
For the orientation with one hydrogen pointing towards the surface [see Table 4.2], we observed that the bond pointing towards the surface becomes shorter, as expected, for the PES with and even more with . This is caused by the repulsion of the terms, which works in the direction of the bond axes. We observed also some small bond angle deformation. This is probably a secondary effect of the change in the bond distance and correlates to excitation of the umbrella mode. Remarkably, for the bond length increases. Clearly the effect of the change in equilibrium bond length is more effective than the repulsion with the surface. The shift effect may be somewhat too large, but the observed change (0.232 Å) is much lower than the shift of the equilibrium (0.54 Å) on which we fitted .
We also observed for all orientations with an earlier turn-around point, which is in agreement with the earlier observed excitation maximum. This is caused by the extra repulsion contribution in the terms and by the longer bond length; a longer bond gives a higher repulsion for the same position of the center of mass. Fig. 3.2 shows this effect in the asymmetrical stretch mode.
The orientation with two hydrogens pointing towards the surface [see Table 4.2] gives also shorter bond distances for the bonds pointing towards the surface for the PESs with and , although very little in comparison to the one hydrogen orientation. We expected this, because just half of the repulsion is now in the direction of the bonds. The other half is perpendicular on the C–H bonds and this makes the bond angle larger. The bond angles between the bonds pointing towards the surface show a quite large deformation. This was already expected from the excitation of the bending and umbrella modes.
We also observed that a smaller bond length of the bonds pointing towards the surface correlates with a larger bond angle of the angles between the bonds pointing towards the surface and a higher excitation probability of the bending mode. This can be explained as follows. When the bonds become shorter the center of mass can come closer to the surface. Because of this there will be more repulsion on the bending mode, which will cause a larger bond angle deformation.
Most of the deformations of the other bond angles can be explained as an indirect effect of the deformation of this bond angle, but the deformation of the angle between the bonds pointing away from the surface which was seen at the PES with must be caused by the excitation of the umbrella mode.
We observed almost no change in bond length for the PESs with and at the three hydrogens towards the surface orientation [see Table 4.2]. Almost all energy is absorbed by the umbrella mode, so this gives quite large bond angle deformations. The bond angle deformation is larger for the PES with than with PES; in agreement with higher excitation probability for the PES with . The PES with has around the same excitation probabilities for the umbrella mode as the PES with , but the bond angle deformation is the same as for the PES with . This may be caused by the higher excitations of the and stretch modes and the longer bonds pointing towards the surface at the PES with , which can make it harder to deform the bond angles.
4.5 Dissociation models
Several dissociation mechanisms for direct methane dissociation on transition metals have been suggested. All proposals can be related to two main ideas. One of them is the breaking of a single C–H bond in the initial collision.[lee87, lun91] This model is most suggested in literature and also all wavepacket simulations have focussed on the effects of this model.[jan95, lun91, lun92, lun95, car98] The other mechanism is often called “splats” and suggests that the critical requirement for methane dissociation is angular deformation of methane which allows a Ni–C bond to form.[lee87] Even though we did not try to describe the dissociation itself, we would like to discuss the implication of our simulation for the dissociation.
The “splats” model seems easiest to discuss. Angular deformation is related to the bending and the umbrella mode. The excitation probabilities in Table 4.1 seem to indicate that these modes are easy to excite, and that angular deformation should be large. These excitation probabilities are misleading, however. Table 4.2 shows that, although the excitation probabilities depend on the PES, the changes in the bond angles do not. Moreover, these changes are quite small. They are largest for the orientation with two hydrogen atoms pointing towards to surface, for which they are about degrees at most. This seems much too small to enable the formation of a Ni–C bond. A previous estimate of the bond angle deformation gave an energy of kJ/mol to get three hydrogens and the carbon in one plane. This correspond to a bond angle of degrees.[lee87] We find with three hydrogens pointing towards the surface that the bond angle only changes to about degrees at the higher energy of kJ/mol. The reason for this difference is that for the older estimate it was assumed that all translational energy can be used to deform the bond angle, whereas Tables 4.1 and 4.2 clearly show that this is not correct.
The excitation probabilities for the stretch modes depend strongly on the orientation of the molecule and on the PES. For the PESs without a change of the equilibrium bond length the excitation probabilities are only appreciably with one hydrogen pointing towards the surface. This is, however, not a favourable orientation for the dissociation. Moreover, Table 4.2 shows that in those cases the repulsion with the surface shortens the C–H bond. The same holds for the orientation with two hydrogens pointing towards the surface, although to a lesser extent, whereas the bond length changes hardly at all with three hydrogens pointing towards the surface. This indicates that the intramolecular PES needs the bond elongation to overcome the repulsion of the surface that shortens the C–H bond, and to get dissociation. This agrees completely with electronic structure calculations that yield a late barrier for dissociation with a very elongated C–H bond.[bur93a, kra96] The large excitation probabilities for the PES with the elongated equilibrium bond length should not be over-interpreted, however. They are to be expected even if the molecule stays in its (shifted) vibrational ground state. More telling is that for this PES we do find at least some inelastic scattering.
4.6 Conclusions
We have done wavepacket simulations on the scattering of methane from a flat Ni(111) model surface with a fixed orientation with one, two, or three hydrogens pointing towards the surface. We used the MCTDH method and four different model PESs for each orientation. We used a translational energy of up to kJ/mol and all internal vibrations in the ground state. The scattering was in all cases predominantly elastic.
When the molecule hits the surface, we always observe vibrational excitations of the umbrella and bending modes, especially in the orientations with two or three hydrogens pointing towards the surface. This is due to a favorable coupling that originates from the repulsive interaction with the surface, and the low excitation energies. Deformations of the molecule are predominantly in the bond angles. The changes in the bond angles are, however, too small to allow for the formation of a Ni–C bond, as suggested in the “splats” model of methane dissociation.
Appreciable excitations of the and stretch modes when methane hits the surface are only observed when one hydrogen atom points towards the surface, or when the intramolecular PES has an elongated equilibrium C–H bond length close to the surface. The repulsion of the surface shortens the C–H bond. This can only be overcome when the intramolecular PES incorporates the effect of a longer equilibrium C–H bond length caused by overlap of occupied surface orbitals with the antibonding orbitals of methane. This agrees with quantum chemical calculations, which show a late barrier for dissociation.
The simulations with these model PESs show that the internal vibrations play an important role in the dissociation mechanism. Excitation probabilities when the molecule hits the surface show how the translational energy is converted into vibrational energy and it is distributed over the internal modes. These probabilities vary strongly with the PES. As only few internal vibrations contribute to the dissociation, it is important to obtain more information on the real PES for this system.
References
- [1] R. Milot and A. P. J. Jansen, J. Chem. Phys. 109, 1966 (1998).
- [2] A. P. J. Jansen and H. Burghgraef, Surf. Sci. 344, 149 (1995).
- [3] H. Burghgraef, A. P. J. Jansen, and R. A. van Santen, J. Chem. Phys. 98, 8810 (1993).
- [4] H. Burghgraef, A. P. J. Jansen, and R. A. van Santen, Chem. Phys. 177, 407 (1993).
- [5] H. Burghgraef, A. P. J. Jansen, and R. A. van Santen, Faraday Discuss. 96, 337 (1993).
- [6] H. Burghgraef, A. P. J. Jansen, and R. A. van Santen, J. Chem. Phys. 101, 11012 (1994).
- [7] H. Burghgraef, A. P. J. Jansen, and R. A. van Santen, Surf. Sci. 324, 345 (1995).
- [8] A. C. Luntz and J. Harris, Surf. Sci. 258, 397 (1991).
- [9] A. C. Luntz and J. Harris, J. Vac. Sci. A 10, 2292 (1992).
- [10] A. C. Luntz, J. Chem. Phys. 102, 8264 (1995).
- [11] M.-N. Carré and B. Jackson, J. Chem. Phys. 108, 3722 (1998).
- [12] C. T. Rettner, H. E. Pfnür, and D. J. Auerbach, Phys. Rev. Lett. 54, 2716 (1985).
- [13] C. T. Rettner, H. E. Pfnür, and D. J. Auerbach, J. Chem. Phys. 84, 4163 (1986).
- [14] M. B. Lee, Q. Y. Yang, and S. T. Ceyer, J. Chem. Phys. 87, 2724 (1987).
- [15] P. M. Holmbad, J. Wambach, and I. Chorkendorff, J. Chem. Phys. 102, 8255 (1995).
- [16] A. C. Luntz and D. S. Bethune, J. Chem. Phys. 90, 1274 (1989).
- [17] P. Kratzer, B. Hammer, and J. K. Nørskov, J. Chem. Phys. 105, 5595 (1996).
- [18] U. Manthe, H.-D. Meyer, and L. S. Cederbaum, J. Chem. Phys. 97, 3199 (1992).
- [19] A. P. J. Jansen, J. Chem. Phys. 99, 4055 (1993).
- [20] M. H. Beck, A. Jäckle, G. A. Worth, and H.-D. Meyer, Phys. Rep. 324, 1 (2000).
- [21] R. D. Levine and R. B. Bernstein, Molecular Reaction Dynamics and Chemical Reactivity (Oxford University Press, Oxford, 1987).
Chapter 5 The isotope effect
The isotope effect in the scattering of methane is studied by wave packet simulations of oriented CH4 and CD4 molecules from a flat surface including all nine internal vibrations. At a translational energy up to 96 kJ/mol we find that the scattering is still predominantly elastic, but less so for CD4. Energy distribution analysis of the kinetic energy per mode and the potential energy surface terms, when the molecule hits the surface, are used in combination with vibrational excitations and the corresponding deformation. They indicate that the orientation with three bonds pointing towards the surface is mostly responsible for the isotope effect in the methane dissociation.***This chapter has been published as a part of Energy distribution analysis of the wave packet simulations of CH4 and CD4 scattering[mil00a], © 2000 Elsevier Science.
5.1 Introduction
A nice way to study reaction dynamics is the use of isotopes. The most recent wave packet simulation on the dissociation probability of CH4 and CD4 showed a semiquantitative agreement with the molecular beam experiments of Ref.[hol95], except for the isotope effect and the extracted vibrational efficacy [car98]. The molecular beam study with laser excitation of the asymmetrical stretch mode shows that the incorrect vibrational efficacy is caused by the assumptions in the fit procedure that both stretch modes behaves indentical [juur99]. One of the possible explanation of the incorrect isotope effect can be the role played by the non-included intramolecular vibrations.
In this chapter we report wave packet simulations of CD4 scattering including all internal vibrations for fixed orientations, performed on the same model PESs as in the previous chapter for CH4, which have been described in Section 3.3. A harmonic intramolecular PES [, see Eq.(3.12)] is adapted to include anharmonicities in the C–H distance [, see Eq.(3.18)], the decrease of the C–H bond energy due to interactions with the surface [, see Eq.(3.20)], and the increase of the C–H bond length also due to interactions with the surface [, see Eq.(3.22)]. We have used the multi-configurational time-dependent Hartree (MCTDH) method for our wave packet simulation [man92, jan93]. This method can deal with a large number of degrees of freedom and with large grids. (See Ref. [bec00] for a recent review, or Section 3.2 of this thesis for a survey.) Initial translational energy has been chosen in the range of 32 to 96 kJ/mol. We present only the results of the simualtions at 96 kJ/mol here (equivalent to mass-weighted atomic units), because they showed the most obvious excitation probabilties for . The initial state has been written as a product state of ten functions; one for the normally incident translational coordinate, and one for each internal vibration. All vibrations were taken to be in the ground state. Grid methods, number of points, and the configurational basis have been described in Section 3.4.
We will discuss the vibrational excitation and the deformation of the CD4 molecule when it hits the surface and compare it with CH4. Later on we will look at the energy distribution of the kinetic energy per mode and the potential energy in some terms of our model PESs for both isotopes. The transfer of translational kinetic energy towards vibrational kinetic energy gives an indication about the dissociation probability, since vibrational kinetic energy helps in overcoming the dissociation barrier. It gives a better idea too about which modes are essential to include in a more accurate wave packet simulation of methane dissociation. After that we will discuss the implications of this for the dissociation and give a summary with some general conclusions.
5.2 Excitation probabilities and structure deformation of CD4
The scattering probabilities for CD4 are predominantly elastic, as we also found in our previous simulations of CH4 scattering. (See Chapter 4 and Ref. [mil98]) The elastic scattering probability is larger than 0.99 for all orientation of the PESs with and at a translational energy of 96 kJ/mol. For the PES with we observe an elastic scattering probability of 0.981 for the orientation with one, 0.955 with two and 0.892 with three deuteriums pointing towards the surface. This is lower than we have found for CH4, which is 0.956 for the orientation with three hydrogens pointing towards the surface and larger than 0.99 for the others. The higher inelastic scattering probabilities of CD4 was expected, because the force constants of CD4 are decreased up to 50% with respect to those of CH4 and the translational surface repulsion fall-off differs only little.
Since the inelastic scattering probabilities are generally small, we have opted to look at the molecule when it hits the surface. Excitation probabilities and structure deformation enable us to get good results with much less costly simulations. The surface PES has C3v (with one or three bonds towards the surface) or C2v symmetry (with two bonds towards the surface). If we expand this PES in a Taylor-series of internal vibrations, we see that the linear terms contain only those vibrations that transform as in C3v, respectively, C2v. These are therefore easier to excite than others; We have not find any appreciable excitation of modes of C3v and the , , and modes of C2v.
We did not present results of the simulations with the harmonic PES, because they give almost the same excitation probabilities as the PES with . When we compare the excitation probabilities of CD4 in Table 5.1 with CH4 in Table 4.1 (see also Ref.[mil98]), we see that most of the modes at the different orientations give also a higher excitation probability similar to the scattering probability. We also see that some modes give a lower or equal excitation probability than for CH4 scattering. This is caused by the fact that the force constants , the surface repulsion parameters and , and the Morse bond-potential values changed relatively to each other. As a consequence of that some modes are more preferred for absorbing energy, which leaves less energy for others. So the isotope effect gives besides a general higher excitation probability also a different excitation probability distribution over the modes. We will now discuss this in more detail for the three different orientations and model PESs in combination with the structure deformation.
| PES | |||||
|---|---|---|---|---|---|
| orientation | stretch | bending | stretch | umbrella | |
| one | Morse | 0.052 | 0.056 | 0.094 | |
| weak | 0.220 | 0.362 | 0.203 | ||
| shift | 0.460 | 0.910 | 0.174 | ||
| two | Morse | 0.026 | 0.164 | 0.011 | 0.094 |
| weak | 0.099 | 0.192 | 0.080 | 0.080 | |
| shift | 0.792 | 0.092 | 0.830 | 0.495 | |
| three | Morse | 0.014 | 0.003 | 0.242 | |
| weak | 0.046 | 0.021 | 0.308 | ||
| shift | 0.868 | 0.756 | 0.387 |
For the PESs with and we find that the excitation probabilities of the stretch for CD4 stays almost the same for all orientations compared to CH4, except for the orientation with one deuterium pointing towards the surface with the PES for which it becomes 0.054 higher (see Table 5.1). In orientation with C3v symmetry most of the extra excitation is absorbed by the umbrella mode. Remarkable is that for the orientation with two deuteriums pointing towards the surface excitation probabilities of this mode become lower than for the CH4 scattering. Even the excitation probability for the PES of this mode is lower than for the PES, while normally this excitation is preferred for the PES with . One of the reasons is that for this orientation most of the extra excitation probability is taken by the bending mode. We also see that there is a higher excitation probability in symmetrical stretch mode for these PESs in all orientations. If we observe an extra excitation probability for a mode then this is relatively more for the PES with than with .
| Orientation | PES | |||||
|---|---|---|---|---|---|---|
| gas phase | all | 1.161 | 109.5 | |||
| one | Morse | 1.117 | 1.159 | 108.0 | 110.9 | |
| weak | 1.046 | 1.161 | 107.7 | 111.2 | ||
| shift | 1.395 | 1.157 | 109.8 | 109.2 | ||
| two | Morse | 1.152 | 1.156 | 116.4 | 109.7 | 107.7 |
| weak | 1.133 | 1.158 | 116.9 | 109.9 | 107.5 | |
| shift | 1.380 | 1.158 | 115.7 | 107.0 | 108.5 | |
| three | Morse | 1.160 | 1.153 | 112.4 | 106.4 | |
| weak | 1.160 | 1.152 | 112.8 | 105.9 | ||
| shift | 1.357 | 1.134 | 111.2 | 107.7 |
As a consequence of the extra excitation in the umbrella mode in the orientations with C3v symmetry we observe also more bond angle deformation for these PESs (see Table 5.2). It is also remarkable that the difference between the bond angle deformation between the PES with and in the orientation with three deuterium pointing towards the surface is much smaller than we saw for CH4 scattering. So the weakening of the bond strength is less effective for CD4 than CH4.
We also see this effect in the orientation with two deuteriums pointing towards the surface. The bond angle deformation of the angle between the C–D bond pointing towards the surface has also become lower than we had observed for CH4. The loss of excitation of the umbrella mode is not recovered by the extra excitation of the bending mode. On the other hand, as a consequence of this, the angle between the C–D bonds pointing away from the surface becomes more deformed, because excitation of the umbrella mode decreases this bond angle and the bending mode increases it.
The bond distances for all orientations and the PESs with and are generally somewhat lower for CD4 than CH4, but this in the same order as we get for the gas phase bond distance ( Å). So the isotope effect primary effects the bond angle deformation for these PES types.
For the PES with we do not observe this effect on the bond angle deformation. The bond angle deformation for the orientation with two and three deuteriums pointing towards the surface is the same as for CH4 and it is just less for the bond angle at the surface side in the orientation with one deuterium pointing towards the surface. The excitation probabilities for the bending and umbrella modes become higher for all orientations for CD4, which is necessary for getting the same bond angle deformations as CH4.
The changes in the bond distances for the orientations with one and two bonds pointing towards the surface is for CD4 almost the same as for CH4. For the orientation with three bonds pointing towards the surface, we found that the maximum bond lengthening of the bonds on the surface side was Å less for CD4 than CH4. We also found that the bond shortening of the bond pointing away from the surface is Å more for CD4. These are only minimal differences, which also only suggest that the bond deformation for CD4 has been influenced slightly more by the asymmetrical stretch mode than the symmetrical stretch mode. The observed excitation probabilities for these modes do not contradict this, but are not reliable enough for hard conclusions because of their high magnitude. It is also not clear, beside of this problem, what they really represent. Is the excitation caused by a different equilibrium position of the PES at the surface in a mode or is caused by extra energy in this mode? To answer these questions we decided to do an energy distribution analysis during the scattering for both isotopes.
5.3 Energy distribution in CH4 and CD4
For an analysis of the isotope effect in the scattering of methane in more detail and to be able to discuss some possible implications of this for the dissociation probabilities of both isotopes, we did an analysis of the energy distribution during the scattering of CD4 and CH4 for all presented orientations and potentials in Section 3.3. (See also Refs. [mil98, mil00a]).
We do this by calculating the expectation values of the important term of the Hamiltonian [see Eq. (3.8)] for the wave-function at a certain time . We can obtain good information about the energy distribution per mode by looking at the kinetic energy expectation values per mode (see Tables 5.3 and 5.4), because the kinetic energy operators have no cross terms like the PESs have. When we discuss the kinetic energy of a mode we normally refer to the mode of the C3v or C2v symmetry, because in these modes we have observed the highest excitation probabilities and the change in kinetic energy in the other modes is generally small.
| orientation | PES | translation | ||||
|---|---|---|---|---|---|---|
| stretch | bending | stretch | umbrella | |||
| initial | all | 36.57 | 3.30 | 1.75 | 3.39 | 1.50 |
| one | Morse | 9.65 | 3.44 | 3.78 | 1.51 | |
| weak | 9.37 | 3.15 | 2.86 | 1.51 | ||
| shift | 16.76 | 3.56 | 4.53 | 1.51 | ||
| two | Morse | 9.42 | 3.36 | 1.80 | 3.52 | 1.54 |
| weak | 10.98 | 2.69 | 1.80 | 2.75 | 1.53 | |
| shift | 14.59 | 3.50 | 1.79 | 4.67 | 1.57 | |
| three | Morse | 18.81 | 3.46 | 3.47 | 1.58 | |
| weak | 12.71 | 2.34 | 3.16 | 1.57 | ||
| shift | 20.53 | 5.32 | 4.39 | 1.58 |
| orientation | PES | translation | ||||
|---|---|---|---|---|---|---|
| stretch | bending | stretch | umbrella | |||
| initial | all | 36.57 | 2.33 | 1.24 | 2.52 | 1.12 |
| one | Morse | 8.29 | 2.46 | 2.82 | 1.14 | |
| weak | 7.93 | 2.23 | 2.16 | 1.13 | ||
| shift | 16.17 | 2.61 | 4.09 | 1.18 | ||
| two | Morse | 8.22 | 2.41 | 1.28 | 2.56 | 1.13 |
| weak | 9.25 | 1.93 | 1.28 | 2.10 | 1.14 | |
| shift | 14.00 | 2.78 | 1.27 | 4.05 | 1.27 | |
| three | Morse | 8.31 | 2.40 | 2.61 | 1.17 | |
| weak | 10.20 | 1.64 | 2.28 | 1.19 | ||
| shift | 20.06 | 4.37 | 3.80 | 1.28 |
| orient. | PES | |||||
|---|---|---|---|---|---|---|
| initial | all | 0.00 | 1.75 | 1.50 | 3.39 | 3.39 |
| one | Morse | 25.69 | 1.63 | 3.39 | 4.06 | |
| weak | 26.83 | 1.92 | 3.41 | 4.46 | ||
| shift | 18.20 | 1.87 | 3.25 | 3.85 | ||
| two | Morse | 25.47 | 2.50 | 2.07 | 3.38 | 3.37 |
| weak | 28.58 | 2.71 | 2.10 | 3.75 | 1.76 | |
| shift | 18.55 | 2.18 | 4.01 | 2.75 | 3.45 | |
| three | Morse | 17.05 | 2.04 | 3.32 | 3.38 | |
| weak | 31.13 | 2.80 | 3.32 | 1.87 | ||
| shift | 9.22 | 2.94 | 3.00 | 3.74 |
| orient. | PES | |||||
|---|---|---|---|---|---|---|
| initial | all | 0.00 | 1.24 | 1.12 | 2.48 | 2.48 |
| one | Morse | 26.88 | 1.47 | 2.47 | 3.29 | |
| weak | 27.40 | 2.04 | 2.48 | 4.05 | ||
| shift | 17.94 | 1.89 | 2.43 | 3.44 | ||
| two | Morse | 26.75 | 2.09 | 1.48 | 2.46 | 2.50 |
| weak | 29.20 | 2.26 | 1.42 | 2.71 | 1.30 | |
| shift | 18.45 | 1.68 | 4.52 | 2.29 | 2.74 | |
| three | Morse | 26.91 | 2.22 | 2.46 | 2.46 | |
| weak | 31.04 | 2.62 | 2.47 | 1.31 | ||
| shift | 8.71 | 3.49 | 2.28 | 3.21 |
By looking at the expectation values of some terms of the PES (see Tables 5.5 and 5.6), we obtain information about how the kinetics of the scattering is driven by the PES. The PES [see Eqs. (3.14), (3.15) and (3.16)] is the surface hydrogen/deuterium repulsion for a given orientation. and [see Eq. (3.12)] are the pure harmonic terms of the intramolecular PES of the modes in the C3v and C2v symmetry corresponding to a bending and umbrella modes, respectively. The pure harmonic correction terms of [see Eq. (3.19)] are included in them. and are the potential energy in a single C–H or C–D bond pointing respectively towards and away from the surface, and we give the expectation value of one bond term of [see Eq. (3.18)], [see Eq. (3.20)] or [see Eq. (3.22)]. All given expectation values are the maximum deviation of the initial values, which effectively means the values at the moment the molecule hits the surface.
The largest changes in expectation values are, of course, in the kinetic energy of the translational mode. The translational kinetic energy does not become zero as we should expect in classical dynamics. The loss of translational kinetic energy is primary absorbed by the terms of the PESs. The expectation values of the terms show the ability of the hydrogens or deuteriums to come close to the metal surface, since in real space their exponential fall-offs are the same for both isotopes. For a rigid molecule the sum of the translational kinetic energy and should be constant, so all deviations of this sum have to be found back in the intramolecular kinetic energy and other PES terms.
The minimum expectation values of the translational kinetic energy for a given orientation and PES is always larger for CH4 than CD4. We observe that for the PES with and the expectation value of is higher for CD4 than CH4, so it is easier for the deuterium to come close to the surface then for the hydrogens. This is the other way around for the PES with . So we find with CH4 has both a higher and kinetic energy expectation value than CD4.
We see for CD4 with the PES in all orientations about the same translational energy. For CH4 this is only true for the orientation with one and two hydrogens pointing towards the surface, because we found in the orientation with three hydrogens pointing towards the surface the translational energy at the surface is twice that in the other orientations. This is the largest difference we have found between the isotopes. We observe for all modes a little more kinetic vibrational energy than in the groundstate for both isotopes, but in the stretch term the extra kinetic energy is twice as high for CH4 as CD4. The absolute value of the PES term of CD4 has become even higher than CH4 in the orientation with three bonds pointing towards the surface. This explains the 1.2 degrees higher bond angle deformation of CD4 in this orientation.
For the orientations with one and two bonds pointing towards the surface we observe slightly more kinetic energy in the vibrational modes and the harmonic PES terms become higher. In the orientation with one bond pointing towards the surface we observe a higher value for the PES term. This is of course caused by the repulsion of , which also lead to a shorter bond distance and because of that to higher contribution of the repulsion term of .
The PES with shows for both isotopes an upward trend in kinetic energy in the translational mode and the surface repulsion terms with the number bonds pointing towards the surface. Although the sum of these values for the orientation with one bond pointing towards the surface are still lower than the value of the initial translational energy, the kinetic energy in the stretch modes becomes lower. This is also observed in the modes in the C3v symmetry, and and modes in the C2v symmetry of the asymmetrical stretch modes. It is caused by the flattening of the bond potential close to the surface. The and terms have to compensate this lost of energy by increasing more than with the PES with . The increase for CD4 in these terms is higher than for CH4. The value of the became even the highest for CD4.
For the orientations with two and three bonds pointing towards the surface we observe that the sum of the translational kinetic energy and terms become higher than the initial kinetic energy . This is compensated by a loss of vibrational kinetic energy in all stretch modes and a lost of the terms of the PES. The and become higher or stay around the same value compared with the PES with . In the orientation with two bonds pointing towards the surface we also observe a higher value for the term for both isotopes.
Since we found for the PES with both the translational kinetic energy and the terms were higher for CH4 than CD4, we have to find more increase in energy in the intramolecular modes and PES terms for CD4 than CH4. We indeed do so and that can be one of the reasons we found higher inelastic scatter probabilities for CD4 with this type of model PES.
For the orientations with one and two bonds pointing towards the surface we observe a large increase of the kinetic energy in the asymmetrical stretch mode. The translational kinetic energy becomes much higher than with the other model PESs for these orientations, especially in the orientation with one bond pointing towards the surface. If we compare this with the excitation probabilities, we find that the kinetic energy analysis gives indeed a different view on the dynamics. For the orientation with two bond pointing towards the surface we have found for both isotopes very high excitation probabilities in the and stretch modes. We know now from the kinetic energy distribution that for the symmetrical stretch mode the high excitation probability is caused by the change of the equilibrium position of the mode in the PES and that for the stretch mode probably the PES also has become narrower.
For the orientation with three bonds pointing towards the surface we also obtain an large increase of the kinetic energy of the asymmetrical stretch mode, but we also find an even larger increase in the kinetic energy of the symmetrical stretch mode. The total kinetic energy was extremely large, because the kinetic energy of the translational mode becomes also much larger than for the other orientations. Because of this the terms had to be around twice as low as for the other orientations. This means that it is unfavourable to get the hydrogens and deuterium close to the surface in this orientation with this PES type.
All terms of the PES with become lower compared to the initial value, especially in the orientation with two bond pointing towards the surface. In the orientation with one bond pointing towards the surface, the term became higher. Again this is caused by the repulsion of in the direction of the bond. For CH4 however it stays lower than the values for the other model PESs. The increase of this PES term value is higher for CD4 and we can find it above the value of the PES with , but still much lower than for the PES with .
In the orientation with three bond pointing towards the surface we also observe a higher value, with also the highest increase for CD4. In relation with the somewhat shorter bond distance for the for CD4 compared with CH4, which was also a bit lower compared with the other orientations, we know now that the hydrogens and especially the deuterium have problems in following the minimum energy path of the PES with during the scattering dynamics. This leads to higher kinetic energy in the vibrational modes, which results in more inelastic scattering.
The term of the PESs with increases in respect to the initial value, but not as much as with the other PES types. The increase of the is for the orientation with one bond pointing towards the surface in between the values of the other PES types. In the other orientations it is higher, especially in the orientation with two hydrogens pointing towards the surface. The values for the CD4 isotopes are also higher than for CH4. We observe also a larger increase of the kinetic energy in the umbrella mode for CD4 than for CH4.
5.4 Dissociation hypotheses
We like now to discuss some possible implications of the scattering simulation for the isotope effect on the dissociation of methane. In Chapter 4 we have already drawn some conclusions about the possible reaction mechanism and which potential type would be necessary for dissociation. (See also Ref. [mil98]). We found the direct breaking of a single C–H bond in the initial collision more reasonable than the splats model with single bond breaking after an intermediary Ni–C bond formation as suggested by Ref. [lee87], because the bond angle deformations seems to small to allow a Ni–C to form. From the simulations with CD4 we can draw the same conclusions. The PES with gives the same angle deformations for both isotopes, which is not sufficient for the splats model. The other potentials give higher bond angle deformations for orientation with three deuteriums pointing towards the surface. If the Ni–C bond formation would go along this reaction path, then the dissociation of CD4 should be even more preferable than CH4, which is not the case. So we only have to discuss the implication of the scattering simulation for the dissociation probabilities of CH4 and CD4 for a direct breaking of a single bond reaction mechanism. This reaction mechanism can be influenced by what we will call a direct or an indirect effect.
A direct effects is the expected changes in the dissociation probability between CH4 and CD4 for a given orientation. Since we expect that we need for dissociation a PES with an elongation of the bonds pointing towards the surface, we only have to look at the isotope effect in the simulation for the PES with for different orientations to discuss some direct effect. It is clear from our simulations that the bond lengthening of CD4 is smaller than CH4 for the orientation with three bonds pointing towards the surface. If this orientation has a high contribution to the dissociation of methane, then this can be the reason of the higher dissociation probability of CH4. In this case our simulations also explain why Ref.[car98] did not observe a high enough isotope effect in the dissociation probability of their simulation with CH4 and CD4 modelled by a diatomic, because we do not observe a change in bond lengthening between the isotopes for the orientation with one bond pointing towards the surface.
The orientation with three bonds pointing towards the surface is also the orientation with the highest increase of the total vibrational kinetic energy for the PES with , because the energy distribution analysis shows besides an high increase of the kinetic energy in the asymmetrical stretch mode also an high increase in the symmetrical stretch mode. Since vibrational kinetic energy can be used effectively to overcome the dissociation barrier, the orientation with three bonds indicates to be a more preferable orientation for dissociation. Moreover the relative difference in kinetic energy between both isotopes is for the stretch mode larger than for the stretch mode. If the kinetic energy in the stretch mode contributes significantly to overcoming the dissociation barrier, then it is another explanation for the low isotope effect in Ref.[car98].
An indirect effect is the expected changes in the dissociation probability between CH4 and CD4 through changes in the orientations distribution caused by the isotope effect in the vibrational modes. This can be the case if the favourable orientation for dissociation is not near the orientation with three bonds pointing towards the surface, but more in a region where one or two bonds pointing towards the surface. These orientations do not show a large difference in deformation for the PES with . We can not draw immediate conclusion about the indirect effect from our simulations, since we did not include rotational motion, but our simulation show that an indirect isotope effect can exist. For the PES with in the orientation with three bonds pointing towards the surface, we observe that CD4 is able to come closer to the surface than CH4. So this rotational orientation should be more preferable for CD4 than for CH4. On the other hand, if the PES is in this orientation more like the dissociation probability in other orientation can be decreased for CD4 through higher probability in inelastic scattering channels.
So for both effects the behaviour of the orientation with three bonds pointing towards the surface seems to be essential for a reasonable description of the dissociation mechanism of methane. A wave packet simulation of methane scattering including one or more rotational degrees of freedom and the vibrational stretch modes will be a good starting model to study the direct and indirect effects, since most of the kinetic energy changes are observed in the stretch modes and so the bending and umbrella modes are only relevant with accurate PESs. Eventually dissociation paths can be introduced in the PES along one or more bonds.
Beside of our descriptions of the possible isotopes effect for the dissociation extracted of the scatter simulations we have to keep in mind that also a tunneling mechanism can be highly responsible for the higher observed isotope effect in the experiment and that a different dissociation barrier in the simulations can enhance this effect of tunneling.
5.5 Conclusions
We have performed wave packet simulations on the scattering of CD4 from a flat surface with a fixed orientation with one, two, or three hydrogens pointing towards the surface. We used the MCTDH method and three different model PESs for each orientation. We used a translational energy of up to 96 kJ/mol and all internal vibrations in the groundstate. The scattering was in all cases predominantly elastic. However, the observed inelastic scattering of CD4 compared with simulation on CH4 is higher for the PES with an elongated equilibrium bond length close to the surface.
When the molecule hits the surface, we observed in general a higher vibrational excitation for CD4 than CH4. The PES with an elongated equilibrium bond length close to the surface gives for both isotopes almost the same deformations, although we observe a somewhat smaller bond lengthening for CD4 in the orientation with three bonds pointing towards the surface. The other model PESs show differences in the bond angle deformations and in the distribution of the excitation probabilities of CD4 and CH4, especially for the PES with only an anharmonic intramolecular potential.
Energy distribution analysis proofs observations and hypotheses obtained from excitation probabilities and structure deformation, and contributes new information on the scattering dynamics. A high increase of vibrational kinetic energy results in higher inelastic scattering. The highest increase of vibrational kinetic energy is found in the asymmetrical stretch modes for all orientations and in the symmetrical stretch mode for the orientation with three bonds pointing towards the surface, when the PES has an elongated equilibrium bond length close to the surface.
Our simulations give an indications that the isotope effect in the methane dissociation is caused mostly by the difference in the scattering behaviour of the molecule in the orientation with three bonds pointing towards the surface. At least multiple vibrational stretch modes should be included for a reasonable description of isotope effect in the methane dissociation reaction.
References
- [1] R. Milot and A. P. J. Jansen, Surf. Sci. 452, 179 (2000).
- [2] P. M. Holmbad, J. Wambach, and I. Chorkendorff, J. Chem. Phys. 102, 8255 (1995).
- [3] M.-N. Carré and B. Jackson, J. Chem. Phys. 108, 3722 (1998).
- [4] L. B. F. Juurlink, P. R. McCabe, R. R. Smith, C. L. DiCologero, and A. L. Utz, Phys. Rev. Lett. 83, 868 (1999).
- [5] U. Manthe, H.-D. Meyer, and L. S. Cederbaum, J. Chem. Phys. 97, 3199 (1992).
- [6] A. P. J. Jansen, J. Chem. Phys. 99, 4055 (1993).
- [7] M. H. Beck, A. Jäckle, G. A. Worth, and H.-D. Meyer, Phys. Rep. 324, 1 (2000).
- [8] R. Milot and A. P. J. Jansen, J. Chem. Phys. 109, 1966 (1998).
- [9] M. B. Lee, Q. Y. Yang, and S. T. Ceyer, J. Chem. Phys. 87, 2724 (1987).
Chapter 6 The role of vibrational excitations
The role of vibrational excitation of a single mode in the scattering of methane is studied by wave packet simulations of oriented CH4 and CD4 molecules from a flat surface. All nine internal vibrations are included. In the translational energy range from 32 up to 128 kJ/mol we find that initial vibrational excitations enhance the transfer of translational energy towards vibrational energy and increase the accessibility of the entrance channel for dissociation. Our simulations predict that initial vibrational excitations of the asymmetrical stretch () and especially the symmetrical stretch () modes will give the highest enhancement of the dissociation probability of methane. ***This chapter has been published as a part of Bond breaking in vibrationally excited methane on transition-metal catalysts[mil00b], © 2000 The American Physical Society.
6.1 Introduction
The dissociative adsorption of methane on transition metals is an important reaction in catalysis; it is the rate limiting step in steam reforming to produce syngas, and it is prototypical for catalytic C–H activation. Although the reaction mechanism has been studied intensively, it is not been fully understood yet. A number of molecular beam experiments in which the dissociation probability was measured as a function of translational energy have observed that vibrationally hot CH4 dissociates more readily than cold CH4, with the energy in the internal vibrations being about as effective as the translational energy in inducing dissociation [ret85, ret86, lee87, lun89, hol95, lar99, walker99]. Two independent bulb gas experiment with laser excitation of the asymmetrical stretch and umbrella modes on the Rh(111) surface [yates79], and laser excitation of the and modes on thin films of rhodium [brass79] did not reveal any noticeable enhancement in the reactivity of CH4. A recent molecular beam experiment with laser excitation of the mode did succeed in measuring a strong enhancement of the dissociation on a Ni(100) surface. However, this enhancement was still much too low to account for the vibrational activation observed in previous studies and indicated that other vibrationally excited modes contribute significantly to the reactivity of thermal samples [juur99].
Wave packet simulations of the methane dissociation reaction on transition metals have treated the methane molecule always as a diatomic molecule up to now [har91, lun91, lun92, lun95, jan95, car98]. Apart from one C–H bond (a pseudo- stretch mode) and the molecule surface distance, either (multiple) rotations or some lattice motion were included. None of them have looked at the role of the other internal vibrations, so there is no model that describes which vibrationally excited mode might be responsible for the experimental observed vibrational activation. In previous chapters we have reported on wave packet simulations to determine which and to what extent internal vibrations are important for the dissociation of CH4 in the vibrational ground state (Chapter 4, see also Ref. [mil98]), and the isotope effect of CD4 (Chapter 5, see also Ref. [mil00a]). We were not able yet to simulate the dissociation including all internal vibrations. Instead we simulated the scattering of methane, for which all internal vibrations can be included, and used the results to deduce consequences for the dissociation. These simulations indicate that for methane to dissociate the interaction of the molecule with the surface should lead to an elongated equilibrium C–H bond length close to the surface. In this chapter we report on new wave packet simulations of the role of vibrational excitations for the scattering of CH4 and CD4 molecules with all nine internal vibrations. The dynamical features of these simulations give new insight into the initial steps of the dissociation process. The conventional explanation is that vibrations help dissociation by adding energy needed to overcome the dissociation barrier. We find that two other new explanations play also a role. One of them is the enhanced transfer of translational energy into the dissociation channel by initial vibrational excitations. The other more important explanation is the increased accessibility of the entrance channel for dissociation.
We have used the multi-configurational time-dependent Hartree (MCTDH) method for our wave packet simulation [man92, jan93]. This method can deal with a large number of degrees of freedom and with large grids. (See Ref. [bec00] for a recent review, or Section 3.2 of this thesis for a survey.) Initial translational energy has been chosen in the range of 32 to 128 kJ/mol. The initial state has been written as a product state of ten functions; one for the normally incident translational coordinate, and one for each internal vibration. All vibrations were taken to be in the ground state except one that was put in the first excited state. The orientation of the CH4/CD4 was fixed, and the vibrationally excited state had symmetry in the symmetry group of the molecule plus surface (C3v when one or three H/D atoms point towards the surface, and C2v when two point towards the surface.) The potential-energy surface is characterised by an elongation of the C–H bonds when the molecule approaches the surfaces [, see Eq.(3.22)], no surface corrugation, and a molecule-surface part appropriate for Ni(111). It has been shown to give reasonable results, and is described in Section 3.3 (and in Refs. [mil98, mil00a]). The computational details about the configurational basis and number of grid points are discussed in Section 3.4. Figure 4.1 illustrates the orientations and Fig. 3.1 the important vibrational modes.
6.2 Energy distribution analysis
6.2.1 Translational kinetic energy
We can obtain a good idea about the overall activation of a mode by looking at the kinetic energy expectation values for each mode . During the scattering process the change in the translational kinetic energy is the largest. It is plotted in Fig. 6.1 as a function of time for CH4 in the orientation with three bonds pointing towards the surface with an initial kinetic energy of 96 kJ/mol and different initial vibrational states. When the molecule approaches the surface the kinetic energy falls down to a minimum value. This minimum value varies only slightly with the initial vibrational states of the molecule.
The total loss of translational kinetic energy varies substantially, however. The initial translational kinetic energy is not conserved. This means that the vibrational excitation enhances inelastic scattering. Especially an excitation of the symmetrical stretch mode and to a lesser extent the asymmetrical stretch mode results in an increased transfer of kinetic energy towards the intramolecular vibrational energy. The inelastic scatter component (the initial minus the final translational energy) for both isotopes in the orientation with three bonds pointing towards the surface, shows the following trend for the initial vibrational excitations of the modes; ground state. CH4 scatters more inelastically than CD4 over the whole calculated range of translational kinetic energies, if the molecule has an initial excitation of the stretch mode. CH4 scatters also more inelastically than CD4 in the symmetrical stretch mode at higher energies , but at lower energies it scatters slightly less inelastically. For the molecules with the non-excited state or an excitation in the umbrella mode CD4 has a higher inelastic scattering component than CH4. At an initial translational kinetic energy of 128 kJ/mol the excitation of the umbrella mode results in a strong enhancement of the inelastic scattering component. For CD4 the inelastic scattering component for the initial excited umbrella mode can become even larger than that for the initial excited stretch mode.

For the orientation with two bonds pointing towards the surface we observe the same trends for the relation between the inelastic scatter components and the excited initial vibrational modes, but the inelastic scatter component are less than half of the values for the orientation with three bonds pointing towards the surface. Also the excitation of the asymmetrical stretch modes results now in a higher inelastic scattering component for CD4 than for CH4. Excitation of the bending mode gives a slightly higher inelastic scatter component than the vibrational ground state.
For the orientation with one bond pointing towards the surface we observe an even lower inelastic scattering component. At an initial kinetic energy of 128 kJ/mol we find that both the and stretch modes have an inelastic component of around 6.5 kJ/mol for CD4 and 4.0 kJ/mol for CH4.
At an initial translational energy of 32 kJ/mol we observe for both isotopes in all orientations a very small increase of translational kinetic energy for the vibrational excited molecule, which means that there is a net transfer from intramolecular vibrational energy through the surface repulsion into the translational coordinate.
6.2.2 Vibrational kinetic energy
There seem to be two groups of vibrations with different qualitative behavior with respect to (de)excitation when the molecule hits the surface. The first group, which we call the “stretch” group, consists of the asymmetric stretch mode in any orientation and the symmetric stretch mode in the orientation with three hydrogen/deuterium atoms pointing to the surface. Figures 6.2 and 6.3 show the vibrational kinetic energy in the and stretch modes respectively versus time for CH4 in the orientation with three bonds to the surface. The second, called the “bending” group, consists of all bending vibrations and the in other orientations. Figure 6.4 shows the vibrational kinetic energy in the umbrella mode versus time for the same orientation of CH4.


When the molecule is initially in the vibrational ground state the kinetic energy in the vibrations increases, reaches a maximum at the turn-around point, and then drops back almost to the initial level except for a small contribution due to the inelastic scattering component. The vibrations within a group have very similar amounts of kinetic energy, but the “stretch” group has clearly a larger inelastic component than the “bending” group, and also the kinetic energy at the turn-around point is larger. When the molecule has initially an excitation of a vibration of the “stretch” group then the kinetic energy of that vibration increases, reaches a maximum at the turn-around point, and drops to a level lower than it was initially. For an excitation of a vibration of the “bending” group there is no maximum, but its kinetic energy simply drops to a lower level. We see that in all cases there is not only a transfer of energy from the translation to vibrations, but also an energy flow from the initially excited vibration to other vibrations. However, the total energy of the vibrational kinetic energy and the intramolecular potential energy increases, because it has to absorb the inelastic scattering component.
6.2.3 Potential energy of the surface repulsion term
Figure 6.5 shows the (repulsive) interaction with the surface during the scattering process of CH4 at an initial kinetic energy of 96 kJ/mol and different initial vibrational excitations for the orientation with three hydrogens pointing towards the surface. Since this is a repulsive term with a exponential fall-off changes in the repulsion indicate the motion of the part of the wave packet closest to the surface. At the beginning of the simulation the curves are almost linear in a logarithmic plot, because the repulsion hardly changes the velocity of the molecule. After some time the molecule enters into a region with a higher surface repulsion and the slopes of the curves drop. This results in a maximum at the turn-around point, where most of the initial translational kinetic energy is transferred into potential energy of the surface repulsion. For a classical simulation it would have meant no translational kinetic energy, but it corresponds with the minimum kinetic energy for our wave packet simulations. Past the maximum, a part of the wave packet will accelerate away from the surface, and the slope becomes negative. The expectation value of the translational kinetic energy (see Fig.6.1) increases at the same time. The slope of the curves in Fig. 6.5 becomes less negative towards the end of the simulation, although the expectation value of the translational kinetic energy in this time region is almost constant. The reason for this is that a part of the wave packet with less translational kinetic energy is still in a region close to the surface. We see also that the height of the plateaus for the different initial vibrational excitations is again in the order; ground state. This again indicates that a larger part of the wave packet is inelastically scattered when is excited than when is excited, etc.

At lower initial translational kinetic energies the plateaus have a lower position and the main gap exists between the plateaus of the and stretch modes and the lower positioned plateaus of the umbrella mode and the ground state. At an initial translational kinetic energy of 128 kJ/mol the positions of the plateaus are higher and the differences between the initial vibrational excitations are also smaller. The plateau of the stretch mode is even around the same position as the umbrella mode for CD4 in the orientation with three bonds pointing towards the surface at this initial energy. The orientation with two bonds pointing towards the surface shows the same trends. The plateaus of the initial excited bending mode are located slightly above the ground state for both isotopes. For the orientation with one bond pointing towards the surface the relative positions of the plateaus of the different initial excitations are the same as at low energies in the orientation with three bonds pointing towards the surface.
6.3 Dissociation hypotheses
Even though we did not try to describe the dissociation itself, the scattering simulation do yield indications for the role of vibrational excitations on the dissociation of methane, and we compare these with experimental observations. The dissociation of methane occurs over a late barrier, because it is enhanced by vibrational energy [lev87]. Conventionally, the role of vibrational excitation on the enhancement of dissociation probability was discussed as an effect of the availability of the extra (vibrational kinetic) energy for overcoming the dissociation barrier. Our simulations show that such a process might play a role, but they show also that two other processes occur through vibrational excitation.
Firstly, an initial vibrational excitation increases translational kinetic energy transfer towards the intramolecular vibrational energy. The simulations show that this inelastic scatter component can be seen in an large enhancement of the vibrational kinetic energy in the stretch modes at the turn-around point. This increase is larger for higher initial translational kinetic energy and is most effective in the orientation with three bonds pointing towards the surface. If the dissociation of methane occurs primarily in this orientation, then we would expect, based on the total available vibrational energy after hitting the surface, that excitation of the symmetrical stretch mode is the most effective for enhancing the dissociation probability. The asymmetrical stretch mode appears to be less so. An explanation of the enhanced inelastic scatter compound by vibrational excitation is that through excitation the bonds are weakened, which will ease excitation in the initial non-excited modes. Excitations other than the , , or with symmetry for a particular orientation can possibly result in higher energy transfers, but we think that the difference with (which has always symmetry) would be still large.
Second, the accessibility of the dissociation channel also enhances the dissociation probability. We have concluded in Chapter 4 (and Ref. [mil98]) that our potential mimics reasonably the entrance channel for dissociation. In this chapter we find that a part of the wave packet has a longer residence time at the surface. It is this part of the wave packet that accesses the dissociation channel, and it is also this part that is able to come close to the transition state for dissociation. From Figs. 6.1 and 6.5 we conclude that the stretch mode will enhance the dissociation probability the most. The enhanced accessibility by vibrational excitation is explained by the spread of the wave packet along a C–H bond, which gives a higher probability for the system to be atop the dissociation barrier.
The molecular beam experiment with excitations of the asymmetrical stretch mode of CH4 of Ref. [juur99] shows that a single excitation of the asymmetrical stretch mode enhances dissociation, but the measured reactivity of the stretch mode is too low to account for the total vibrational activation observed in the molecular beam study of Ref. [hol95]. It means that excitation of a mode other than the stretch mode will be more effective for dissociation. Our simulations show that indeed excitation of the stretch mode will enhance dissociation, but predict that excitation of the symmetrical stretch mode will be more effective if the dissociation occurs primary in the orientation with multiple bonds pointing towards the surface. The contribution of the symmetrical stretch mode cannot be measured directly, because it has no infra-red activity. However, the contribution of the mode can be estimated using a molecular beam study as follows. The contribution of the stretch mode has already been determined [juur99]. Similarly the contribution of the umbrella mode can be determined. The contribution of the bending can be estimated from our simulations to be somewhat lower than the umbrella contribution. The total contribution of all vibrations is known from Ref. [hol95], and a simple subtraction will give us then the contribution of the stretch mode. At high translational energies the accessibility of the dissociation channel for molecules with an excited umbrella mode is close to that of the molecules with excited stretch modes, and for CD4 the inelastic scattering is also enhanced. So the excitation of the umbrella mode can still contribute significantly to the vibrational activation, because it also has higher Boltzmann population in the molecular beam than the stretch modes.
6.4 Conclusions
We have performed wavepacket simulation of the scattering of fixed oriented, vibrationally excited CH4 and CD4 from a flat surface. We used initial translational energies in the range of 32 to 128 kJ/mol. A single vibrational excitation was put in one of the vibrational modes with symmetry in the symmetry group of the molecule plus surface, while the other vibrational modes were kept in the groundstate. The potential-energy surface is characterised by an elongation of the C–H bonds when the molecule approaches the surfaces, and a molecule-surface part appropriate for Ni(111).
We find that initial vibrational excitations enhance the transfer of translational energy towards vibrational energy and increase the accessibility of the entrance channel for dissociation, which means an increase of inelastic scattering. The largest effects are observed in the orientation with three bonds pointing to the surface. Our simulations predict that initial vibrational excitations of the asymmetrical stretch () and especially the symmetrical stretch () modes will give the highest enhancement of the dissociation probability of methane.
References
- [1] R. Milot and A. P. J. Jansen, Phys. Rev. B 61, 15657 (2000).
- [2] C. T. Rettner, H. E. Pfnür, and D. J. Auerbach, Phys. Rev. Lett. 54, 2716 (1985).
- [3] C. T. Rettner, H. E. Pfnür, and D. J. Auerbach, J. Chem. Phys. 84, 4163 (1986).
- [4] M. B. Lee, Q. Y. Yang, and S. T. Ceyer, J. Chem. Phys. 87, 2724 (1987).
- [5] A. C. Luntz and D. S. Bethune, J. Chem. Phys. 90, 1274 (1989).
- [6] P. M. Holmbad, J. Wambach, and I. Chorkendorff, J. Chem. Phys. 102, 8255 (1995).
- [7] J. H. Larsen, P. M. Holmblad, and I. Chorkendorff, J. Chem. Phys. 110, 2637 (1999).
- [8] A. V. Walker and D. A. King, Phys. Rev. Lett. 82, 5156 (1999).
- [9] J. T. Yates, Jr., J. J. Zinck, S. Sheard, and W. H. Weinberg, J. Chem. Phys. 70, 2266 (1979).
- [10] S. B. Brass, D. A. Reed, and G. Ehrlich, J. Chem. Phys. 70, 5244 (1979).
- [11] L. B. F. Juurlink, P. R. McCabe, R. R. Smith, C. L. DiCologero, and A. L. Utz, Phys. Rev. Lett. 83, 868 (1999).
- [12] J. Harris, J. Simon, A. C. Luntz, C. B. Mullins, and C. T. Rettner, Phys. Rev. Lett. 67, 652 (1991).
- [13] A. C. Luntz and J. Harris, Surf. Sci. 258, 397 (1991).
- [14] A. C. Luntz and J. Harris, J. Vac. Sci. A 10, 2292 (1992).
- [15] A. C. Luntz, J. Chem. Phys. 102, 8264 (1995).
- [16] A. P. J. Jansen and H. Burghgraef, Surf. Sci. 344, 149 (1995).
- [17] M.-N. Carré and B. Jackson, J. Chem. Phys. 108, 3722 (1998).
- [18] R. Milot and A. P. J. Jansen, J. Chem. Phys. 109, 1966 (1998).
- [19] R. Milot and A. P. J. Jansen, Surf. Sci. 452, 179 (2000).
- [20] U. Manthe, H.-D. Meyer, and L. S. Cederbaum, J. Chem. Phys. 97, 3199 (1992).
- [21] A. P. J. Jansen, J. Chem. Phys. 99, 4055 (1993).
- [22] M. H. Beck, A. Jäckle, G. A. Worth, and H.-D. Meyer, Phys. Rep. 324, 1 (2000).
- [23] R. D. Levine and R. B. Bernstein, Molecular Reaction Dynamics and Chemical Reactivity (Oxford University Press, Oxford, 1987).
Chapter 7 Classical trajectory simulations
We present classical trajectory calculations of the rotational vibrational scattering of a non-rigid methane molecule from a Ni(111) surface. Energy dissipation and scattering angles have been studied as a function of the translational kinetic energy, the incidence angle, the (rotational) nozzle temperature, and the surface temperature. Scattering angles are somewhat towards the surface for the incidence angles of 30∘, 45∘, and 60∘ at a translational energy of 96 kJ/mol. Energy loss is primarily from the normal component of the translational energy. It is transfered for somewhat more than half to the surface and the rest is transfered mostly to rotational motion. The spread in the change of translational energy has a basis in the spread of the transfer to rotational energy, and can be enhanced by raising of the surface temperature through the transfer process to the surface motion.***This chapter will be published as Energy dissipation and scattering angle distribution analysis of the classical trajectory calculations of methane scattering from a Ni(111) surface [mil01], preprint available at http://arXiv.org/abs/physics/0103053.
7.1 Introduction
It is very interesting to simulate the dynamics of the dissociation, because of the direct dissociation mechanism, and the role of the internal vibrations. In previous Chapters 4 and 5 we have reported on wave packet simulations to determine which and to what extent internal vibrations are important for the dissociation in the vibrational ground state of CH4 (see also Ref. [mil98]), and CD4 (see also Ref. [mil00a]). We were not able yet to simulate the dissociation including all internal vibrations. Instead we simulated the scattering of methane in fixed orientations, for which all internal vibrations can be included, and used the results to deduce consequences for the dissociation. These simulations indicate that to dissociate methane the interaction of the molecule with the surface should lead to an elongated equilibrium C–H bond length close to the surface, and that the scattering was almost elastic. In Chapter 6 we reported on wave packet simulations of the role of vibrational excitations for the scattering of CH4 and CD4 (see also Ref. [mil00b]). We predicted that initial vibrational excitations of the asymmetrical stretch () but especially the symmetrical stretch () modes will give the highest enhancement of the dissociation probability of methane. Although we have performed these wave packet simulations in ten dimensions, we still had to neglect two translational and three rotational coordinates of the methane molecule and we did not account for surface motion and corrugation. It is nowadays still hard to include all these features into a wave packet simulation, therefore we decided to study these with classical trajectory simulations.
In this chapter we will present full classical trajectory simulations of methane from a Ni(111) surface. We have especially interest in the effect of the molecular rotations and surface motion, which we study as a function of the nozzle and surface temperature. The methane molecule is flexible and able to vibrate. We do not include vibrational kinetic energy at the beginning of the simulation, because a study of vibrational excitation due to the nozzle temperature needs a special semi-classical treatment. Besides its relevance for the dissociation reaction of methane on transition metals, our scattering simulation can also be of interest as a reference model for the interpretation of methane scattering itself, which have been studied with molecular beams on Ag(111) [asada81, asada82], Pt(111) [yagyu99, yagyu99b, yagyu00, hiraoka00], and Cu(111) surfaces [Andersson00]. It was reported in Refs. [yagyu99, yagyu99b] that the scattering angles are in some cases in disagreement with the outcome of the classical Hard Cube Model (HCM) described in Ref. [logan66]. We will show in this article that the assumptions of this HCM model are too crude for describing the processes obtained from our simulation. The time-of-flight experiments show that there is almost no vibrational excitation during the scattering [yagyu00, hiraoka00], which is in agreement with our current classical simulations and our wave packet simulations discussed in the previous Chapters 4 and 5.
The rest of this chapter is organized as follows. We start with a description of our model potential, and an explanation of the simulation conditions. The results and discussion are presented next. We start with the scattering angles, and relate them to the energy dissipation processes. Next we will compare our simulation with other experiments and theoretical models. We end with a summary and some general conclusions.
7.2 Computational details
We have used classical molecular dynamics for simulating the scattering of methane from a Ni(111) surface. The methane molecule was modelled as a flexible molecule. The forces on the carbon, hydrogen, and Ni atoms are given by the gradient of the model potential energy surface described below. The first-order ordinary differential equations for the Newtonian equations of motion of the Cartesian coordinates were solved with use of a variable-order, variable-step Adams method [nag17]. We have simulated at translational energies of 24, 48, 72, and 96 kJ/mol at normal incidence, and at 96 kJ/mol for incidence angles of 30∘, 45∘, and 60∘ with the surface normal. The surface temperature and (rotational) nozzle temperature for a certain simulation were taken independently between 200 and 800 K.
7.2.1 Potential energy surface
The model potential energy surface used for the classical dynamics is derived from one of our model potentials with elongated C–H bond lengths towards the surface, previously used for wave packet simulation of the vibrational scattering of fixed oriented methane on a flat surface [see Eq. 3.22 in Section 3.3, and also Refs. [mil98] and [mil00a]]. In this original potential there is one part responsible for the repulsive interaction between the surface and the hydrogens, and another part for the intramolecular interaction between carbon and hydrogens.
We have rewritten the repulsive part [see Eq. 3.13] in pair potential terms between top layer surface Ni atoms and hydrogens in such a way that the surface integral over all these Ni atoms give the same overall exponential fall-off as the original repulsive PES term for a methane molecule far away from the surface in an orientation with three bonds pointing towards the surface. The repulsive pair interaction term between hydrogen and Ni atom at the surface is then given by
| (7.1) |
where is the distance between hydrogen atom and Ni atom .
The intramolecular potential part is split up in bond, bond angle, and cross potential energy terms. The single C–H bond energy is given by a Morse function with bond lengthening towards the surface
| (7.2) |
where is the dissociation energy of methane in the gas phase, and is the length of the C–H bond . Dissociation is not possible at the surface with this potential term, but the entrance channel for dissociation is mimicked by an elongation of the equilibrium bond length when the distance between the hydrogen atom and the Ni atoms in the top layer of the surface become shorter. This is achieved by
| (7.3) |
where is the equilibrium C–H bond length in the gas phase. The bond elongation factor was chosen in such a way that the elongation is 0.054 nm at the classical turning point of 93.2 kJ/mol incidence translational energy for a rigid methane molecule, when the molecule approach a surface Ni atom atop with one bond pointing towards the surface. The single angle energy is given by the harmonic expression
| (7.4) |
where is the angle between C–H bond and , and the equilibrium bond angle. Furthermore, there are some cross-term potentials between bonds and angles. The interaction between two bonds are given by
| (7.5) |
The interaction between a bond angle and the bond angle on the other side is given by
| (7.6) |
The interaction between a bond angle and one of its bonds is given by
| (7.7) |
The parameters of the intramolecular potential energy terms were calculated by fitting the second derivatives of these terms on the experimental vibrational frequencies of CH4 and CD4 in the gas phase [gray79, lee95].
The Ni-Ni interaction between nearest-neighbours is given by the harmonic form
| (7.8) | |||||
The ’s are the displacements from the equilibrium positions, and is a unit vector connecting the equilibrium positions. The Ni atoms were placed at bulk positions with a nearest-neighbour distance of 0.2489 nm. The parameters and were fitted on the elastic constants [Landolt] and cell parameters [Ashcroft] of the bulk. The values of all parameters are given in Table 7.1.
| Ni–H | 971.3 | kJ nm mol-1 | |
|---|---|---|---|
| 20.27 | nm-1 | ||
| 0.563 | nm2 | ||
| CH4 | 17.41 | nm-1 | |
| 480.0 | kJ mol-1 | ||
| 0.115 | nm | ||
| 178.6 | kJ mol-1 rad-2 | ||
| 1.911 | rad | ||
| 4380 | kJ mol-1 nm-2 | ||
| 11.45 | kJ mol-1 rad-2 | ||
| -472.7 | kJ mol-1 rad-1 nm-1 | ||
| Ni–Ni | 28328 | kJ mol-1 nm-2 | |
| -820 | kJ mol-1 nm-2 |
7.2.2 Simulation model
The surface is modelled by a slab consisting of four layers of eight times eight Ni atoms. Periodic boundary conditions have been used in the lateral direction for the Ni-Ni interactions. The methane molecule has interactions with the sixty-four Ni atoms in the top layer of the slab. The surface temperature is set according to the following procedure. The Ni atoms are placed in equilibrium positions and are given random velocities out of a Maxwell-Boltzmann distribution with twice the surface temperature. The velocities are corrected such that the total momentum of all surface atoms is zero in all directions, which fixes the surface in space. Next the surface is allowed to relax for 350 fs. We do the following ten times iteratively. If at the end of previous relaxation the total kinetic energy is above or below the given surface temperature, then all velocities are scaled down or up with a factor of respectively. Afterwards a new relaxation simulation is performed. The end of each relaxation run is used as the begin condition of the surface for the actual scattering simulation.
The initial perpendicular carbon position was chosen 180 nm above the equilibrium -position of the top layer atoms and was given randomly parallel (, ) positions within the central surface unit cell of the simulation slab for the normal incidence simulations. The methane was placed in a random orientation with the bonds and angles of the methane in the minimum of the gas phase potential. The initial rotational angular momentum was generated randomly from a Maxwell-Boltzmann distribution for the given nozzle temperature for all three rotation axis separately. No vibrational kinetic energy was given initially. Initial translational velocity was given to all methane atoms according to the translational energy. The simulations under an angle were given parallel momentum in the [110] direction. The parallel positions have been translated according to the parallel velocities in such a way that the first collision occurs one unit cell before the central unit cell of the simulation box. We tested other directions, but did not see any differences for the scattering.
Each scattering simulation consisted of 2500 trajectories with a simulation time of 1500 fs each. We calculated the (change of) translational, total kinetic, rotational and vibrational kinetic, intramolecular potential, and total energy of the methane molecule; and the scattering angles at the end of each trajectory. We calculated for them the averages and standard deviations, which gives the spread for the set of trajectories, and correlations coefficients from which we can abstract information about the energy transfer processes.
7.3 Results and discussion
We will now present and discuss the results of our simulations. We begin with the scattering angle distribution. Next we will explain this in terms of the energy dissipation processes. Finally we will compare our simulation with previous theoretical and experimental scattering studies, and discuss the possible effects on the dissociation of methane on transition metal surfaces.
7.3.1 Scattering angles
Figure 7.1 shows the scattering angle distribution for different incidence angles with a initial total translational energy of 96 kJ/mol at nozzle and surface temperatures of both 200 and 800 K. The scatter angle is calculated from the ratio between the normal and the total parallel momentum of the whole methane molecule. We observe that most of the trajectories scatter some degrees towards the surface from the specular. This means that there is relatively more parallel momentum than normal momentum at the end of the simulation compared with the initial ratio. This ratio change is almost completely caused by a decrease of normal momentum.

The higher nozzle and surface temperatures have almost no influence on the peak position of the distribution, but give a broader distribution. The standard deviation in the scattering angle distribution goes up from , , and at 200K to , , and at 800K for incidence angles of , , and respectively. This means that the angular width is very narrow, because the full width at half maximum (FWHM) are usually larger than .[wiskerke95] (The FWHM is approximately somewhat more than twice the standard deviation.) The broadening is caused almost completely by raising the surface temperature, and has again primarily an effect on the spread of the normal momentum of the molecule. This indicates that the scattering of methane from Ni(111) is dominated by a thermal roughening process.
We do not observe an average out-of-plane diffraction for the non normal incidence simulations, but we do see some small out-of-plane broadening. The standard deviations in the out-of-plane angle were 0.9∘, 1.8∘, 3.4∘ at a surface temperature of 200K, and 1.7∘, 3.3∘, and 6.0∘ at 800K for incidence angles of 30∘, 45∘, and 60∘ with the surface normal. Raising the (rotational) nozzle temperature has hardly any effect on the out-of-plane broadening.
7.3.2 Energy dissipation processes
Translational energy
Figure 7.2 shows the average energy change of some energy components of the methane molecule between the end and the begin of the trajectories as a function of the initial total translational energy. The incoming angle for all is 0∘ (normal incidence), and both the nozzle and surface are initially 400K. If we plot the normal incidence translational energy component of the simulation at 96 kJ/mol for the different incidence angles, then we see a similar relation. This means that there is normal translational energy scaling for the scattering process in general, except for some small differences discussed later on.

Most of the initial energy of methane is available as translational energy, so it cannot be surprising that we see here the highest energy loss. The translational energy loss takes a higher percentage of the initial translational energy at higher initial translational energies. Since almost all of the momentum loss is in the normal direction, we also see that the loss of translational energy can be found back in the normal component of the translational energy for the non-normal incidence simulations.
The average change of the total energy of the methane molecule is less negative than the average change in translational energy, which means that there is a net transfer of the initial methane energy towards the surface during the scattering. This is somewhat more than half of the loss of translational energy. The percentage of transfered energy to the surface related to the normal incidence translational energy is also enhanced at higher incidence energies. There is somewhat more translational energy loss, and energy transfer towards the surface for the larger scattering angles, than occurs at the comparable normal translational energy at normal incidence. This is caused probably by interactions with more surface atoms, when the molecule scatters under an larger angle with the surface normal.
In Fig. 7.2 we also plotted the average change of methane potential energy and the change of rotational and vibrational kinetic energy of methane. We observe that there is extremely little energy transfer towards the potential energy, and a lot of energy transfer towards rotational and vibrational kinetic energy. Vibrational motion gives an increase of both potential and kinetic energy. Rotational motion gives only an increase in kinetic energy. So this means that there is almost no vibrational inelastic scattering, and very much rotational inelastic scattering.
Figure 7.3 shows the standard deviations in the energy change of some energy components of methane versus the initial translational energy at normal incidence for a nozzle and surface temperature of 200K. (The temperature effects will be discussed below.) The standard deviations in the energy changes are quite large compared to the average values. The standard deviations in the change of the methane translational energy and in the change of methane rotational and vibrational kinetic energy increase more than the standard deviation in the change of methane total energy, when the initial translational energy is increased. We find again an identical relation if we plot the standard deviations versus the initial normal energy component of the scattering at different incidence angles. The standard deviations are much smaller in the parallel than in the normal component of the translational energy, so again only the normal component of the translational energy is important. Although the standard deviations in the translational energy is smaller at larger incidence angles than at smaller incidence angles, we see in Fig. 7.1 that the spread in the angle distribution is almost the same. This is caused by the fact that at large angles deviations in the normal direction has more effect on the deviation in the angle than at smaller angles with the normal.

Surface temperature
An increase of surface temperature gives a small reduction of average translational energy loss (around 5 from 200K to 800K at 96 kJ/mol normal incidence). This is the reason why we do not observe a large shift of the peak position of the scattering angle distribution. However, an increase of surface temperature does have a larger effect on the average energy transfer to the surface, but this is in part compensated through a decrease of energy transfer to rotational energy.
Figure 7.4 shows the standard deviations in the energy change of the translational energy, the methane total energy, and the methane rotational and vibrational kinetic energy as a function of the surface temperature. We observe that the standard deviation in the change of rotational and vibrational kinetic energy hardly changes at increasing surface temperature. At a low surface temperature it is much higher than the standard deviation in the change of the methane total energy. So the baseline broadening of translational energy is caused by the transfer of translational to rotational motion. The standard deviation in the change of the methane total energy increases much at higher surface temperature. This results also in an increase of the standard deviation in the change of translational energy, which means that the surface temperature influences the energy transfer process between translational and surface motion. The spread in the change of translational energy is related to the spread in the scattering angle distributions. It is now clear that the observed broadening of the scattering angle distribution with increasing surface temperature is really caused by a thermal roughening process.

Nozzle temperature
Figure 7.5 shows the dependency of the standard deviations for the different energy changes on the nozzle temperature. From this figure it is clear that the nozzle temperature has relative little influence on the standard deviations in the different energy changes. Therefore we observe almost no peak broadening in the scattering angle distribution due to the nozzle temperature. The nozzle temperature has also no influence on the average change of rotational and vibrational kinetic energy, which means that this part of the energy transfer process is driven primarily by normal incidence translational energy.

We have to keep in mind that we only studied the rotational heating by the nozzle temperature, and that we did not take vibrational excitation by nozzle heating into account. From our wave packet simulations in Chapter 5 we know that vibrational excitations can contribute to a strong enhancement of vibrational inelastic scattering (see also Ref. [mil00b]). So the actual effect of raising the nozzle temperature can be different than sketched here.
7.3.3 Comparison with other studies
Scattering angles and the Hard Cube Model
The angular dependence of scattered intensity for a fixed total scattering angle has only been measured at Pt(111) [yagyu99, yagyu99b]. The measurement has been compared with the predictions of the Hard Cube Model (HCM) as described in Ref. [logan66]. There seems to be more or less agreement for low translational energies under an angle around 45∘ with the surface, but is anomalous at a translational energy of 55 kJ/mol. The anomalous behaviour has been explained by altering the inelastic collision dynamics through intermediate methyl fragments.
Although our simulations are for Ni(111) instead of Pt(111) and we calculate real angular distributions, we will show now that the HCM is insufficient for describing the processes involved with the scattering of methane in our simulation. The HCM neglects the energy transfer to rotational excitations, and overestimates the energy transfer to the surface. This is not surprising, because the HCM is constructed as a simple classical model for the scattering of gas atoms from a solid surface. The basic assumptions are that (1) the interaction of the gas atom with a surface atom is represented by an impulsive force of repulsion, (2) the gas-surface intermolecular potential is uniform in the plane of the surface, (3) the surface is represented by a set of independent particles confined by square well potentials, (4) the surface particles have a Maxwellian velocity distribution [logan66]. Assumption 1 excludes inelastic rotational scattering, because the gas particle is an atom without moment of inertia. So the HCM misses a large part of inelastic scattering. However, it still predicts scattering angles much more below the incidence angles than we found from our simulation. For example: The HCM predicts an average scattering angle with the surface normal of 64∘ from Ni(111), at an incidence angle of 45∘ at a surface temperature four times lower than the gas temperature. This is much more than for Pt(111), because the mass ratio between the gas particle and the surface atom is higher for Ni(111). There are several explanations for this error. First, the assumption 3 is unreasonable for atomic surfaces with low atom weight, because the surface atoms are strongly bound to each other. This means that effectively the surface has a higher mass than assumed [grimmelmann80]. Second, there is no one-on-one interaction between surface atom and methane molecule, but multiple hydrogen atoms interacting with different Ni atoms. Third, the methane molecule is not rigid in contrast to assumption 1. We have followed the energy distribution during the simulation for some trajectories and find that the methane molecule adsorbs initial rotational and translational energy as vibrational energy in its bonds and bond angles when close the surface, which is returned after the methane moves away from it.
It would be nice to test our model with molecular beam experiment of the scattering angles on surfaces with relatively low atom weight, which also try to look at rotational inelastic scattering.
Wave packet simulations
Let us now compare the full classical dynamics with our fixed oriented wave packet simulations as discussed in the previous chapters (see also Refs. [mil98, mil00a, mil00b]), because this was initial the reason to perform the classical dynamics simulations. Again we observe very little vibrational inelastic scattering. This is in agreement with the observations in the time-of-flight experiments on Pt(111) [yagyu00, hiraoka00].
Since we used our wave packet simulations to deduce consequences for the dissociation of methane, we have to wonder whether the observed inelastic scattering in our classical simulations changes the picture of the dissociation in our previous publications. Therefore we have to look at what happens at the surface. We did so by following some trajectories in time.
We find approximately the same energy rearrangements for the classical simulations as discussed for the wave packet simulations for the vibrational groundstate in Chapters 4 and 5 (see also Refs. [mil00a] and [mil00b]). Again most of the normal translational energy is transfered to the potential energy terms of the surface repulsion [see Eq. 7.1]. This repulsive potential energy was only given back to translational energy in the wave packet simulations, because the orientations and surface were fixed. For the classical trajectory simulations presented in this article, the repulsive potential energy is transfered to translational, rotational, and surface energy through the inherent force of the repulsive energy terms. We observe almost no energy transfers to translational energy parallel to the surface, so exclusion of these translational coordinates in the wave packet simulations do not effect our deduction on the dissociation. The energy transfers to the rotational and surface energy during the collision make it harder for the molecule to approach the surface. This will have a quantitative effect on the effective bond lengthening near the surface, but not a qualitative.
The remaining problem deals with the effect of rotational motion on the dissociation probability and steering. Our first intension was to look for the favourable orientation at the surface, but from following some trajectories it is clear that steering does not seem to occur. There is always some rotational motion, and the molecule leaves the surface often with another hydrogen pointing towards to surface than when it approaches the surface. This indicates that multiple bonds have a chance to dissociate during one collision. However, it will be very speculative to draw more conclusion on the dissociation of methane based on the scattering in these classical trajectory simulations. Classical trajectory simulation with an extension of our potentials with an exit channel for dissociation can possibly learn us more.
7.4 Conclusions
We have performed classical dynamics simulations of the rotational vibrational scattering of non-rigid methane from a corrugated Ni(111) surface. Energy dissipation and scattering angles have been studied as a function of the translational kinetic energy, the incidence angle, the (rotational) nozzle temperature, and the surface temperature.
We find the peak of the scattering angle distribution somewhat below the incidence angle of 30∘, 45∘, and 60∘ at a translational energy of 96 kJ/mol. This is caused by an average energy loss in the normal component of the translational energy. An increase of initial normal translational energy gives an enhancement of inelastic scattering. The energy loss is transfered for somewhat more than half to the surface and the rest mostly to rotational motion. The vibrational scattering is almost completely elastic.
The broadening of the scattering angle distribution is mainly caused by the energy transfer process of translational energy to rotational energy. Heating of the nozzle temperature gives no peak broadening. Heating of the surface temperature gives an extra peak broadening through thermal roughening of the surface.
The Hard Cube Model seems to be insufficient for describing the scattering angles of methane from Ni(111), if we compare its assumptions with the processes found in our simulations.
References
- [1] R. Milot, A. W. Kleyn, and A. P. J. Jansen, to be published .
- [2] R. Milot and A. P. J. Jansen, J. Chem. Phys. 109, 1966 (1998).
- [3] R. Milot and A. P. J. Jansen, Surf. Sci. 452, 179 (2000).
- [4] R. Milot and A. P. J. Jansen, Phys. Rev. B 61, 15657 (2000).
- [5] H. Asada, Jpn. J. Appl. Phys. 20, 527 (1981).
- [6] H. Asada and T. Matsui, Jpn. J. Appl. Phys. 21, 259 (1982).
- [7] S. Yagyu, Y. Kino, K. Ozeki, and S. Yamamoto, Surf. Sci. 433-435, 779 (1999).
- [8] S. Yagyu, Y. Kino, T. Ikeuchi, T. Hiraoka, T. Kondo, and S. Yamamoto, Jpn. J. Appl. Phys. 38, 6910 (1999).
- [9] S. Yagyu, T. Hiraoka, Y. Kino, and S. Yamamoto, Appl. Surf. Sci. 165, 217 (2000).
- [10] T. Hiraoka, S. Yagyu, T. Kondo, T. Ikeuchi, and S. Yamamoto, Jpn. J. Appl. Phys. 39, 612 (2000).
- [11] T. Andersson, F. Althoff, P. Linde, M. Hassel, M. Persson, and S. Andersson, J. Chem. Phys. 113, 9262 (2000).
- [12] R. M. Logan and R. E. Stickney, J. Chem. Phys. 44, 195 (1966).
- [13] The NAG Fortran Library Manual Mark 17, 1 ed., NAG Ltd., Oxford, 1995, routine D02CJF.
- [14] D. L. Gray and A. G. Robiette, Mol. Phys. 37, 1901 (1979).
- [15] T. J. Lee, J. M. L. Martin, and P. R. Taylor, J. Chem. Phys. 102, 254 (1995).
- [16] Landolt-Börnstein, Vol. 11 of NS III, edited by K.-H. Hellwege and A. M. Hellwege (Springer, Berlin, 1986).
- [17] N. W. Ashcroft and N. D. Mermin, Solid state physics (Holt, Rinehart and Winston, New York, 1976).
- [18] A. E. Wiskerke and A. W. Kleyn, J. Phys.: Condens. Matter 7, 5195 (1995).
- [19] E. K. Grimmelmann, J. C. Tully, and M. J. Cardillo, J. Chem. Phys. 72, 1039 (1980).
Chapter 8 Concluding remarks
I will give an overview and brief discussion of the research described in this thesis, and make some suggestion for further research.
8.1 Introduction
This thesis is mainly a research article collection. I have tried to keep the contains of the separate articles as close as possible to the originals, when it deals with the results and discussion sections and put the overlap between some articles, dealing with methods and potentials, in a separate chapter. By doing so, I have left the research within the history of time. Over the years our thoughts have been changed by new experimental and theoretical studies. I will give therefore now a point by point overview of the phenomena discussed within different chapters, and give some suggestions for further research on the dissociation of methane on transition metal surfaces based on our findings and recent new developments.
8.2 Scattering
We have performed scattering simulation of methane scattering on a Ni(111) surface with wave packet and classical trajectory dynamics.
We have been using the multiconfigurational time-dependent Hartree (MCTDH) method for our wave packet simulation, because it can deal with a large number of degrees of freedom and with large grids. We used four different PESs for fixed molecular orientations with one, two, and three bonds pointing towards the surface, which are described in Chapter 3. (A harmonic intramolecular PES is adapted to include anharmonicities in the C–H/D distance, the decrease of C–H/D bond energy due to interactions with the flat surface, and the increase of C–H/D bond length also due to interactions with the flat surface.) We used in Chapters 4 and 5 a translational energy of up to 96 kJ/mol normal incidence and all internal vibrations in the ground state. We did not include parallel translational and rotational coordinates in our model. The scattering was in all cases predominantly elastic. However, the observed inelastic scattering of CD4 compared with simulation on CH4 is higher for the PES with an elongated equilibrium bond length close to the surface. Our wave packet simulations in Chapter 6 showed that vibrational excitation of a single mode enhanced inelastic scattering with transfer of translational energy to vibrational energy, especially for the stretch modes in the orientation with three bonds pointing towards the surface.
We have performed classical dynamics simulations of the rotational vibrational scattering of non-rigid methane from a corrugated Ni(111) surface, which is described in Chapter 7. Energy dissipation and scattering angles have been studied as a function of the translational kinetic energy, the incidence angle, the (rotational) nozzle temperature, and the surface temperature. We find the peak of the scattering angle distribution somewhat towards the surface for the incidence angle of 30∘, 45∘, and 60∘ at a translational energy of 96 kJ/mol. This is caused by an average energy loss in the normal component of the translational energy. An increase of initial normal translational energy gives an enhancement of inelastic scattering. The energy loss is transfered for somewhat more than half to the surface and the rest mostly to rotational motion. The vibrational scattering is almost completely elastic, which is in agreement with the wave packet simulations in the vibrational ground state. The broadening of the scattering angle distribution is mainly caused by the energy transfer process of translational energy to rotational energy. Heating of the nozzle temperature gives no peak broadening. Heating of the surface temperature gives an extra peak broadening through thermal roughening of the surface.
8.3 Dissociation
The dissociative adsorption of methane on transition metals is an important reaction in catalysis; it is the rate limiting step in steam reforming to produce syngas, and it is prototypical for catalytic C–H activation. Therefore the dissociation is of high interest for many surface scientists. I gave an overview of the experimental and theoretical studies upon methane dissociation on transition-metal surfaces in Chapter 2. Molecular beam experiments in which the dissociation probability was measured as a function of translational energy have observed that the dissociation probability is enhanced by the normal incidence component of the incidence translational energy. This suggests that the reaction occurs primarily through a direct dissociation mechanism at least for high translational kinetic energies. Some experiments have also observed that vibrationally hot CH4 dissociates more readily than cold CH4, with the energy in the internal vibrations being about as effective as the translational energy in inducing dissociation. A molecular beam experiment with laser excitation of the mode did succeed in measuring a strong enhancement of the dissociation on a Ni(100) surface. However, this enhancement was still much too low to account for the vibrational activation observed in previous studies and indicated that other vibrationally excited modes contribute significantly to the reactivity of thermal samples.
It is very interesting to simulate the dynamics of the dissociation, because of the direct dissociation mechanism, and the role of the internal vibrations. Wave packet simulations of the methane dissociation reaction on transition metals have treated the methane molecule always as a diatomic up to now. Apart from one C–H bond (a pseudo stretch mode) and the molecule surface distance, either (multiple) rotations or some lattice motion were included. None of these studies have looked at the role of the other internal vibrations, so there is no model that describes which vibrationally excited mode might be responsible for the experimental observed vibrational activation. We were not able yet to simulate the dissociation including all internal vibrations with wave packet dynamics. Instead we have deduced from our scattering simulations consequences for the dissociation. We did so by looking at vibrational excitation, the structure deformation, and the energy distribution of the methane molecule, when it hits the surface.
8.3.1 Reaction mechanism and paths
When the molecule hits the surface, we always observe vibrational excitations of the umbrella and bending modes for the CH4 molecule in Chapter 4, especially in the orientations with two or three hydrogens pointing towards the surface. This is due to a favorable coupling that originates from the repulsive interaction with the surface, and the low excitation energies. Deformations of the molecule are predominantly in the bond angles. The changes in the bond angles are, however, too small to allow for the formation of a Ni–C bond, as suggested in the “splats” model of methane dissociation [lee87].
Appreciable excitations of the and stretch modes when methane hits the surface are only observed when one hydrogen atom points towards the surface, or when the intramolecular PES has an elongated equilibrium C–H bond length close to the surface. The repulsion of the surface shortens the C–H bond. This can only be overcome when the intramolecular PES incorporates the effect of a longer equilibrium C–H bond length caused by overlap of occupied surface orbitals with the antibonding orbitals of methane. This agrees with quantum chemical calculations, which show a late barrier for dissociation.
8.3.2 The isotope effect
A nice way to study reaction dynamics is the use of isotopes. The most recent wave packet simulation on the dissociation probability of CH4 and CD4 showed a semiquantitative agreement with the molecular beam experiments of Ref.[hol95], except for the isotope effect and the extracted vibrational efficacy [car98]. Therefore we started a study on the scattering of CD4, which is described in Chapter 5.
When the molecule hits the surface, we observed in general a higher vibrational excitation for CD4 than CH4. The PES with an elongated equilibrium bond length close to the surface gives for both isotopes almost the same deformations, although we observe a somewhat smaller bond lengthening for CD4 in the orientation with three bonds pointing towards the surface. The other model PESs show differences in the bond angle deformations and in the distribution of the excitation probabilities of CD4 and CH4, especially for the PES with only an anharmonic intramolecular potential.
Energy distribution analysis proofs observations and hypotheses obtained from excitation probabilities and structure deformation, and contributes new information on the scattering dynamics. A high increase of vibrational kinetic energy results in higher inelastic scattering. The highest increase of vibrational kinetic energy is found in the asymmetrical stretch modes for all orientations and in the symmetrical stretch mode for the orientation with three bonds pointing towards the surface, when the PES has an elongated equilibrium bond length close to the surface.
8.3.3 The role of vibrational excitation
In Chapter 6 we discuss the effect of vibrational excitation on the dissociation. We used initial translational energies in the range of 32 to 128 kJ/mol. A single vibrational excitation was put in one of the vibrational modes with symmetry in the symmetry group of the molecule plus surface, while the other vibrational modes were kept in the ground state. The potential-energy surface is characterised by an elongation of the C–H bonds when the molecule approaches the surfaces, and a molecule-surface part appropriate for Ni(111). We find that initial vibrational excitations enhance the transfer of translational energy towards vibrational energy and increase the accessibility of the entrance channel for dissociation, which means an increase of inelastic scattering. The largest effects are observed in the orientation with three bonds pointing to the surface. Our simulations predict that initial vibrational excitations of the asymmetrical stretch () and especially the symmetrical stretch () modes will give the highest enhancement of the dissociation probability of methane.
A recent four-dimensional wave packet simulations of the O(3P) + CH4 OH + CH3 reaction, also finds also that the symmetric stretch vibration of CH4 is more efficient in promoting the reaction than the asymmetric stretch [palma00]. It shows also that models that only consider a local C–H stretching of CH4 are not appropriate to make comparisons in which the asymmetric stretch mode is selectively excited.
8.4 Further research
The simulations with our different model PESs show that the internal vibrations play an important role in the dissociation mechanism. Excitation probabilities when the molecule hits the surface show how the translational energy is converted into vibrational energy and it is distributed over the internal modes. These probabilities vary strongly with the PES. As only few internal vibrations contribute to the dissociation, it is important to obtain more information on the real PES for this system. One way of obtaining an more accurate potential is by doing electronic structure calculations. Since we have to deal with the interaction with a metallic surface, only DFT calculation seem to be a reasonable option. It will be still very hard to calculate a full 15 dimensional potential. Therefore a reduced dimensional PES should be constructed.
Our wave packet simulations give an indications that the isotope effect in the methane dissociation is caused mostly by the difference in the scattering behaviour of the molecule in the orientation with three bonds pointing towards the surface. At least multiple vibrational stretch modes should be included for a reasonable description of isotope effect in the methane dissociation reaction. Also our wave packet simulations of vibrational excited methane suggests that both the asymmetrical stretch () and the symmetrical stretch () modes should be included. Our classical trajectory simulations shows that parallel translational is relatively unimportant, and that rotational energy plays an important role for at least the scattering channel. It also shows that it is possible that multiple bonds interact with the surface.
Very important for our understanding of the methane dissociation on transition metal surfaces will be the progress made by molecular beam experiments with state selective excitations with lasers. It can be interesting if this technique is combined with the use of different isotopomers of methane. This will give us also an idea, which reduced dimensional models for our simulations should be tried. I think especially the CHD3 molecule will be a good isotopomer to study further, because we can approximate that the dissociation occurs only along the C–H bond in our dynamics simulations while we include multiple vibrational stretch modes.
References
- [1] M. B. Lee, Q. Y. Yang, and S. T. Ceyer, J. Chem. Phys. 87, 2724 (1987).
- [2] P. M. Holmbad, J. Wambach, and I. Chorkendorff, J. Chem. Phys. 102, 8255 (1995).
- [3] M.-N. Carré and B. Jackson, J. Chem. Phys. 108, 3722 (1998).
- [4] J. Palma and D. C. Clary, Phys. Chem. Chem. Phys. 2, 4105 (2000).
Chapter 9 Summary
The dissociation of methane on transition metals is an important reaction in catalysis. It is the rate limiting step in steam reforming to produce syngas. Molecular beam experiments have shown that the energy in the internal vibrations are about as effective as the translational energy in inducing dissociation.
The published wave packet simulations on the methane dissociation reaction on transition metals have treated the methane molecule always as a diatomic up to now. Besides the C–H bond and molecule surface distance, a combination of other coordinates were included, like (multiple) rotations and some lattice motion. None of them have looked at the role of the internal vibrations. We were not able yet to simulate the dissociation including all internal vibrations. Instead we simulated the scattering of methane in fixed orientations, for which all internal vibrations can be included, and used the results to deduce consequences for the dissociation.
We have been using the multi-configurational time-dependent Hartree (MCTDH) method for our wave packet simulation, because it can deal with a large number of degrees of freedom and with large grids. We have started with a study on different model potential energy surfaces (PESs) that have been developed with Ni(111) in mind. We found that the scattering of CH4 is almost completely elastic for all model PESs. Vibrational excitations when the molecule hits the surface and the corresponding deformation show that for methane to dissociate the interaction of the molecule with the surface should lead to an elongated equilibrium C–H bond length close to the surface.
We studied the isotope effects with CD4 in the same way, and found an elastic scattering somewhat less than for CH4. Energy distribution analysis at the surface of the expectation values of the kinetic energy operators and terms potential energy terms gives enhanced insight in the scattering process. Our simulations give an indications that the isotope effect in the methane dissociation is caused mostly by the difference in the scattering behaviour of the molecule in the orientation with three bonds pointing towards the surface.
Next we looked at the role of single vibrational excitations at the different orientations. A high increase of vibrational kinetic energy results in higher inelastic scattering. The highest increase of vibrational kinetic energy and of the accessibility of the entrance channel for dissociation are found for the asymmetrical stretch mode, and especially for the symmetrical stretch mode. This indicates that the will give the highest enhancement of the dissociation probability.
We ended with classical trajectory calculations of the rotational vibrational scattering of a non-rigid methane molecule from a Ni(111) surface. Energy dissipation and scattering angles have been studied as a function of the translational kinetic energy, the incident angle, the (rotational) nozzle temperature, and the surface temperature. Scattering angles are somewhat towards the surface for the incidence angles of 30∘, 45∘, and 60∘ at a translational energy of 96 kJ/mol. Energy loss is primarily from the normal component of the translational energy and transfered for somewhat more than half to the surface and the rest mostly to rotational motion.
Hoofdstuk 10 Samenvatting
De dissociatie van methaan is een katalytisch interessante reactie. Het is de snelheidsbepalende stap voor de vorming van synthese-gas. Experimenten met moleculaire bundels op éénkristallen van overgangsmetalen hebben aangetoond dat het een directe dissociatie betreft, die zowel door translationele als door vibrationele energie bevorderd wordt.
In het verleden heeft men geprobeerd de dynamica van de dissociatie te simuleren met golfpakketmethoden door methaan te beschouwen als een twee-atomig molecuul. Hoewel hiermee enkele tendensen beschreven kunnen worden, kunnen met deze simulaties de rol van andere vibraties dan de asymmetrische strekvibratie in de reactiedynamica niet bestudeerd worden. Het is echter nog steeds lastig om de dissociatiereactie in hogere dimensies te beschrijven met behulp van golfpakketmethoden. In plaats daarvan is gekeken naar de verstrooiing van methaan met een specifieke oriëntatie, waarbij wel alle vibraties kunnen worden meegenomen, en hieruit informatie te winnen over de dissocatiereactie.
Voor de golfpakket-simulaties is gebruik gemaakt van de multi-configurational time-dependent Hartree (MCTDH) methode, omdat deze methode zeer geschikt is voor systemen met een hoge dimensie en grote roosters. Begonnen werd met de bestudering van verschillende modelpotentialen voor de verstrooiing aan Ni(111). Hierbij werd als eerste gekeken naar de verstrooiingswaarschijnlijkheden van CH4. Het bleek dat de verstrooiing bijna volledig elastisch is voor de bestudeerde potentialen. Daarom is ook gekeken naar de excitatiewaarschijnlijkheden en de verwachtingswaarden van de structuurdeformaties bij het oppervlak. De potentiaal met een verlenging van de evenwichtsbindingslengte bij het oppervlak bleek als enige geschikt om de ingang van het reactiekanaal te beschrijven.
Om het isotoop-effect te bestuderen is vervolgens weer gekeken naar de excitaties en deformaties bij het oppervlak voor CD4. De verstrooiing was weer bijna volledig elastisch, maar minder dan voor CH4. Om beter inzicht te verkrijgen in de verschillen tussen de verstrooiings-processen van beide isotopomeren werd ook de energiedistributie bij het oppervlak bestudeerd door de verwachtingswaarden van de kinetische operatoren en de belangrijkste termen van de potentiaal te berekenen. Het is gebleken dat bij een oriëntatie met drie bindingen gericht naar het oppervlak een groter isotoop-effect mag worden verwacht dan bij andere oriëntaties. Dit verklaart ook waarom de simulaties met een twee-atomig methaanmodel een kleiner isotoop-effect geven dan experimenteel gevonden is.
Vervolgens is er gekeken naar het effect van een enkelvoudige excitatie van de verschillende vibrationele modes bij verschillende oriëntaties. Waargenomen werd dat de inelastische verstrooiing hierdoor toeneemt en meer overdracht van translationele energie naar vibrationele energie plaatsvindt. Ook blijkt het eenvoudiger te worden om het ingangskanaal van dissociatie binnen te gaan. Beide effecten zijn het grootst voor de asymmetrische en vooral de symmetrische strekmodes in de oriëntatie met drie bindingen naar het oppervlak gericht. Excitatie van de symmetrische strekmode brengt hierdoor waarschijnlijk een grotere toename van dissociatiewaarschijnlijkheid teweeg dan de overige modes.
Afsluitend zijn er klassieke dynamica simulaties gedaan aan de verstrooiing van methaan op een Ni(111) oppervlak, waarbij de dimensionaliteit van het model kan worden verhoogd. Hierbij is gekeken naar de effecten van translationele energie, de rotationele nozzle temperatuur, en de temperatuur van het oppervlak voor het energie-overdrachtprocessen en de verstrooiingshoeken. De verstrooiingshoeken zijn enkele graden gericht naar het oppervlak voor de inkomende hoeken van 30∘, 45∘, en 60∘ bij een translationele energie van 96 kJ/mol. Energie-verlies is er voornamelijk in de normaal component van de translationele energie en wordt overgedragen voor iets meer dan de helft aan het oppervlak en voor de rest aan rotatiebeweging.
Chapter 11 List of publications
-
•
R. Milot and A. P. J. Jansen; Ten-dimensional wave packet simulations of methane scattering, J. Chem. Phys. 109, 1966 (1998).
-
•
R. Milot and A. P. J. Jansen; Energy distribution analysis of the wave packet simulations of CH4 and CD4 scattering, Surf. Sci. 452, 179 (2000).
-
•
R. Milot and A. P. J. Jansen; Bond breaking in vibrationally excited methane on transition-metal catalysts, Phys. Rev. B 61, 15657 (2000).
-
•
R. Milot, A. W. Kleyn, and A. P. J. Jansen; Energy dissipation and scattering angle distribution analysis of the classical trajectory calculations of methane scattering from a Ni(111) surface, preprint available at http://arXiv.org/abs/physics/0103053.
Hoofdstuk 12 Dankwoord
Graag wil ik van de gelegenheid gebruik maken om een paar mensen te bedanken die hun bijdragen hebben geleverd aan de totstandkoming van dit proefschrift. Om te beginnen mijn begeleider Tonek Jansen, die mij vijf jaar geleden het bos heeft ingestuurd en wanneer nodig heeft geholpen om er weer uit te komen. Aart Kleyn wil ik bedanken voor zijn bijdrage aan beschrijving van de klassieke dynamica simulaties.
Een promovendus kan niet zonder de steun van zijn soortgenoten. Ik wil daarom alle mensen van de theoriegroep, met wie ik heb mogen samen werken op vloer 10 en in de rekenkamer, bedanken voor het draaiend houden van de machine. In het bijzonder wil ik nog mijn ex-kamergenoot Eric Meijer bedanken voor zijn aangename gezelschap. Ook onze gezamenlijke passie voor de dingetjes sprak mij zeer aan. Daarnaast heb ik veel plezier beleefd aan zijn raad en daad aangaande binaire aangelegenheden als het ware. Bij wijze van spreken is zijn onzichtbare hand dan terug te vinden in de broncodes van mijn programma tot in de povray figuren van dit proefschrift. Chrétien, Danny, Paul, Vili en Willy bedankt voor jullie gezelschap tijdens de lunch en de bijeenkomsten in Leuteren. Ik zal jullie missen, en ook de overige leden van SKA met wie ik altijd gezellig koffie heb mogen drinken. Alle achterblijvers wil ik succes en sterkte wensen met het afronden van hun proefschrift binnen vier jaar.
De afgelopen jaren heb ik natuurlijk meer gedaan dan dit promotie-onderzoek. De tijd die ik met familie, vrienden en teamgenoten heb mogen doorbrengen was mij het meest dierbaar. Bedankt voor jullie liefde, steun en vertrouwen. Hierbij is het jullie vergeven dat jullie steeds weer vroegen wanneer het nu eens af is.
Het gaat jullie goed!
Hoofdstuk 13 Curriculum vitae
Op 6 oktober 1972 werd Robin Milot geboren in Utrecht. Nadat hij in 1991 het (ongedeeld) VWO-diploma behaalde aan de Thorbecke Scholengemeenschap te Utrecht, begon hij aan de Universiteit Utrecht met de studie Scheikunde. In 1995 werd het doctoraalexamen behaald met als hoofdvak Kristal- en Structuurchemie. Als keuzepakketten werden Fysische Chemie en Fysica & Chemie van Materialen gevolgd. Op 1 april 1996 trad hij in dienst van NWO om zijn promotie-onderzoek, zoals beschreven in dit proefschrift, uit te voeren bij het Schuit Katalyse Instituut van de Technische Universiteit Eindhoven.
Omslag: De foto op de omslag is door mij genomen van de Canyon de Chelly in Arizona (VS). De canyon staat symbool voor een potentiaal-oppervlak met daarin de twee rotspieken als golfpakket. © 1999 Robin Milot.