[
Fresnel filtering in lasing emission from scarred modes of wave-chaotic optical resonators
Abstract
We study lasing emission from asymmetric resonant cavity (ARC) GaN micro-lasers. By comparing far-field intensity patterns with images of the micro-laser we find that the lasing modes are concentrated on three-bounce unstable periodic ray orbits, i.e. the modes are scarred. The high-intensity emission directions of these scarred modes are completely different from those predicted by applying Snell’s law to the ray orbit. This effect is due to the process of “Fresnel filtering” which occurs when a beam of finite angular spread is incident at the critical angle for total internal reflection.
pacs:
PACS numbers: 05.45.Mt, 42.55.Sa, 42.60.Da]
Understanding the correspondence between classical phase space structures and wave functions for a general classical dynamics is the goal of investigations in quantum/wave chaotic systems [1]. Generic Hamiltonian systems have mixed phase spaces which consist of tori (which support quasi-periodic orbits), stable periodic orbits with their associated islands of stability, and unstable periodic orbits which lie in regions of phase space with chaotic motion. The simplest possibility, explored in the early days of the field, was that quantum wavefunctions, when projected into phase space would cover approximately uniformly the various classical invariant sets; hence wavefunctions associated with chaotic regions would fill such regions uniformly (with fluctuations) as would the corresponding ergodic classical trajectories. We now know [2] that this situation is only realized at extremely high quantum numbers and that states localized on unstable classical periodic orbits in the chaotic regions of phase space (“scars”) are common in many systems of interest [3, 4]. The same considerations which lead to scarred eigenstates of the Schrödinger equation also imply that the wave equation of electromagnetism will have scarred modes when its boundary conditions (e.g. shape of a resonator) generate chaotic ray motion; and indeed such modes have been previously observed in microwave cavities [5].
It has been shown that dielectric optical micro-cavities and micro-lasers represent a realization of a wave-chaotic system and one that presents many unsolved problems for optical physics [6, 7, 8, 9, 10]. For example, quadrupole-deformed InGaAs and GaAs quantum cascade micro-lasers which lased on stable bow-tie modes were found to produce 1000 times higher output power than undeformed cylindrical lasers of the same type which lased on whispering gallery modes [8, 10]. The mechanism of mode selection and the increase of output power in these devices is not currently understood. Recently we reported preliminary data [11] indicating that in deformed GaN diode lasers the stable bow-tie modes are not selected but instead unstable “triangle” modes are the dominant ones. This was the first time that scars had been observed in an active as opposed to a passive cavity. Moreover, while these modes are based on triangular periodic orbits which strike the boundary near the critical angle for total internal reflection, their emission intensity pattern is completely different from that expected by applying Snell’s law to the underlying periodic orbit. Below we interpret this surprising finding as due to an effect we term “Fresnel Filtering” which arises when a beam of finite angular spread is partially transmitted through a dielectric interface near the total internal reflection condition. This is a generic effect, somewhat similar to the well-studied Goos-Hänchen shift for a reflected beam [15, 16], but it has not to our knowledge been clearly identified or studied in the optics literature. We are able to establish this effect because, in contrast to earlier studies, we simultaneously collect far-field emission patterns and images of the sidewall of the resonator. Two other groups have very recently reported lasing emission from dielectric micro-cavities which they interpret as due to scarred modes [13, 14].
The experimental set-up is shown schematically in Fig. 1(a). A GaN micro-laser of refractive index is optically pumped at 355nm and emits at 375nm. The structure is based on MOCVD-grown GaN on a sapphire substrate which is etched from a mask using standard photolithography to create a high pillar with a quadrupolar deformation of the cross-section, with . Light emitted from the laser is imaged through an aperture subtending a angle and lens onto a CCD camera which is rotated by an angle in the far-field from the major axis. A bandpass filter restricts the imaged light to the stimulated emission region of the GaN spectrum. The CCD camera records an image of the intensity profile on the sidewall of the pillar as viewed from the angle which is converted from pixels to angular position . Summing these intensities yields the total far-field intensity emitted in direction . Data were taken for quadrupole lasers with , and and for other shapes as well. The full data set will be analyzed in a later work, here we focus on the data for
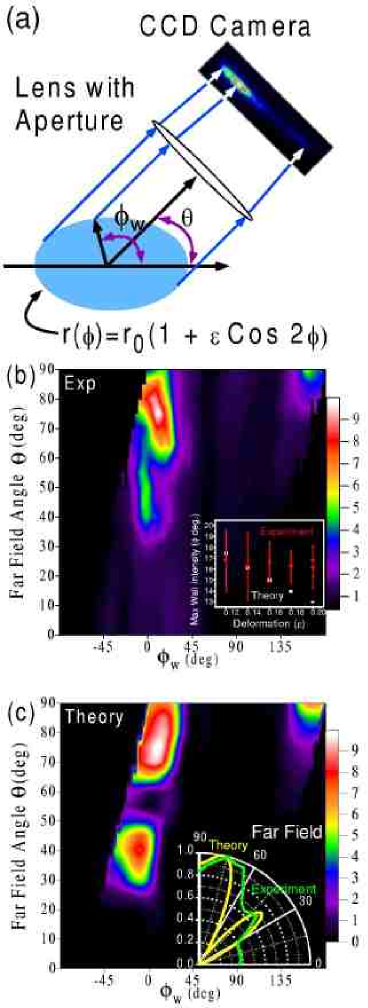
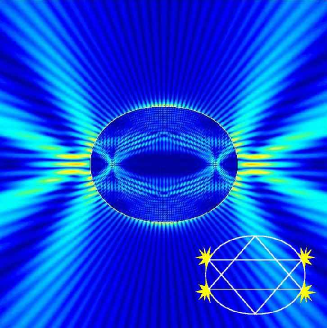
which show a simple scarred mode. In Fig. 1(b) these data are displayed in a color scale which identifies both the highest emission directions and the brightest points on the sidewall (labelled by their angle ). The data show that the maximum intensity in the 1st quadrant is observed at angle and is emitted from the region of the sidewall around . The data also show a secondary bright spot at slightly negative and another one at . The observation of a small number of well-localized bright spots on the sidewall suggests a lasing mode based on a short periodic ray trajectory. The two-bounce stable Fabry-Perot mode would emit from in the direction . The stable four-bounce bow-tie mode, dominant in the devices of Ref. [8], is also inconsistent with our data. It is very low-Q at this deformation due to its small angle of incidence and would give bright spots at , far away from the brightest spot at . There is however a pair of symmetry-related isosceles triangular orbits (inset, Fig. 2(a)) with bounce points very close to the observed bright spots (see inset to Fig. 1(b)). These orbits are unstable for with trace of the monodromy matrix equal to -5.27 at . The two equivalent bounce points in each triangle at and have , very near to the critical value, , whereas the bounce points at have and should emit negligibly (inset to Fig. 2(a)). This accounts for the three bright spots observed experimentally in Fig. 1(b) (the fourth spot at does not emit into the first quadrant, see also inset to Fig. 3(a)). Solutions for the quasi-bound states of this resonator in the empty cavity can be found numerically, both in real-space and phase space, and we find that indeed there exist such scars (see Figs. 2(a), (b)). Here we plot both the modulus of the electric field in real-space and the projection of the Husimi distribution of the mode onto the surface of section of the resonator [17]. The Husimi distribution is a (gaussian) smoothed version of the Wigner transform of the mode, which represents a wavefunction or mode as a phase space density consistent with the uncertainty principle. Projection onto the surface of section then gives a measure of the density of rays which strike the boundary at a given position, and a given incidence angle, . Additionally we evaluate this mode in the far-field and find an emission pattern in good agreement with the experimental measurement (see inset, Fig. 1(c)). Finally, if we take this scarred mode and propagate it numerically via a lens transform [18] we obtain the result shown in Fig. 1(c), which is in quite reasonable agreement with the experimental data of Fig. 1(b), taking into account that the lasing mode should differ somewhat from the resonance of the empty cavity. Hence we conclude that the dominant lasing mode in the experiment is such a scarred mode.
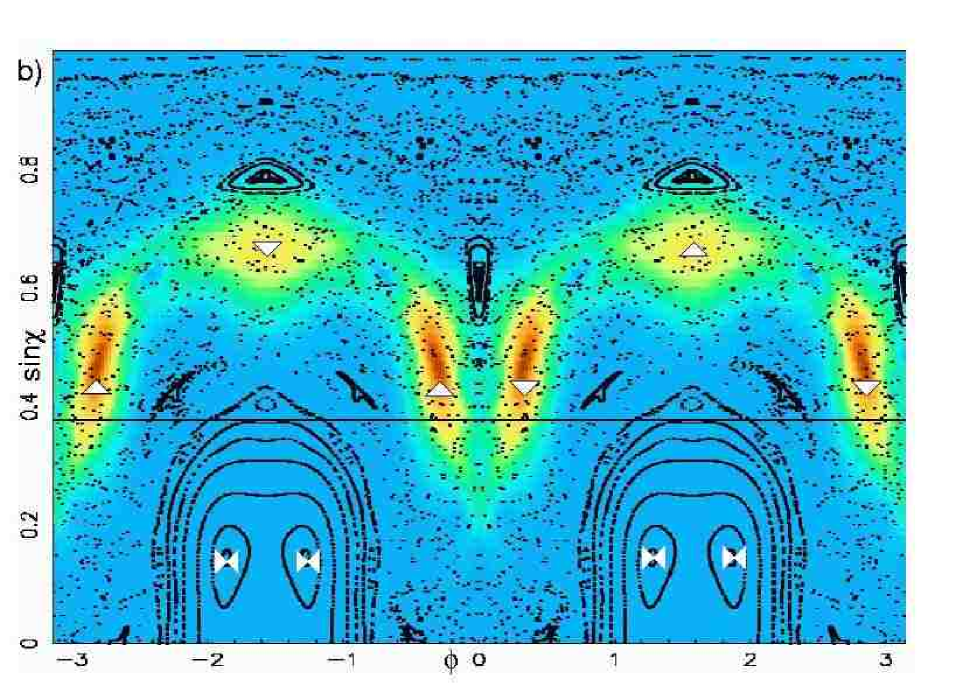
The data of Figs. 1(a), (b) however present an intriguing puzzle from the point of view of ray optics. A mode localized on these triangular orbits would be expected to emit from the four bounce points approximately in the tangent direction according to Snell’s law; this means that the bright spot at should emit into the direction (Fig. 3(a)), whereas the data clearly indicate that the bright spot emits in the direction . Thus the emission pattern violates the intuitive expectations of ray optics by , a huge discrepancy (see Fig. 3). Moreover the ratio , so we are far into the regime in which the wavelength is small compared to the geometric features of the resonator and ray optics would be expected to be a good approximation. The resolution of this apparent paradox is suggested by the numerical data of Fig. 2(b). It is clear that the scarred mode, while localized around the triangle orbit, has a significant spread in angle of incidence, . This means that we must regard the scarred mode as a (non-gaussian) beam with a large angular spread, with some components almost totally reflected and other components transmitted according to the Fresnel transmission law. This law is rapidly varying near and strongly favors the components with lowest angle of incidence. Thus the centroid of the transmitted beam is shifted away from the tangent direction (i.e. away from the geometric optics result for a plane wave) by an amount by this effect, which we call “Fresnel filtering”. Since the sidewall of the resonator is curved, strictly speaking the Fresnel law (which is for an infinite flat surface) does not hold, but the curvature corrections should be small when , as is the case here. Thus we can evaluate the Fresnel filtering effect theoretically for a flat dielectric interface. We express the outgoing beam in the angular spectrum representation[20] and evaluating the resulting integral by the saddle point method in the asymptotic farfield region, we obtain the far-field intensity pattern [19]:
where is the probability density of sine of the incidence angle for the beam and . For the plane interface , while for the equivalent resonator , where is the unit normal at the bounce point.
To model the experiment we assume that the probability distribution for the incidence angle is approximately the same as the cross-section of the Husimi distribution of Fig. 2(b) evaluated at the triangle bounce point . In Fig. 3 we plot the beam emission angle defined as the angular maximum of the far-field pattern vs. incidence angle . We find a very large angular shift , in approximate agreement with experiment (we don’t expect precise quantitative agreement since the curvature of the resonator also has some effect on the far-field pattern, giving a different value of than for the planar interface).

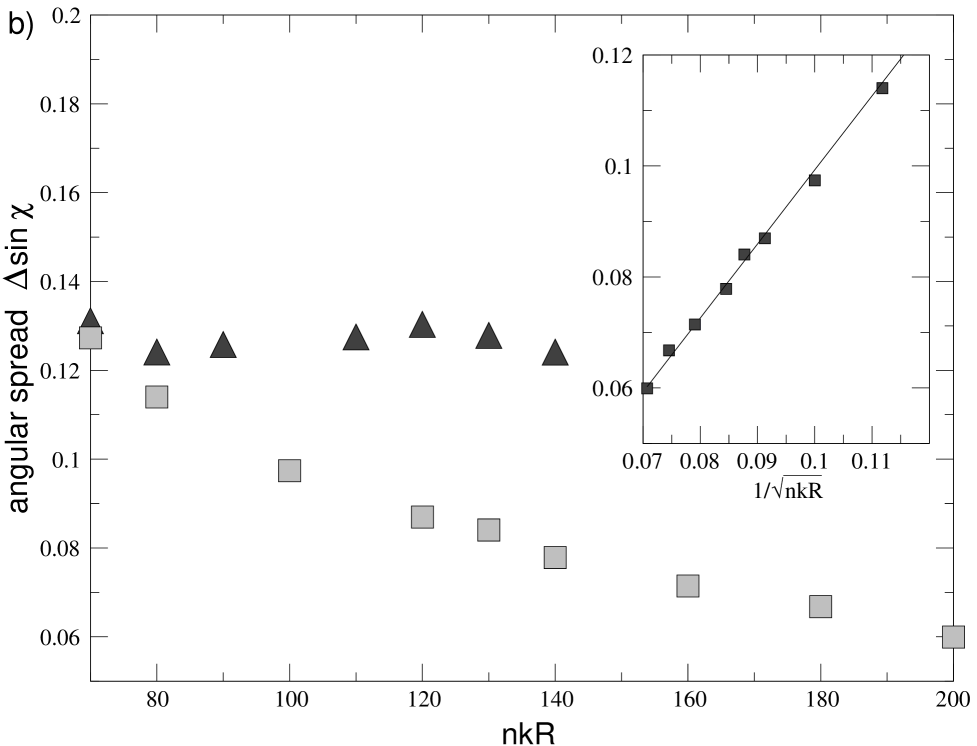
The size of the Fresnel filtering effect depends strongly on the angular beam spread. For gaussian resonator modes one can show that this spread tends to zero as [19], (see inset Fig. 3(b)). Since our numerical simulations of the scarred mode are for , whereas the experiment corresponds to , one may ask whether the large Fresnel Filtering angle found in Fig. 3(a) (for ) will extrapolate correctly to agree with the experiment. As there is currently no theory of this scaling for scarred modes, we studied the scaling of the angular width numerically (Fig. 3(b)). We found no detectable decrease in the angular width with , in clear contrast to the behavior of the gaussian modes. Thus, while the Fresnel Filtering effect should be present for gaussian resonator modes based on stable periodic orbits, it appears to be significantly enhanced for unstable (scarred) modes.
In conclusion, we have found that the dominant lasing mode in quadrupolar GaN micro-lasers are unstable (scarred) modes. For resonators with chaotic ray dynamics, such scarred modes play a special role as they allow high-Q resonances despite the ray chaos. Such modes exhibit a novel emission pattern, which is completely different from that expected by applying Snell’s law to the underlying periodic ray trajectory, due to the phenomenon of Fresnel Filtering.
We acknowledge helpful discussions with P. Jacquod. This work was supported by NSF grants DMR-0084501, PHY-9612200 and AFOSR grant F49620-00-1-0182-02.
REFERENCES
- [1] M. C. Gutzwiller, Chaos and Quantum Physics, (Springer-Verlag, New York, 1990).
- [2] T. Prosen and M. Robnik, J. Phys. A - Math Gen 27 8059 (1994).
- [3] E. J. Heller, Phys. Rev. Lett. 53, 1515 (1984).
- [4] L. Kaplan and E. J. Heller, Ann. Phys.- NY 264, 171 (1998).
- [5] S. Sridhar and E. J. Heller, Phys. Rev. A 46, R1728 (1992).
- [6] A. Mekis, J. U. Nöckel, G. Chen, A. D. Stone and R. K. Chang, Phys. Rev. Lett. 75, 2682 (1995).
- [7] J. U. Nöckel and A. D. Stone, Nature 385 45 (1997).
- [8] C. Gmachl, F. Capasso, E. E. Narimanov, J. U. Nöckel, A. D. Stone, J. Faist, D. L. Sivco, and A. Y. Cho, Science 280, 1493 (1998).
- [9] E. E. Narimanov, G. Hackenbroich, Ph. Jacquod and A. D. Stone, Phys. Rev. Lett. 83 4991 (1999).
- [10] S. Gianordoli, L. Hvozdara, G. Strasser, W. Schrenk, J. Faist, E. Gornik, IEEE J. Quantum Elect., 36, 458 (2000).
- [11] N. B. Rex, et al.; abstract, CLEO/QELS 2000, 2001; Proc. SPIE 3930, 163 (2000).
- [12] A. D. Stone, Physica Scripta T90, 248 (2001).
- [13] E. Narimanov et al., CLEO/QELS abstract 2001.
- [14] S.-B. Lee et al., unpublished.
- [15] F. Goos and H. Hänchen, Ann. Physik 1, 333 (1947).
- [16] B. R. Horowitz and T. Tamir, J. Opt. Soc. Am. 61, 586 (1971).
- [17] S. D. Frischat and E. Doron, J. Phys. A: Math Gen., 30, 3613 (1997).
- [18] J. W. Goodman, Introduction to Fourier Optics (Second Edition, McGraw-Hill, New York, 1996)
- [19] H. E. Tureci, H. G. L. Schwefel and A. D. Stone, unpublished.
- [20] L. Mandel and E. Wolf, Optical Coherence and Quantum Optics (Cambridge University Press, New York, 1995)