(to appear in Phys. Rev. Lett.)
Photoabsorption Spectra of Na clusters: Thermal Line-Broadening Mechanisms
Abstract
Photoabsorption cross sections of small sodium cluster cations (Na, 3,5,7 and 9) were calculated at various temperatures with the time-dependent local-density-approximation (TDLDA) in conjunction with ab initio molecular dynamics simulations, yielding spectra that agree with measured ones without ad-hoc line broadening or renormalization. Three thermal line-broadening mechanisms are revealed: (I) lifting of level degeneracies caused by symmetry-breaking ionic motions, (II) oscillatory shifts of the entire spectrum caused by breathing vibrations, and (III) cluster structural isomerizations.
pacs:
PACS: 36.40.Vz, 36.40.Mr, 31.15.Ar, 71.15.MbOptical spectroscopy provides invaluable insights into the electronic structure, ionic configurations, thermal processes and dynamics in metal clusters, as well as about the size-dependent evolution of these properties. Indeed, investigations of these issues have been pursued rather intensively for over a decade both experimentally with photodepletion spectroscopy [1, 2] and theoretically [3, 4, 5, 6, 7, 8, 9] with the main methodology employing the TDLDA [3, 5, 10] in conjunction with either jellium models [3, 4, 5] (including allowance for shape-deformations) where the ionic background is smeared out uniformly, or with electronic structure calculations of various degree of sophistication where the discrete nature of the ions is incorporated accurately [7, 8] or perturbatively [9]. While valuable information pertaining to the optical excitations and damping mechanisms in metal clusters has been obtained through such studies, including the sensitivity of optical features to cluster geometries, a first-principles theoretical description of the optical line-shapes, the absolute absorption cross-sections, the relevant microscopic line-broadening mechanisms and their thermal variations, is lacking. This is reflected in the common ad-hoc employment of line broadening through convolution of spectral lines calculated for selected static cluster configurations with Gaussian or Lorentzian functions [3, 4, 5, 7, 8], or (multiplicative) renormalization of the calculated spectra to the measured ones [9, 11].
In this letter, we demonstrate that photoabsorption cross sections, , calculated via the TDLDA along finite-temperature Born-Oppenheimer (BO) local-spin-density (LSD) molecular dynamics (MD) (BO-LSD-MD [12]) phase-space trajectories, provide a quantitative ab-initio description of the absolute magnitudes, peak positions, and line shapes of optical absorption spectra measured at various temperatures from Na (3, 5, 7 and 9) clusters [2]. Furthermore, analyses of the results, and in particular the temporal correlations between the calculated (where the superscript denotes the value at instant ) and the dynamically evolving cluster configurations, reveal three thermally induced mechanisms which govern the spectral characteristics: (I) symmetry breaking of the optimal (0 K) cluster geometries due to thermal motion of the ions, leading to lifting of electronic level degeneracies and resulting in splitting (fragmentation) of spectral lines; (II) symmetry conserving breathing motions that modulate the effective density, resulting in oscillatory frequency shifts of the entire spectrum (”spectral sweeping”) that influence the optical absorption peak positions and line width; (III) opening of the accessible configurational space, resulting in structural isomerization and consequent electronic structure and spectral variations. The first two mechanisms are operative for smaller clusters (Na and Na) even at relatively low temperatures (e.g. 100 K), while all three occur for the larger ones. Furthermore, the thermal dependence of the spectral characteristics is analyzed, resulting in remarkable first-principles agreement between the calculated and measured optical absorption cross sections.
The Kohn-Sham (KS) equations with generalized gradient corrections (GGA) [13] and non-local pseudopotentials [14] were solved for Na clusters (3, 5, 7, and 9), and based on the Hellman-Feynman forces, finite temperature trajectories were generated by Langevin dynamics through the use of the BO-LSD-MD (with GGA) method [12]. For each cluster size, starting from the (presumed [7]) GGA-optimized ground state (GS) geometry and an equilibration of 10 ps duration, the system was allowed to evolve dynamically at the prescribed temperature for an additional period of 10 ps. At each instant , the excitation energies were determined by solving the TDLDA eigenvalue problem [10]
where and denote particle-hole pairs [15], and the corresponding KS orbital energy differences. The coupling matrix is given by
with the GS electron density , the product of two (real) KS orbitals , and the LDA exchange-correlation potential . The oscillator strength (OS)
| (1) |
corresponding to the transition energies , were accumulated in bins of width eV yielding the absolute photoabsorption cross section per valence electron
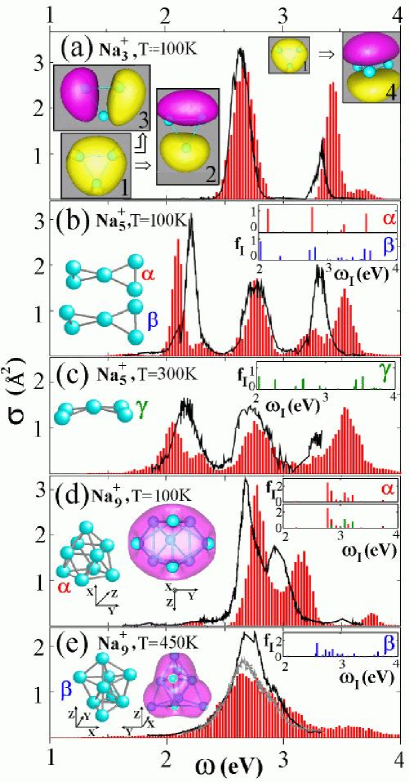
We note first the overall good agreement between the magnitudes and shapes of the calculated and measured photoabsorption cross sections (shown here for Na, 3,5 and 9); compare the red histograms with the black curves in Fig. 1, and note that neither (artificial) numerical broadening nor a renormalization of the spectra has been applied. The slight deviations in peak positions are within the known accuracy of the TDLDA (0.2 eV) [10].
The calculated Na spectrum at 100 K (Fig. 1a) exhibits a low energy peak originating [16] from two transitions =2.65 eV, from the occupied s-like orbital to two empty p-like KS orbitals located in the plane of the Na equilateral triangle (see grey insets 1, 2 and 3 at the left of Fig. 1a). The high energy peak at 3.41 eV is due to an excitation to another p-like orbital that is perpendicular to the cluster plane (grey inset 4 in Fig. 1a). In the experiments is determined from the depletion of the Na intensity due to dissociation following absorption of a photon . Excitation into the in-plane anti-bonding orbitals (insets 2 and 3) promotes such dissociation and is accompanied by exhaustion of the OS for the first (lower energy) measured peak. Excitation into the out-of-plane orbital (inset 4) has no direct destabilizing effect and consequently in the measurements only 66% of the Thomas-Reiche-Kuhn sum rule (TRK) [10] is observed while the full TRK sum rule is found in the theoretical spectrum shown in Fig. 1a (as well as in all the calculated spectra that we show here).
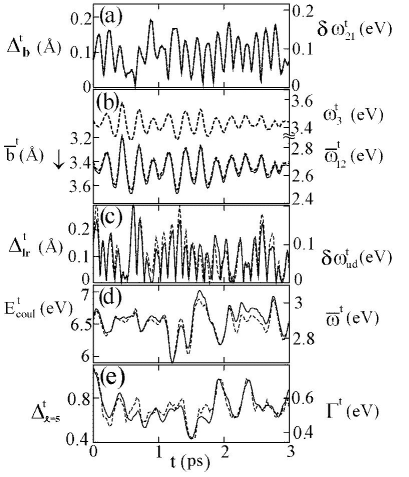
Thermal motions distort the D3h symmetry of the Na GS and the degeneracy of the low-energy transitions and is lifted. Indeed, the evolution of coincides with the temporal behavior of the standard deviation of the three bond distances (see Fig. 2a). Additionally, the mean bond distance is strongly anti-correlated with the mean frequency as well as with the position of (compare the solid line with the lower and upper dashed curves in Fig. 2b) - that is, an increase of the ionic density (decrease of ) results in a blue shift of the entire spectrum. Thus, the spectral line width of Na can be fully understood in terms of line-splitting and spectral sweeping with the first caused by symmetry breaking (degeneracy
lifting, mechanism I) and the latter by breathing vibrations of the cluster (density oscillations, mechanism II).
Similarly, the finite temperature dynamics of Na distorts (even at 100 K) the optimal D2d GS symmetry (see GS in Fig. 1b where the perpendicular left and right triangles are equivalent, and compare to the instantaneous structure shown in Fig. 1b with an elongated left triangle), resulting in fragmentation (I) of the GS line at 2.8 eV into two separate spectral lines and [17] (compare red and blue lines in the up-right inset of Fig. 2b). Consequently, the temporal variation of the absolute difference of the average bond lengths in the left and the right triangle (, serving as a measure of the thermal structural distortion) correlates directly with the spacing between the frequencies of the spectral fragments (see solid and dashed curve in Fig. 2c).
While the relatively moderate structural distortions occurring at 100 K are not sufficient to lift the degeneracy of the states associated with the low energy absorption line of Na (at 2 eV, compare insets and at the upper right of Fig. 1b) which remains relatively sharp, increase of the temperature to 300 K results in bent configurations (see instantaneous structure on the left in Fig. 1c) where the low energy line is fragmented (see inset at the upper right of Fig. 1c), resulting in enhanced broadening of that spectral line (compare Figs. 1b and 1c). Further broadening of the lines is caused by the aforementioned breathing modes (spectral sweeping mechanism II) reflected in the direct correlation between the interionic Coulomb repulsion (as a measure of the ionic density) and the average excitation energy shown in Fig 2d for the 300 K simulation.
For larger clusters, the occurrence of thermal isomerizations opens an additional line-broadening channel (III) [18]. The GS structure of the Na cluster [19] is shown at the left of Fig. 1d (marked ) and the TDLDA spectrum calculated for this static configuration exhibits several absorption lines distributed in a bimodal-like manner (see top inset at the upper right of Fig. 1d). This bimodality, which is in contradiction to the single-line spectrum predicted by the jellium model [5], originates from the ”oblate shape” of the cluster with radii 2.68 Å along the D3h symmetry axis (z in Fig. 1d) and 3.22 Å in the xy plane (these radii were determined from the diagonalized moment of inertia of the ionic GS structure ). The total electron density (see purple isosurface in Fig. 1d) is almost an ideal oblate spheroid. A decomposition of the OS of the D3h GS into a z (3 term in eq. 1) and the xy contribution (1 and 2 terms) shows clearly that, as expected [3], the smaller spatial dimension in the z direction is associated with a higher excitation energy (compare green and red line in bottom inset at the upper right of Fig. 1d). The bimodal character of the 100 K photoabsorption spectrum is evident in both the measured and calculated spectra (Fig. 1d), with further broadening caused by thermal motions through line-fragmentation
and breathing vibrations of the cluster (mechanisms I and II).
The main thermal effect observed in the spectra of Na is the conversion of the low temperature (e.g. 100 K, Fig. 1d) bimodal spectrum to one with a single broad maximum at higher temperatures (e.g. 450 K, Fig. 1e). This change in the spectrum is caused mainly by transformations between the GS geometry (, Fig. 1d) and the structural isomer (see configuration on the left of Fig. 1e). The static spectrum of the isomer is shifted to lower energies with respect to that of the GS () structure (compare top insets marked and at the upper right corners of Figs. 1d and 1e). Thus, the high-temperature broad spectral feature (Fig. 1e) is due to contributions from both the and isomers to the phase-space trajectories generated by the Langevin MD simulation at 450 K [20, 21].
The -isomer may be characterized as having an octupolar shape, reflected in the shape of the electron density shown in Fig. 1e (see purple isosurface). To quantitatively analyze the spectral broadening caused by transitions (at high T) between the GS () and the -isomer (which involve changes in shape-multipolarity) we calculate the dimensionless multipole shape parameters [22], where () are the polar coordinates of the ith ion with respect to the center-of-mass of the cluster and is the density parameter of bulk Na. We defined a parameter that measures the deviation from sphericity due to the multipole modes up to the order . Fig. 2e shows a remarkable correlation (84%, see ref. [23]) between and the width of the spectrum at time ( is twice the standard deviation of for eV). Furthermore, including in such analysis only quadrupole and octupole deformations (i.e. ) results in a similar high value of (73 %), while limiting consideration to the quadrupole deformation alone (i.e. ) yields a poor correlation (19 %) pointing to the strong influence of octupolar deformations on the optical response of metal clusters (even closed shell ones i.e. Na). This analysis confirms our conclusion pertaining to the importance of the isomerization mechanism (III) in explaining the thermal evolution of photoabsorption spectra (particularly at high temperatures).
In summary, we demonstrated that calculations of absolute photoabsorption cross sections using the TDLDA in conjunction with ab initio MD simulations allow first-principles quantitative description and interpretation of optical spectra measured for sodium cations at various temperatures. Spectral line fragmentation resulting from symmetry-breaking ionic motions that lift electronic level degeneracies, frequency shifts (spectral sweeps) of the entire spectrum due to symmetry-conserving breathing vibrations, and structural isomerizations are identified as the main thermal line-broadening mechanisms with the first two operative for the smaller cluster (Na and Na) and all three for larger ones.
This work is supported by the US DOE, the Deutsche Forschungsgemeinschaft (MM), and the Academy of Finland (HH). We thank R.N. Barnett for discussions. Computations were done on Cray T3E at NERSC Berkeley and NIC Jülich.
REFERENCES
- [1] W.A. de Heer et al., Phys. Rev. Lett. 59, 1805 (1987); C. Wang et al. Z. Phys. D 19, 13 (1991); C.Brechignac et. al, Chem. Phys. Lett. 164, 433 (1989)
- [2] M.Schmidt et al., Phys. Rev. B 59, 10970 (1999)
- [3] W.Ekardt, Phys. Rev. Lett. 52, 1925 (1984); W.Ekardt and Z.Penzar, Phys. Rev. B 43, 1322 (1991);
- [4] J.M.Pacheco et al., Phys. Rev. Lett. 61, 294 (1988)
- [5] C.Yannouleas et al., Phys. Rev. Lett. 63, 255 (1989)
- [6] G.F.Bertsch and D.Tomanek, Phys. Rev. B 40, 2749 (1989)
- [7] V.Bonacic-Koutecky et al, J. Chem. Phys. 104, 1427 (1996)
- [8] G.Onida et al., Phys. Rev. Lett. 75, 818 (1995); A. Rubio et al., Phys. Rev. Lett. 77, 247 (1996); I. Vasiliev et al., Phys. Rev. Lett. 82, 1919 (1999)
- [9] J.M.Pacheco and W.D.Schoene, Phys. Rev. Lett. 79, 4986 (1997); Phys. Rev. Lett. 81 5703 (1998)
- [10] M.E.Casida, in: Recent Developments and Applications in Modern Density-Functional Theory, ed. J.M. Seminario (Elsevier, Amsterdam, 1996) p. 391
- [11] V.Kresin, Phys. Rev. Lett. 81, 5702 (1998)
- [12] R.Barnett and U.Landman, Phys. Rev. B 48, 2081 (1993)
- [13] J.P.Perdew et al., Phys. Rev. Lett. 77, 3865 (1996)
- [14] N.Troullier, and J.L.Martins, Phys. Rev. B 43, 1993 (1991); The core radii (in units of ) are (2.45) and (2.6), with as the local component. A plane-wave basis with a 10 Ry cutoff was used.
- [15] The convergence of with respect to the size of the computational cell (48 in all three dimensions), and the number of orbitals (30-60) has been carefully checked.
- [16] For the smallest clusters (Na and Na) an analysis of the largest elements in (see eq. 1 and ref. [10]) allows assignment of the particular particle-hole pairs that make a dominant contribution to a certain optical line . Such analysis is not fruitful for larger clusters whose level spectra are more dense.
- [17] The OS of the Na 2.77 eV line stems mainly from the transition from the first occupied orbital (with an elongated s-like shape) to two degenerate orbitals spatially separated on one of the two triangles.
- [18] While in the text we focus our discussion on the larger cluster Na, we remark that isomerization broadening was found by us also for sodium Na, where at 300 K we observed structural transitions between the D5h pentagonal bipyramidal GS and a D6h planar hexagonal isomer (lying 141 meV above the GS) resulting in a bimodal spectral maximum for 2.4 eV, in addition to a broad absorption peak at 3.5 eV (see ref. [2]).
- [19] The Na GS structure (a tricapped trigonal prism, in Fig. 1d) is lower by 98 meV than the Na GS reported in ref. [7] and depicted as configuration on the left of Fig. 1e (a bicapped bipyramide with a C2v symmetry).
- [20] We note that attempts to describe the simulated 450 K spectrum shown in Fig. 1e by Boltzmann-weighted averaging of the broadened static 0 K spectra of the and isomers (insets in Figs. 1d and 1e) do not lead to satisfactory agreement with our ab-initio results and the experimental data, unless unphysically large broadening parameters are used. Furthermore, this procedure fails to describe the observed shift of the high-temperature spectrum to lower energies due to thermal expansion of the cluster.
- [21] From our simulations of Na at 450 K, we observed a direct correlation between the ionic repulsion energy and the mean absorption frequency (similar to that shown in Fig. 2d for Na). The line broadening due to the breathing mode (mechanism II) implied by such correlation, contributes merely 66 meV to the total width (0.6 eV, see Fig. 1e).
- [22] M.Koskinen et al., Z. Phys. D 35, 285 (1995)
- [23] The coefficient is a common measure of the correlation between two time series and with means and and standard deviations and , respectively.