LIGO TD-000012-R
Doppler-Induced Dynamics of Fields in Fabry-Perot Cavities with Suspended Mirrors111published in Applied Optics, Vol. 40, No. 12, 20 April 2001, pp. 1942-1949
Malik Rakhmanov
Physics Department, University of Florida, Gainesville, FL 32611
The Doppler effect in Fabry-Perot cavities with suspended mirrors is analyzed. Intrinsically small, the Doppler shift accumulates in the cavity and becomes comparable to or greater than the line-width of the cavity if its finesse is high or its length is large. As a result, damped oscillations of the cavity field occur when one of the mirrors passes a resonance position. A formula for this transient is derived. It is shown that the frequency of the oscillations is equal to the accumulated Doppler shift and the relaxation time of the oscillations is equal to the storage time of the cavity. Comparison of the predicted and the measured Doppler shift is discussed, and application of the analytical solution for measurement of the mirror velocity is described.
Introduction
Fabry-Perot cavities with the length of several kilometers are utilized in laser gravitational wave detectors such as LIGO [1]. The mirrors in these Fabry-Perot cavities are suspended from wires and therefore are free to move along the direction of beam propagation. Ambient seismic motion excites the mirrors, causing them to swing like pendulums with frequencies of about one hertz and amplitudes of several microns. To maintain the cavity on resonance the Pound-Drever locking technique [2] is used. During lock acquisition the mirrors frequently pass through resonances of the cavity. As one of the mirrors approaches a resonant position the light in the cavity builds up. Immediately after the mirror passes a resonance position, a field transient in the form of damped oscillations occurs. This transient depends mostly on the cavity length, its finesse, and the relative velocity of the mirrors. Thus, careful examination of the transient reveals useful information about the cavity properties and the mirror motion.
The oscillatory transient was observed in the past in several experiments with high-finesse Fabry-Perot cavities. The oscillations were recorded in the intensity of reflected light by Robertson et al. [3]. In this experiment the oscillations were used for measurements of the storage time of a Fabry-Perot cavity and its finesse. The oscillations were also observed in the intensity of transmitted light by An et al. [4]. In this experiment the oscillations were used for measurements of the cavity finesse and the mirror velocity. The transient was also studied by Camp et al. [5] for applications to cavity lock acquisition. This time the oscillations were observed in the Pound-Drever locking signal. Recently the transient has been revisited by Lawrence et al. [6]. In this study both the cavity length scans and the frequency scans were analyzed using all three signals: the intensities of the reflected and transmitted fields as well as the Pound-Drever signal.
Although the transient has been frequently observed in experiments, its theory is far from being complete. It is known that the oscillations in the transient appear through the beatings of different field components in the cavity. However, different authors propose slightly different beat mechanisms [4, 6]. Moreover, it is not understood why the rate of the oscillations always increases in time, and what causes this chirp-like behavior.
In this paper we show that the transient can be explained by the Doppler effect which appears in a Fabry-Perot cavity with moving mirrors. Intrinsically small, the Doppler shift is amplified by the cavity and results in the modulation of the intracavity field. Based on this observation, we derive a simple formula for the transient and explain its chirp-like behavior. In this approach the frequency of the oscillations can be easily found from the cavity parameters and the mirror velocity. The predictions based on the formula and numerical simulations are compared with the measurements taken with the 40m Fabry-Perot cavity of the Caltech prototype interferometer. In both cases good agreements are found.
Currently the transient is studied in connection with locking of the kilometer-sized Fabry-Perot cavities of LIGO interferometers [7]. The analysis presented in this paper serves as a basis for calculations of the cavity parameters in these studies.
1 Reflection of Light off a Moving Mirror
To set grounds for the analysis in this paper, consider a simple process of reflection of light (electromagnetic wave) off a moving mirror. Let the mirror be moving along the -axis with an arbitrary trajectory . Assume that the light is propagating along the positive -direction and is normally incident on the mirror. The wave-front of the reflected wave observed at the location and time is reflected by the mirror at some earlier time which, according to Fig. 1, satisfies the equation:
| (1) |
This equation defines the time as an implicit function of and .

Let the electric field of the incident and reflected waves be and . Due to continuity of the waves at the mirror surface, the two fields are related according to
| (2) |
For simplicity we assumed that the mirror is perfect (100% reflective), and no phase change occurs in the reflection.
Equations (1) and (2) allow us to calculate the wave reflected by a mirror moving along an arbitrary trajectory. Let the incident wave be plane and monochromatic,
| (3) |
where is the frequency and is the wavenumber (). Then the reflected wave is given by
| (4) |
Substituting for from Eq. (1) we obtain that the electric field of the reflected wave is given by
| (5) |
The extra phase, , appears due to the continuity of the waves at the mirror surface, and leads to two closely related effects. On one hand, it gives rise to the phase shift of the reflected wave which appears because the mirror position is changing. On the other hand, it gives rise to the frequency shift of the reflected wave which appears because the mirror is moving. Indeed, the frequency of the reflected wave can be found as
| (6) |
Note that is the instantaneous mirror velocity , and
| (7) |
which can be derived from Eq. (1). Combining Eqs. (6) and (7), we obtain the formula for the frequency of the reflected wave:
| (8) |
At any given location the electric field oscillates at a very high frequency (). It is convenient to remove the high-frequency oscillating factor and consider only the slowly varying part of the wave:
| (9) |
The two amplitudes, and , which correspond to the same wave but defined at different locations, and , are related:
| (10) |
where is the distance between the two locations ().
We now obtain a formula for the reflection off the moving mirror in terms of the “slowly-varying” field amplitudes. This can be done by tracing the incident beam from the mirror surface back to the point with the coordinate :
| (11) |
where the time is further in the past and according to Fig. 1 is given by
| (12) |
Equations (11) and (12) lead to the following relation between the field amplitudes:
| (13) |
This formula is used below for calculations of fields in Fabry-Perot cavities with moving mirrors.
For non-relativistic mirror motion () the frequency of the reflected light can be approximated as
| (14) |
which differs from the exact formula, Eq. (8), only in the second order in .
2 Doppler Shift in Fabry-Perot Cavities
2.1 Critical Velocity
Fabry-Perot cavities of laser gravitational-wave detectors are very long and have mirrors that can move. The Doppler shift in such cavities can be described as follows. Let the cavity length be and the light transit time be :
| (15) |
Assume that one of the mirrors is moving with the constant velocity . Then the frequency of light reflected off the moving mirror is Doppler shifted, and the shift in one reflection is
| (16) |
Subsequent reflections make this frequency shift add, forming the progression:
| (17) |
Therefore, the Doppler shift of light in the cavity accumulates with time.
A suspended mirror in such cavities moves very little. Its largest velocity is typically of the order of a few microns per second. The corresponding Doppler shift is of the order of a few hertz, which is very small compared to the laser frequency Hz for an infra-red laser with wavelength m. However, the line-width of the long Fabry-Perot cavities of the laser gravitational wave detectors is also very small, typically of the order of 100 Hz. Therefore, the small Doppler shift, as it accumulates with time, can easily exceed the line-width.
The characteristic time for light to remain in the cavity is the storage time, which is defined as -amplitude folding time:
| (18) |
where and are the amplitude reflectivities of the cavity mirrors. Then the Doppler shift accumulated within the storage time is
| (19) |
It becomes comparable to the line-width of the cavity if the relative velocity of the mirrors is comparable to the critical velocity defined as
| (20) |
where is the finesse of the cavity:
| (21) |
Note that the mirror moving with the critical velocity passes the width of a resonance within the storage time. These qualitative arguments show that the Doppler effect becomes significant if the time for a mirror to move across the width of a resonance is comparable to or less than the storage time of the cavity.
2.2 Equation for Fields in a Fabry-Perot Cavity
The response of Fabry-Perot cavities is usually expressed in terms of amplitudes of the electro-magnetic field circulating in the cavity. The equation for the dynamics of this field can be derived as follows. Assume, for simplicity, that one of the mirrors (input mirror) is at rest and the other (end mirror) is freely swinging. Let the trajectory of this mirror be . It is convenient to separate the constant and the variable parts of the mirror trajectory:
| (22) |
In Fabry-Perot cavities of gravitational wave detectors is of the order of a few kilometers and is of the order of a few microns. Without loss of generality we can assume that the cavity length is equal to an integer number of wavelengths and therefore .

Let the amplitude of the input laser field be and the amplitudes of the fields inside the cavity be and , both defined at the reflective surface of the input mirror as shown in Fig. 2. Then the equation for reflection off the end mirror can be written as follows
| (23) |
where is the amplitude reflectivity of the end mirror. A similar equation can be written for the reflection off the front mirror:
| (24) |
where is the transmissivity of the front mirror.
Finally, the amplitudes of the transmitted and the reflected field are given by
| (25) | |||||
| (26) |
where is the transmissivity of the end mirror. Note that the reflected field is a superposition of the intracavity field leaking through the front mirror and the input laser field reflected by the front mirror, as shown in Fig. 2.
3 Transient due to Mirror Motion
The mirrors in Fabry-Perot cavities of laser gravitational wave detectors are suspended from wires and can swing like pendulums with frequencies of about 1 Hz. The amplitude of such motion is of the order of a few microns. During the swinging motion, the mirrors frequently pass through resonances of the cavity. Each passage through a resonance gives rise to the field transient in the form of damped oscillations. Such a transient can be described in terms of the complex amplitude of the cavity field as follows. For the entire time when the mirror moves through the width of a resonance (a few milliseconds), its velocity can be considered constant, and its trajectory can be approximated as linear: . Often the amplitude of the incident field is constant: . Then amplitude of the intracavity field satisfies the equation:
| (28) |
which is a special case of equation (27).
Numerical solutions of this equation can be easily obtained on the computer. Examples of the numerical solution with the parameters of LIGO 4km Fabry-Perot cavities are shown in Fig. 3.
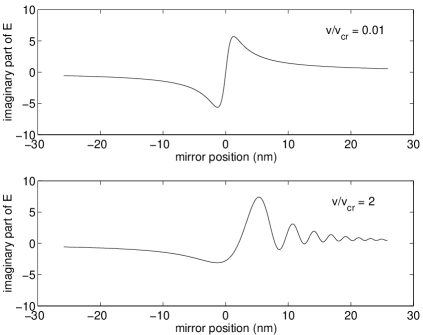
Such numerical solutions provide an accurate description for the field transient but give little insight into the physics of the process. Therefore, it is worthwhile to obtain an approximate analytical solution for this equation.
3.1 Approximate Solution for the Transient
An approximate solution can be derived as follows. A general solution of Eq. (28) can be represented as a sum:
| (29) |
Here is a particular solution of the non-homogeneous equation and is a general solution of the homogeneous equation:
| (30) | |||||
| (31) |
Both amplitudes, and , change very little during one round-trip. In the case of -field the approximation yields the solution:
| (32) |
which is generally known as the adiabatic field. (Here we also made the approximation: .) The adiabatic component was introduced empirically by Yamamoto [7].
In the case of -field the approximation yields only a trivial solution: . Fortunately, the equation for -field can be solved exactly. A trial solution for is
| (33) |
where is the value of -field at time and is an arbitrary phase. Then Eq. (31) reduces to the equation for the phase:
| (34) |
Its solution, up to an additive constant, is
| (35) |
Thus, we obtain the solution for -field:
| (36) |
where is the cavity storage time defined in Eq. (18). This expression is valid for and describes the phase modulation of the cavity field due to the Doppler effect. The constant can be found from the asymptotic behavior of the field [8] and is given by
| (37) |
Equation (36) shows that -field is oscillating with the frequency which linearly increases with time:
| (38) |
Note that the frequency of the oscillations is equal to the accumulated Doppler shift:
| (39) |
where is the frequency shift which occurs in one reflection off the moving mirror, Eq. (16).
Combining the above results we obtain the approximate formula for the transient:
| (40) | |||||
Thus the transient, which occurs during a passage of the mirror through a resonance, is caused by the Doppler effect amplified by the cavity. The frequency of oscillations linearly increases in time with the rate proportional to the mirror velocity.
Comparison of the approximate analytical solution given by Eq. (40) with the numerical simulations based on Eq. (28) shows that the two solutions agree very well in the region past the resonance (). However, the two solutions differ substantially in the region near the center of the resonance (). This is because the center of the resonance is the boundary of the validity of the approximate analytical solution.
The above analysis leads to the following explanation of the oscillatory transient. As the mirror approaches the resonance position (), the light is rapidly building in the cavity. At the time when the mirror passes the center of the resonance, a substantial amount of light accumulates in the cavity. From this moment on, the light stored in the cavity (-component) decays according to the exponential law, and its frequency is continuously shifting due to the Doppler effect. At the same time there is a constant influx of the new light from the laser (-component). The new light is not affected by the Doppler shift and therefore evolves according to the usual adiabatic law.
3.2 Observation of the Transient via Beats
The small frequency shifts of the light circulating in the cavity are usually observed through beats. There are several beat mechanisms which take place in Fabry-Perot cavities with moving mirrors. Here we describe the three most frequently occurred beat mechanisms in detail.
The Doppler-induced oscillations of the intracavity field can be observed in the intensity of the transmitted field. The above analysis shows that the Doppler effect gives rise to phase modulation of -field. As a result, the cavity field , which is the sum of and fields, becomes amplitude modulated. This amplitude modulation can be observed as the intensity modulation of the field transmitted through the cavity. According to Eqs. (25) and (29) the intensity of the transmitted field is proportional to
| (41) | |||||
where an asterisk stands for complex conjugation. Note that neither nor are oscillating functions. Therefore, the oscillations come from the last term, which represents a beating between and -components of the intracavity field.
Similarly, the oscillations of the intracavity field can be observed in the intensity of the reflected field. According to Eqs. (23) and (26) the amplitude of the reflected field can be found as
| (42) |
For high-finesse cavities () with low losses () the complex amplitude of the reflected field can be approximated as
| (43) |
Then the intensity of the reflected light is given by
| (44) | |||||
The second term in the right hand side of this equation represents the amplitude modulation of the intracavity field as described in Eq. (41). The last term represents a beating of the intracavity field transmitted through the front mirror and the input laser field promptly reflected by the front mirror. Both terms give rise to the oscillations in the intensity of the reflected field. Therefore the decay of the reflected intensity is described by the double exponential function with two decay times, and , as was noticed by Robertson et al. [3].
The oscillations can also be observed in the Pound-Drever signal, which requires optical sidebands be imposed on the light incident on the cavity. In this case the signal is obtained from beating of the carrier reflected field with the sideband reflected fields. Since the carrier field propagates in the cavity, it becomes Doppler-shifted due to the motion of the cavity mirrors. The sideband fields are promptly reflected by the front mirror of the cavity. Therefore their amplitudes are proportional to the amplitude of the incident carrier field. Then the signal can be approximated by the formula:
| (45) |
where is the phase of a local oscillator in the optical heterodyne detection.
If the amplitude of the input laser field is constant () then the Pound-Drever signal becomes a linear function of the cavity field:
| (46) | |||||
| (47) |
Since -component is a monotonic function, the oscillations come from -component only. Unlike the signals derived from the intensity of the transmitted or reflected fields, the Pound-Drever signal is linearly proportional to the amplitude of the intracavity field and therefore presents a direct way to observe the oscillations.
4 Experimental Analysis of the Transient
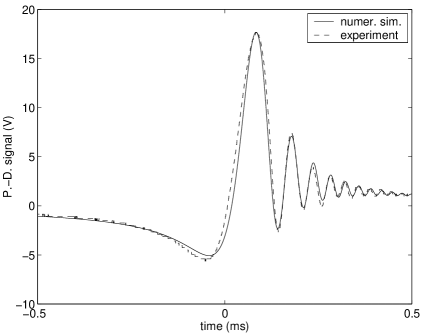
The measurements of the oscillatory transient analyzed in this paper were taken with the 40m Fabry-Perot cavity of the LIGO-prototype interferometer at Caltech. The experimental setup was previously described by Camp et al. [5]. Figure 4 shows the Pound-Drever signal of the 40m Fabry-Perot cavity recorded with a digital oscilloscope (dashed line). The theoretical prediction shown in the same Figure (solid line) is obtained by numerical simulations of the intracavity field using Eq. (28). After adjustment of the demodulation phase ( rad) a good agreement between the theoretical and the experimental curves was achieved. It is important to note that the mirror velocity ( m/s) used for the numerical simulations was not a fit parameter. It was obtained from the interpolation of the mirror trajectory using the optical vernier technique [9].
The formula for the transient, Eq. (40), can be used for extracting the cavity parameters from the Pound-Drever signal. In such an analysis it is convenient to remove the adiabatic component from the Pound-Drever signal. The result is the function very similar to , which is given by
| (48) | |||||
Here we introduced , the time when the mirror passes a center of the resonance, and . The measured Pound-Drever signal (with the adiabatic component removed) and the theoretical prediction based on this formula are shown in Fig. 5 (upper plot).
4.1 Measurement of the Cavity Finesse
The oscillatory transient can be used for measurements of the cavity finesse. The present approach is based on the exponential decay of the Pound-Drever signal. The finesse can be found by studying the absolute value of the adjusted Pound-Drever signal:
| (49) |
Indeed, by fitting the exponential function to the envelope of the oscillations , one can find the storage time of the cavity, , and therefore its finesse:
| (50) |
Applied to the data shown in Fig. 4, this method yields the following value for the finesse of the Caltech 40m Fabry-Perot cavity:
| (51) |
This result is close to the one previously obtained from the measurement of the mirror reflectivities (). The present approach to measure the cavity storage time is similar to the one described by Robertson et al [3].
4.2 Measurement of the Mirror Velocity
The oscillatory transient can also be used for measurements of the mirror velocity. The present approach is based on the linear shift of the frequency of the Pound-Drever signal. The velocity can be found by studying either the peaks or the zero crossing of the adjusted Pound-Drever signal, .
Let the times for the zero crossings be , where is integer. The values for are defined by the functional form of the adjusted Pound-Drever signal, Eq. (48), and are given by
| (52) |
This relation depends on the demodulation phase , which is not always known in the experiment. However, the difference:
| (53) |
does not depend on the demodulation phase and therefore is more suitable for this analysis. Define the spacings between the zero crossings, , and the positions of their midpoints, , as follows:
| (54) | |||||
| (55) |
Then the “average” frequency of the oscillations of , can be defined as
| (56) |
Using the identity, Eq. (53), we can show that the average frequencies satisfy the equation:
| (57) |
This equation is a discrete analog of the continuous evolution, Eq. (38).
If the times correspond to the peaks and not the zero crossings of the signal, the predicted average frequency becomes
| (58) |
where is a small correction which accounts for the exponential decay of the signal present in Eq. (48). The correction can be found from Eq. (48) using a perturbation expansion in powers of . In the lowest order, it is given by
| (59) |
Such a correction becomes significant only if the oscillations are close to being critically damped.
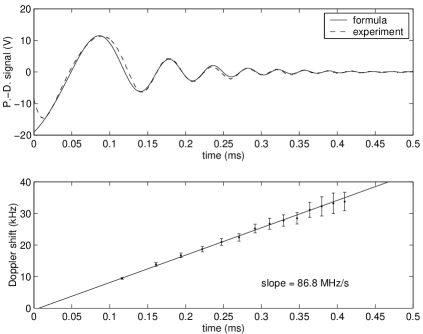
In general the zero crossings can be affected by the subtraction of the adiabatic component. Therefore, we prefer to use the peaks of the signal. The peak-positions are found from the measured Pound-Drever signal, which is shown in Fig. 5 (upper plot). Since the oscillations are far from being critically damped,the correction can be neglected. In this experiment, the first order correction is much less than the error in determination of the average frequencies. As a result the measured values of the average frequencies appear very close to the linear function, Eq. (57). This can also be seen in Fig. 5 (lower plot). Therefore, we can apply a linear fit to the data:
| (60) |
where and are the slope and the intercept of the linear function. The least square adjustment of the fit gives the following values for these parameters:
| (61) | |||||
| (62) |
The slope is related to the mirror velocity, and the intercept is related to the time when mirror passes through the center of the resonance:
| (63) | |||||
| (64) |
From these relations we obtain
| (65) | |||||
| (66) |
The errors are due to uncertainty in the peak positions, which are limited in this measurement by the resolution of the oscilloscope.
Conclusion
The Doppler effect in Fabry-Perot cavities with suspended mirrors can be significant and manifests itself in the oscillations of the field transient, which can be directly observed via the Pound-Drever signal. The transient can be used for accurate measurements of the cavity finesse and the mirror velocities. Implemented in real-time computer simulations the formula for the transient can be used in lock acquisition algorithms.
The analysis presented in this paper explains the chirp-like behavior of the transient and leads to a simple formula for its frequency. However, the approximate analytical solution given in this paper describes only the ringdown part of the transient. The buildup part is yet to be explained. Also it is not clear at the present time why oscillations always appear after the mirror passes the center of the resonance and not before.
Acknowledgment
I thank Guoan Hu for assistance with the experiment, and Hiro Yamamoto and Matt Evans for helpful discussions. I also thank Barry Barish and other scientists of LIGO project: Rick Savage, David Shoemaker and Stan Whitcomb for their suggestions about the manuscript during the draft process. Finally, I thank David Reitze and David Tanner of the University of Florida for the discussions of the transient and their comments on the paper. This research was supported by the National Science Foundation under Cooperative Agreement PHY-9210038.
References
- [1] A. Abramovici, W.E. Althouse, R.W. Drever, Y. Gürsel, S. Kawamura, F.J. Raab, D. Shoemaker, L. Sievers, R.E. Spero, K.S. Thorne, R.E. Vogt, R. Weiss, S.E. Whitcomb, and M.E. Zucker, “LIGO: The Laser Interferometer Gravitational-wave Observatory,” Science 256, 325-333 (1992).
- [2] R.W.P. Drever, J.L. Hall, F.V. Kowalski, J. Hough, G.M. Ford, A.J. Munley, and H. Ward, “Laser Phase and Frequency Stabilization Using an Optical Resonator,” Appl. Phys. B 31, 97-105 (1983).
- [3] N.A. Robertson, K.A. Strain, and J. Hough, “Measurements of losses in high reflectance mirrors coated for nm,” Opt. Comm. 69, 345-348 (1989).
- [4] K. An, C. Yang, R.R. Dasari, and M.S. Feld, “Cavity ring-down technique and its application to the measurement of ultraslow velocities,” Opt. Lett. 20, 1068-1070 (1995).
- [5] J. Camp, L. Sievers, R. Bork, and J. Heefner, “Guided lock acquisition in a suspended Fabry-Perot cavity,” Opt. Lett. 20, 2463-2465 (1995).
- [6] M.J. Lawrence, B. Willke, M.E. Husman, E.K. Gustafson, and R.L. Byer, “Dynamic response of a Fabry-Perot interferometer,” J. Opt. Soc. Am. B 16, 523-532 (1999).
- [7] H. Yamamoto, “Fringe structure of LIGO Hanford 2km Fabry-Perot cavity,” LIGO technical report G990130, California Institute of Technology, (1999).
- [8] M. Rakhmanov, “Dynamics of Laser Interferometric Gravitational Wave Detectors,” Ph.D. Thesis, California Institute of Technology (2000).
- [9] M. Rakhmanov, M. Evans, and H. Yamamoto, “An optical vernier technique for in situ measurement of the length of long Fabry-Perot cavities,” Meas. Sci. Tech. 10, 190-194 (1999).