Simulation of Beam-Beam Effects in Storage Rings ††thanks: Work supported by the Department of Energy under Contract No. DE-AC03-76SF00515
Abstract
The beam-beam effects of the PEP-II as an asymmetric collider are studied with strong-strong simulations using a newly developed particle-in-cell (PIC) code[1]. The simulated luminosity agrees with the measured one within 10% in a large range of the beam currents. The spectra of coherent dipole oscillation are simulated with and without the transparency symmetry. The simulated tune shift of the coherent mode agrees with the linearized Vlasov theory even at large beam-beam parameters. The Poicare map of coherent dipole is used to identify the beam-beam resonances.
1 INTRODUCTION
The PEP-II [2] and KEKB [3] as asymmetric collider, which consists of two different rings at different energy, have been successfully constructed and fully operational. The beam-beam effects in this new type of collider is one of the important physical phenomena to be studied because, with twice of more parameters, there are much more choices of operating parameters to gain a higher luminosity. Basically, there are two major choices for the operating parameters. One choice is the symmetric parameters of lattice and beam, such as equal beta functions and betatron tunes and beam sizes, in additional to maintaining the energy transparency condition: [4]. The other one is to break some unnecessary symmetry, for example, betatron tunes. To make right choice, it is important to understand what are the consequences when symmetry is broken. For example, it is known that the violation of the energy transparency condition might cause a flip-flop of the colliding beams [5]. The main subject of this paper is to study the symmetry using the PEP-II as an example.
First we simulate the beam-beam limit and the spectrum of coherent oscillation when the transparency conditions are preserved. Then we will study the spectrum and motion of the coherent oscillation when the transparency conditions are largely violated. Finally we will make comparison of the luminosity between the simulation and measurement.
2 Symmetric Parameters
Particle simulation is one of the important tools to study many aspects of the beam-beam interaction such as the beam-beam limit and the luminosity of colliders. Extending the work [6, 7] of solving the Poisson equation, we reduce the region of mesh by assigning inhomogeneous potential on the boundary [1]. The method allows us to choose much smaller region of mesh and therefore increase the resolution of the solver. The improved resolution makes more accurate the calculation of the dynamics in the core of the beams.
In a typical simulation, we track 10240 macro particles inside an area of with a rectangular mesh of . For a beam aspect ratio of , we choose fifteen grids per and five grids per . This choice of simulation parameters makes about ten particles per cell on average within a region of where the most of beam reside. It is adequate to compute the quantities that are mostly determined by the core of the beam.
The particles lost outside the meshed region are kept where they are lost and their contribution to the force is ignored afterward. The loss of the particles is closely monitored under different conditions since too much loss means that the simulated result is not reliable anymore. For a mesh size of , the loss of the particles is less than 1% even at extremely high beam intensity.
Due to the limitation of the computational speed on a computer workstation, only a single two-dimensional slice is used to represent a bunched beam. Therefore, all longitudinal effects such as the hourglass effect and synch-betatron coupling are neglected in the simulations.
At each beam intensity, we track the particles up to three damping time till the beams reach their equilibrium distributions. Then the equilibrium distributions are used to compute the quantities like the beam-beam parameters. For extracting the power spectrum, we track additional 2048 turns after the equilibrium and save the beam centroid every turn.
2.1 Parameters
The PEP-II is an asymmetric collider with two different storage rings in a 2.2 kilometer tunnel at the Stanford Linear Accelerator Center. The positron beam is stored in the Low Energy Ring (LER); the electron beam in the High Energy Ring (HER). The two rings are vertically separated and brought into the collision at an interaction point (IP). In Tab. 1, we list a possible set of symmetric parameters for the PEP-II.
| Parameter | Description | LER(e+) | HER(e-) |
|---|---|---|---|
| (Gev) | beam energy | 3.1 | 9.0 |
| (cm) | beta X at the IP | 50.0 | 50.0 |
| (cm) | beta Y at the IP | 1.5 | 1.5 |
| (turn) | damping time | 5014 | 5014 |
| (nm-rad) | emittance x | 48.0 | 48.0 |
| (nm-rad) | emittance y | 1.50 | 1.50 |
| x tune | 0.390 | 0.390 | |
| y tune | 0.370 | 0.370 |
Table 1: Symmetric parameters for the PEP-II
It has been shown [4] that even for an asymmetric collider, it still can be operated theoretically as if it is a symmetrical collider if the transparency conditions: , are all satisfied as far as the beam-beam interaction is the concern.
To preserve the energy transparency condition in the simulation, we vary the beam intensity with a step of and starting from zero.
2.2 Beam-Beam Parameters
Given equilibrium distributions that are close enough to the Gaussian, we introduce the beam-beam parameters
| (1) |
where is the classical electron radius, is the energy of the beam in unit of the rest energy, and is total number of the charge in the bunch. Here the superscript “” denotes quantities corresponding to the positron beam and “” quantities corresponding to the electron beam.
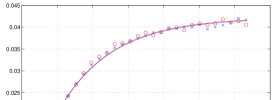
At every the intensity of beams, we computed the beam sizes and the beam-beam parameters of the equilibrium beam distribution. The result is summarized in Fig. 1. Clearly, the beam-beam parameter in the vertical plane is saturated at high beam intensity. That is consistent with many experimental observations [8]. Moreover, the dependence of the beam-beam parameter upon the single bunch current can be fitted rather well with two parameters,
| (2) |
where is the beam-beam limit and is the decay rate with respect to the beam current . For this particular case, . At mA, which is the nominal value of the design single bunch current, . That is about 15% less than the design value of the beam-beam parameter. At mA, which is the single bunch current at the top of each filling last October, , which is less than . That indicates that there is still room to improve if the symmetric parameters could be implemented in the machines of the PEP-II.
At a few other tunes that we have studied, for example and , we found the similar phenomenon. The same is true in the horizontal plane. It is intriguing that such simple parameterization can be applied to the beam-beam parameter.
2.3 Spectrum
Using the fast Fourier transformation (FFT), we computed the power spectrum with the beam centroids which were recorded in 2048 consecutive turns after the equilibrium distributions were established. The several spectra with at different beam intensities are shown in Fig. 2. There are two peaks clear seen in each spectrum. They are and modes of the coherent dipole oscillations. The tune shift of the mode increases with respect to the beam intensity.
However, the tune shift of the mode also increases though less than the mode as the intensity increases. This phenomenon is beyond the capability of the linearized Vlasov theory since it predicts no tune shift for the mode.
2.4 The Yokoya Factor
Studying the power spectrum of colliding beams is a powerful way to investigate and understand the beam-beam interaction. Historically, in symmetric colliders where two beams are identical, the tune shift of the coherent mode has provided many useful insights into the dynamics of the beam-beam interaction. It has been shown analytically that this tune shift is proportional to the beam-beam parameter , namely [9, 10, 11, 12]. The coefficient is between 1 and 2 depending on the beam distribution. For a self-consistent beam distribution [12],
| (3) |
where , , and and are the horizontal and vertical beam size respectively.
Experimentally, this relation has been observed in many different colliders [13, 14]. The results of measurements are consistent with the calculation based on the Vlasov theory. In simulations[15, 16] using the PIC this relation was also confirmed. Now, this well-established relation is often used to measure the beam-beam parameter or test a newly developed code.
The shifts of the mode away from the machine tune are extracted from the spectra as shown Fig. 2 at different beam intensities. The shifts as a function of the beam-beam parameter, which is shown in Fig. 1, are summarized in Fig. 3.

The predicted linear relation based on Eqn. 3 is also plotted in the figure. One can see that the agreement between the theory and simulation is rather good even at very high beam-beam parameter.
3 Asymmetric Parameters
In October 2000, PEP-II has achieved its design luminosity of . The parameters of the lattices and beams when the design luminosity was reached are tabulated in Tab. 2. It is clear that many transparency conditions are violated. Among them, the betatron tunes are very different and well separated compared to the beam-beam parameter.
| Parameter | Description | LER(e+) | HER(e-) |
|---|---|---|---|
| (Gev) | beam energy | 3.1 | 9.0 |
| (cm) | beta x at the IP | 50.0 | 50.0 |
| (cm) | beta y at the IP | 1.25 | 1.25 |
| (turn) | damping time | 9740 | 5014 |
| (nm-rad) | emittance X | 24.0 | 48.0 |
| (nm-rad) | emittance Y | 1.50 | 1.50 |
| (cm) | bunch length | 1.30 | 1.30 |
| x tune | 0.649 | 0.569 | |
| y tune | 0.564 | 0.639 | |
| z tune | 0.025 | 0.044 |
Table 2: Operating parameters for PEP-II
During the last run, the ratio of the beam current is about 2:1. As a result, the energy transparency condition is also violated. With this set of parameters, the PEP-II has been operated at a region of asymmetry.
To simulate the beam-beam effects under the nominal running condition of the PEP-II, we vary the beam intensity with a step of and . Since the LER has longer damping time than the one in HER, we track the particles with three damping time of the LER to ensure that both beams reach their equilibrium distributions.
3.1 Dipole Motion
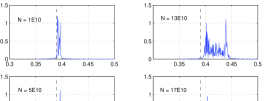
The Poincare maps of self-excited coherent dipole in the plane with four different beam intensities: (from left to right) are shown in Fig. 4.

It is clear that there is maximum amplitude of the oscillation. The amplitudes are very small and within when the beam intensities stay bellow the peak operating intensity .
In Fig. 4, some structures of the resonance can be clearly seen. For instance, at , we see seven islands in the Poincare map for the electron beams. This seventh order resonance can be identified as . For the positron beam, we see a triangle shape which is consistent with the third order resonance at .
It is worthwhile to note that the resonance structure displayed in the figure is near , which is a factor of two smaller than the size of the grid (/15). This does not necessarily mean that the resolution of resolving the dynamics of individual particle is less than the size of the grid. But for the collective motion, such as the oscillation of the coherent dipole, the resolution can be smaller than the size of the grid. Because they are an average over the distribution of the particles, the noises from the finite size of the mesh and the representation of beam distribution as a finite number of particles are much reduced.
Below the peak operating intensity, the amplitude of the vertical oscillation is about . But no higher order resonances are identifiable. One of possible reasons is that the vertical grid size is too large to resolve the structure of resonance within .
Above the peak operating intensity, the amplitude of the vertical oscillation increases more than ten times and reaches half of the beam size for the electron beam. The oscillation acts coherently as a single particle. It is not clear why the dipole mode of the electron beam is excited to such large amplitude at the higher intensity.
3.2 Spectrum
In the vertical plane, the dipole mode at different beam intensities are plotted in Fig. 5. Unlike the symmetric colliding beams, there are no visible modes in the spectra. An asymmetric shape of the spectrum is clear visible especially at the high intensity. Similar spectrum has been observed experimentally [17].
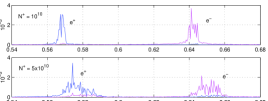
At , a single mode is coherently excited in the electron beam. Correspondingly, the excited mode is shown as an ellipse in the Poincare map. And the positron beam is blowup vertically at the same time. As a result, the luminosity decreases. In order to check if this highly excited mode is the cause of the rapid increase in the vertical size of the positron beam, we eliminate the dipole oscillation every turn in simulation. But the peak luminosity remains the same. So we conclude, in this case, that the collective dipole motion is not the main reason for the beam-beam blowup.
In the horizontal plane, the spectra are broader than the vertical ones largely because the resonances, which we have shown in the previous section. The spectra are not so asymmetric as the vertical ones.
3.3 Tune Shift
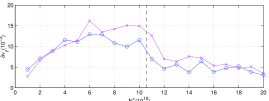
Similar to the symmetric case, the spectrum shifts as the intensity increases. The tune shifts as a function of the beam intensities is shown in Fig. 6. The center of the spectrum is the fitted result of the Lorentz spectrum. In general, the center does not coincide with the peak in the spectrum due to the asymmetric nature of the spectrum. Therefore, the tune shifts as plotted in the figure should be considered as the average values. The tune shifts saturate around 0.015 in the both planes. In particular, the vertical shifts actually start to decrease near the peak operating intensity. Similar behavior had been observed in the measurements of the power spectrum for the PEP-II. This behavior is certainly very different with the behavior of the beam-beam parameters as simulated [1]. For the PEP-II, which is operated at very asymmetric parameters, we do not have a simple linear relation between the beam-beam parameter and the tune shift of the dipole spectrum.
3.4 Luminosity
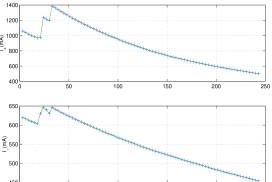
To make a direct comparison between simulation and experimental observation, we have recorded the luminosity during a period of four hours on October 1, 2000. The data are shown in Fig. 7. Duration of each measurement was three minutes. The first and second plots in the figure present the total decaying beam current of positron and electron beams respectively. The third plot shows the measured and simulated luminosities at the same beam current displayed in the figure. The other parameters used in the simulation are the same as in Tab. 2.
The agreement of the simulation and measurement was within 10. Since the longitudinal effects of the beam-beam interaction are not yet included in the simulations, three-dimensional simulation could reduce the simulated luminosity. For example, the hourglass effect should reduce the simulated luminosity by 12 given cm and cm.
4 Conclusion
When the transparency conditions are violated, especially the betatron tunes are well separated, the strong-strong simulations show the spectra of coherent oscillation in the beam-beam interaction is very different from the spectra seen in the symmetric collider. In particular, there is no mode seen in the spectrum. The simple linear relation between the beam-beam parameter and the tune shift of the mode is no longer existing. Given the operating parameters of the PEP-II, we do not see any simple relation between the tune shift of the continuum spectrum and the beam-beam parameter. Therefore, the beam-beam parameter would not be estimated using the spectrum.
The agreement of luminosity between the simulation and measurement is surprising and remarkable considering the simplicity of the two-dimensional model. In general, the three-dimensional effects such as the hourglass effects and the synch-betatron resonance could become very important. The code is being extended to include the bunch length and synchrotron oscillation. More simulation results will be directly compared to the controlled experiment.
5 ACKNOWLEDGMENTS
I would like to thank A. Chao, S. Tzenov, and T. Tajima for the collaboration. I would also like to thank S. Heifets, W. Kozanecki, M. Minty, I. Reichel, J. Seeman, R. Warnock, U. Wienands, and Y. Yan for many helpful discussions.
References
- [1] Y. Cai, A. W. Chao, S. I. Tzenov, and T. Tajima, “Simulation of the Beam-Beam Effects in Storage Rings with a Method of Reduced Region of Mesh,” Phys. Rev. ST Accel. Beams 4, 011001 (2001).
- [2] “PEP-II: An Asymmetric B Factory”, Conceptual Design Report, SLAC-418, June 1993.
- [3] KEK B-Factory Design Report No. KEK 95-7, 1995.
- [4] S. Krishnagopal and R. Siemann, “Beam-Energy Inequality in the Beam-Beam Interaction,” Phys. Rev. D 41, 1741 (1990).
- [5] S. Krishnagopal, “Energy Transparency and Symmetries in the Beam-Beam Interaction,” Phys. Rev. ST Accel. Beams 3, 024401 (2000).
- [6] S. Krishnagopal and R. Siemann, “Coherent Beam-Beam Interactions in Electron-Positron Colliders,” Phys. Rev. Lett., 67, 2461(1991).
- [7] S. Krishnagopal, “Luminosity-Limiting Coherent Phenomena in Electron-Positron Colliders,” Phys. Rev. Lett., 76, 235(1996).
- [8] J. T. Seeman, “Observations of the Beam-Beam Interaction,” Nonlinear Dynamics Aspects of Particle Accelerators, Springer-Verlag, Berlin, edited by J.M Jowett, M. Month and S. Turner, 121 (1986).
- [9] A. Piwinski, “Observation of Beam-Beam Effects in PETRA,” IEEE Trans. NS-26, 4268 (1979).
- [10] K. Hirata, “Coherent Betatron Oscillation Modes Due to Beam-Beam Interaction,” Nucl. Instr. Meth. A269, 7 (1988).
- [11] R. E. Meller and R. H. Siemann, “Coherent Normal Modes of Colliding Beams,” IEEE Trans. NS-28, 2431 (1981).
- [12] K. Yokoya and H. Koiso, “Tune Shift of Coherent Beam-Beam Oscillation,” Particle Accelerators, 27, 181 (1990).
- [13] T. Ieiri, T. Kawamoto, and K. Hirata, “Measurement of the Beam-Beam Parameter by Exciting Coherent Betatron Oscillation,” Nucl. Instr. Meth. A265 364 (1988).
- [14] H. Koiso, et al, “Measurement of the Coherent Beam-Beam Tune Shift in the TRISTAN Accumulation Ring,” Particle Accelerator, 27, 83 (1990).
- [15] E. B. Anderson, T.I Banks, J.T. Rogers, “ODYSSEUS: Description of Results from a Strong-Strong Beam-Beam Simulation For Storage Rings,” Proceedings of Particle Accelerator Conference, New York, 1999.
- [16] K. Ohmi, “Simulation of Beam-Beam Effects in a Circular Collider,” Phys. Rev. E 62, 7287 (2000).
- [17] S. Heifets and H. U. Wienands, “On the Shape fo the Betatron Side-Band,”Proceedings of the Seventh European Particle Accelerator Conference, Vienna, Austria, June 2000.