Measurement of the resonant molecular formation rate in solid HD
Abstract
Measurements of muon catalyzed fusion () in solid HD have been performed. The theory describing the energy dependent resonant molecular formation rate for the reaction is compared to experimental results in a pure solid HD target. Constraints on the rates are inferred through the use of a Monte Carlo model developed specifically for the experiment. From the time-of-flight analysis of fusion events in 16 and 37 gcm-2 targets, an average formation rate consistent with 0.897 times the theoretical prediction was obtained.
pacs:
36.10.Dr, 21.45.+v, 25.60.PjThe idea of introducing a negative muon into a mixture of hydrogen isotopes to catalyze fusion has been known for over 50 years [3]. The muon will be quickly captured by an atom, replacing the orbital electron. This muonic atom can then interact with an isotopic hydrogen molecule to form a muonic molecular ion. The negative muon is about 207 times the mass of an electron, thus the two nuclei in the molecule are bound together very tightly. The negative muon shields the repulsive Coulomb force between the two nuclei and because of their close proximity, fusion occurs and the muon can take part in another fusion cycle. The rate-limiting step in this process is muonic molecular (or molecular ion) formation. However, the probability of the muon sticking to the alpha particle after fusion occurs limits the average number of fusions to approximately 200 per muon.
The theory describing the energy dependent resonant molecular formation rate for the reaction has been developed in the last decade. The high rate is expected [4] to enhance muon catalyzed fusion in triple mixtures of H/D/T. In this letter we report the results of a muon catalyzed fusion experiment which confirm this rate. We have performed the first measurement using atoms incident on pure solid HD, measuring energy via a time of flight technique. By using a Monte Carlo simulation (which employs the theoretical energy-dependent rates) we have compared the experimental results to the theory, thus determining the resonant molecular formation rate consistent with the fusion time spectra for two different HD target thicknesses.
Figure 1 shows the theoretically predicted resonant molecular formation rate as a function of lab energy. This calculation, normalized to liquid hydrogen atomic density (LHD), was performed for isolated HD molecules at a temperature of 3K as had been done at higher temperatures [5]. The rate for HD is then predicted by multiplying by the fractional deuteron concentration, =0.5. The excess collisional energy of the system along with the released binding energy of the molecular ion is absorbed by excitation of the entire six-body complex . Because the ion exists in a weakly bound state, resonance formation is possible without dissociation.
The experiment described here has the advantage of using spatially separated layers of different isotopic composition in which interactions of the muonic system can be separated, providing the opportunity to measure the rate and energy dependence of resonant molecular formation using time of flight. It is similar to our previous reported measurement [6] using D2 molecules. Other experimental efforts in liquid/gaseous triple mixtures attempt to measure this rate, however interpretation is difficult because of the complex kinetics involved [5,6]. In the present experiment, solid layers were made by freezing hydrogen isotopic gases and mixtures onto two 51 m thick gold target foils maintained at 3K. The gas mixtures were deposited onto the foils through a gas diffuser [7,8], where they could remain frozen for up to one week. For the HD target layer, commercial 96% HD gas was passed through a molecular sieve placed in a liquid nitrogen bath to remove nonhydrogen impurities, and was subsequently monitored during target deposition with a quadrupole mass spectrometer to confirm nonequilibration of the gas. It has been shown that at cryogenic temperatures the molecules do not begin to equilibrate for roughly 200 hours [11]. A nonhydrogen contamination following target deposition was determined to be less than 0.1% through use of a germanium detector which measured x-rays from muon transfer to high-Z nuclei as well as gamma rays from nuclear capture.
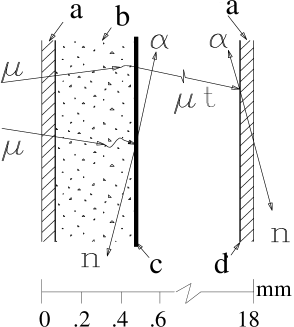
Figure 2 depicts the target and the muonic interactions which occur. Negative muons having a momentum near 27 MeV/c travel through one of the gold foils (a) into the 3.5 mgcm-2 production layer (b) which consists of protium (1H2) containing 0.1% tritium (T2). Here the muon is atomically captured by a proton within a time of s (at LHD) and subsequently transfers to a triton due to the increased binding energy of . The neutral atoms, created with tens of eV energy, escape the production layer before thermalization due to the Ramsauer-Townsend mechanism which reduces their scattering cross section on H2. The moderation layer (c), consisting of 70 gcm-2 D2, reduces the energy of the atoms to optimize resonant molecular formation on the downstream HD target (d) of thickness 16 gcm-2. The atoms traverse 17.9 0.1 mm in vacuum to reach (d). For those at or near the resonant energy, molecular formation and fusion follow with high probability, producing a 3.5 MeV alpha particle and a 14 MeV neutron. The atoms which do not escape the moderation layer (c) can interact there with deuterium, and subsequent fusion can occur [6].
Alpha particles from fusion in (c) and (d) are separated by time of flight. The muonic atom emission time from the production layer, dominated by muon transfer from proton to triton, is of order 0.1 s. Resonant formation rates are of order 109 s-1, while fusion occurs in the molecular ion at a rate of 1012 s-1. Since the two gold foils are separated by 17.9 mm, a atom which travels through the moderator layer reaches the downstream HD layer in a minimum time of 0.2 s, and more typically 2 s at 1 eV. Thus, the time interval between detection of a muon entering the target and an alpha from fusion in the downstream HD reaction layer is dominated by the flight time of the atom. Two planar silicon detectors located perpendicular to the target foils, each with active area 2000 mm2 and nominal depletion depth 300 m, detect alpha particles. A time cut of 1.5 to 6.0 s, selects fusion events occurring in the HD layer only. The summed energy spectrum from both silicon detectors, normalized to the number of good incident muons (see [6] for details), is shown in Fig. 3. Background was removed by subtracting normalized data for which no downstream reaction layer was present.
A Monte Carlo (MC) program was used to compare theoretical resonant molecular formation rates to data. This was necessary as the time-of-flight spectra cannot be uniquely inverted due to geometrical effects and the energy loss of atoms in the HD reaction layer prior to molecular formation. The MC code [12] simulates muonic processes occurring in the experiment (e.g., scattering, muon transfer, muonic molecular formation, fusion), taking into account the dimensions and geometry of the apparatus. In particular, it uses the rate of Fig. 1, scaled by =0.5, to describe resonant formation in HD. The majority of cross sections and rates used in the code were taken from [13] and [14]. However, experimentally measured rates for muon transfer () and nonresonant molecular formation [15] were used (see also [10]). Values for the cross section equal to 0.9 times those of [13] were found to better represent the fusion time distribution observed in the moderation layer [16], and thus were used in the simulation. These define our nominal MC input; the code has been validated through comparison with independently written simulation code for simplified cases for which a direct comparison can be made [17].
To compare directly the time-of-flight fusion results to the simulation, the simulations were scaled by the silicon detector solid angle, and normalized to the fraction of incoming muons which stopped in the production layer, % [16].
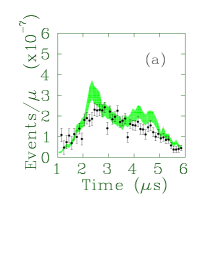
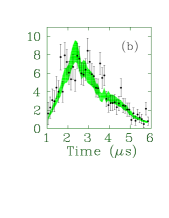
The fusion time-of-flight data for two HD targets are shown in Fig. 4. Both the simulation and data are plotted as fusion events per incident muon . Figure 4 (a) shows the results for the 16 gcm-2 HD target. The simulation shows a clear two-peaked structure not evident in the data. One peak between 2 and 3 s corresponds to the molecular formation resonances which occur above 1.0 eV, while the other, between 4 and 5 s, corresponds to the stronger resonances near 0.3 eV. Data from the 37 gcm-2 HD reaction layer are shown in Fig. 4 (b). Here, the atoms will undergo more scattering reactions before molecular formation occurs and hence are less sensitive to the molecular formation resonances. This is clearly visible in the simulation results, where the two-peaked structure is less evident. The agreement between simulation and data for this target thickness is quite reasonable (see below). Good agreement was obtained also for the case of a D2 target layer, as reported previously [6].
To test sensitivity of our data to resonant molecular formation rates, several modifications to the nominal MC input were made. Differences from the nominal input (a) include the following: determining the effect of a decreased scattering cross section (b); shifting the positions of the resonances to higher (c) and lower (d) energies; using an energy independent constant rate to model molecular formation (e); and broadening the molecular formation resonances (f). Table I summarizes the target thickness, input changes to the MC, the fit ratio which is the factor by which the data must be scaled to provide the best fit to the simulation, and the per degree of freedom (dof=49) for the scaled fit. To provide a check of how well the simulation is reproducing the absolute intensity observed, the /dof of fits are listed for being held fixed at 1.
To investigate sensitivity to the positions of the molecular formation resonances, they were shifted in the simulation by 0.18 eV (the average standard deviation of the peaks) to higher and lower energies. The peaks appearing in the simulated fusion time distribution shifted as expected due to the inverse relationship between the time of flight and speed of the atom. The results given in Table I show increases in /dof for both the shape and intensity tests when compared to the simulation results using the nominal predicted positions of the resonances. The results are indeed sensitive to the position of the resonances, but shifting them does not improve agreement between simulation and data.
A simulation using a constant molecular formation rate of , chosen to approximately match the intensity of the data, was also compared to data. The /dof for the fit to the 16 cm-2 data is 2.99 compared to 1.87 using the nominal MC input.
To determine whether the discrepancy in shape could be explained by resonance broadening, the theoretical resonances were convoluted with a Gaussian of 50 meV rms, while preserving the area under each resonance. This MC time distribution for the 37 gcm-2 data did not reproduce the data as well as the nominal simulation. For the 16 gcm-2 data, the two-peaked structure remained in the MC, with the distribution of both peaks quite broad and a factor of 1.6 higher in yield than the data for the time range between 3.0 and 6.0 .
To determine the best value for the number () by which the resonant molecular formation rate should be scaled to agree with the data, simulations were done for between 0.50 and 1.40 ( corresponds to agreement with theory) and the results were then fit to the data. The values of these fits versus allow estimation of the scaling factors for the 16 and 37 gcm-2 targets of, respectively, 0.798 0.060 and 1.040 0.072, which are not in agreement within their quoted statistical errors. As the significant known systematic errors in the experiment (such as solid angle and stopping fraction) are common to both the 16 and 37 gcm-2 targets, they cannot be used to reconcile the scaling factors, pointing to an unknown systematic error or inadequacy of the simulation for which an additional systematic uncertainty of unknown origin must be determined. Using the method described in [18], where the assessed uncertainty is increased to reflect possible unknown sources of error, an uncorrelated systematic uncertainty of 2.38 times the statistical uncertainty is added in quadrature with the correlated systematic uncertainty. The average scaling factor for both targets is then found to be 0.897 .
The scaling factors for the resonant molecular formation rates for the targets studied are given in Table II. The experimental results confirm the high HD resonant rates expected at these energies. However, the fusion time spectra structure is not confirmed, in contrast to the results for D2 [6]. The two-peaked structure predicted by the Monte Carlo results for the thin HD target is not apparent in the data. Several adaptations to the resonant molecular formation theory were investigated, but this peaked structure persists in the MC. On the other hand, using a constant rate to describe molecular formation modeled the data less accurately than the resonance model. In the thicker HD target where resonant molecular formation competes with scattering of the atoms and hence energy loss, agreement between theory and data is quite good. The theory developed for the resonant process does not take into account any effects of the crystal lattice or its motion with respect to the atoms. It has been suggested that effects in the solid hydrogen crystal lattice may affect the slowing process and thus the reaction yields [19]. Incorporating such effects into the simulation is a logical next step.
This work was supported by NSERC (Canada), the DOE and NSF (USA), the Swiss National Science Foundation and a NATO Linkage Grant LG 930162.
REFERENCES
- [1] Present address: Department of Physics, University of Northern British Columbia, Prince George, B.C., Canada V2N 4Z9; email: Porcelli@triumf.ca.
- [2] Present address: Department of Physics, University of Tokyo, Hongo, Tokyo 113-0033, Japan.
- [3] L.I. Ponomarev, Cont. Phys. 31, 219 (1990).
- [4] C. Petitjean, Nucl. Phys. A 543, 79c (1992).
- [5] M.P. Faifman et al., Hyp. Int. 101-102, 179 (1996); M.P. Faifman and L. Ponomarev, Phys. Lett. B 265, 201 (1991).
- [6] M.C. Fujiwara et al., Phys. Rev. Lett. 85, 1642 (2000).
- [7] M. Jeitler et al., Phys. Rev. A 51, 2881 (1995).
- [8] Yu.P. Averin et al., Hyp. Int. 118, 121 (1999).
- [9] P.E. Knowles et al., Nucl. Instrum. Methods A 368, 604 (1996).
- [10] T.A. Porcelli, Ph.D. Thesis, University of Victoria, (1999).
- [11] P.C. Souers, Hydrogen Properties for Fusion Energy, University of California Press, Berkeley, 1986.
- [12] T.M. Huber et al., Hyp. Int. 118, 159 (1999).
- [13] L. Bracci et al., Muon Catal. Fusion 4, 247 (1989); C. Chiccoli et al., ibid 7, 87 (1992).
- [14] M.P. Faifman, Muon Catal. Fusion 4, 341 (1989).
- [15] F. Mulhauser et al., Phys. Rev. A 53 3069 (1996).
- [16] G.M. Marshall et al., Hyp. Int. 118, 89 (1999).
- [17] V.E. Markushin, Hyp. Int. 101-102 155 (1996).
- [18] Particle Data Group, Eur. Phys. J. C 15, 11 (2000).
- [19] A. Adamczak, Hyp. Int. 119, 23 (1999).


| MC | /dof | /dof | ||
| Input | (=1) | |||
| HD layer = 16 gcm-2 | ||||
| (a) | nominal (see text) | 0.787(29) | 1.87 | 3.23 |
| (b) | unscaled | 0.839(31) | 1.93 | 2.77 |
| (c) | +0.18 eV shift | 0.753(52) | 5.86 | 7.84 |
| (d) | -0.18 eV shift | 0.952(51) | 3.69 | 3.69 |
| (e) | =200 | 1.03(5) | 2.99 | 2.99 |
| (f) | convolution | 0.639(21) | 1.63 | 9.54 |
| HD layer = 37 gcm-2 | ||||
| (a) | nominal (see text) | 1.04(4) | 1.27 | 1.29 |
| (b) | unscaled | 1.14(5) | 1.27 | 1.47 |
| (c) | +0.18 eV shift | 1.06(6) | 2.32 | 2.32 |
| (d) | -0.18 eV shift | 1.08(5) | 1.40 | 1.46 |
| (e) | =200 | 0.998(37) | 0.97 | 0.97 |
| (f) | convolution | 0.751(29) | 1.11 | 2.69 |
| Target | Scaling Factor () |
|---|---|
| 16 gcm-2 | 0.798 (0.060)stat (0.110)corr |
| 37 gcm-2 | 1.040 (0.072)stat (0.148)corr |
| weighted average | 0.897 (0.046)stat (0.166)syst |