A stochastic rainbow caustic observed with cold atoms
Abstract
We report the direct observation of a novel type of rainbow caustic. In contrast to known examples, this caustic originates from a dissipative, stochastic process. We have observed this using cold 87Rb atoms bouncing inelastically on an evanescent-wave atom mirror. The caustic appears as a sharp peak at the lower edge of the asymmetric velocity distribution of the bouncing atoms. The stochastic process is a spontaneous Raman transition due to photon scattering during the bounce. The results are in good agreement with a classical calculation.
32.80.Lg, 42.50.Vk, 03.75.-b
Caustics are ubiquitous phenomena in nature. Examples are the cusp-shaped patterns of light reflection on the inside of a coffee-cup and the patterns of bright lines observed on the bottom of a swimming pool [1]. The prime example of a caustic is the common rainbow, which can be understood in a ray-optics picture by considering how the scattering angle of a light ray depends on its impact parameter on a water droplet [2] . Whereas the incident rays have smoothly distributed impact parameters, the outgoing rays pile up where the scattering angle has a local extremum. Such a divergence of the ray density, the caustic, appears at the rainbow angle. In atomic [3] and nuclear [4] scattering experiments analogous rainbow phenomena have also been observed.
The examples of caustics that have been known so far have in common that the outgoing parameter (scattering angle) is a deterministic function of the incoming parameter (impact parameter). In this Letter we report on our observation of a new type of rainbow caustic existing by virtue of a stochastic process, which distributes a single-valued “impact parameter” over a range of “scattering angles”. To our knowledge, such stochastic caustics have not been observed before.
We have observed this caustic in the vertical velocity distribution of cold atoms, after bouncing inelastically off an evanescent-wave mirror [5, 6, 7, 8]. Previous experiments on the transverse velocity distribution of atoms bouncing elastically on corrugated mirrors [9, 10] also allow an interpretation in terms of caustics. However, those were of the usual deterministic kind, where the outgoing transverse velocity is a deterministic function of the position where the atom hits the mirror. The caustic then originates from atoms reflecting from inflection points on the mirror surface.
Whereas other experiments on inelastically bouncing atoms concentrated on the cooling properties, the appearence of the velocity caustic seems to have escaped attention. The incident atoms in our experiment are nearly monochromatic, i.e. they have a narrow velocity distribution . During the bounce the atoms are optically pumped to a different hyperfine ground-state, by a spontaneous Raman transition. They leave the surface with less kinetic energy, due to the difference in optical potential. The outgoing atoms have a broad velocity distribution. This is due to the stochastic nature of the spontaneous Raman process, so that atoms make the transition at different depths in the evanescent wave. Our measurements and analysis show that the resulting velocity distribution is highly asymmetric. The caustic appears as a sharp peak at the minimum possible velocity. This divergence demonstrates the strong preference for making the Raman transition at the turning point.
The experiment is performed in a rubidium vapor cell. We trap about atoms of 87Rb in a magneto-optical trap (MOT) and subsequently cool them in optical molasses to 15 K corresponding to a r.m.s. velocity spread of cm/s. The MOT has a radius of mm and is centered mm above the horizontal surface of a right-angle BK7 prism. When the falling cloud arrives at the surface, the mean velocity is cm/s, and the velocity spread is cm/s. Note that this distribution is for fixed , not for fixed time. At the surface, we create an evanescent wave (EW) by a Gaussian shaped laser beam of mm radius, which undergoes total internal reflection.
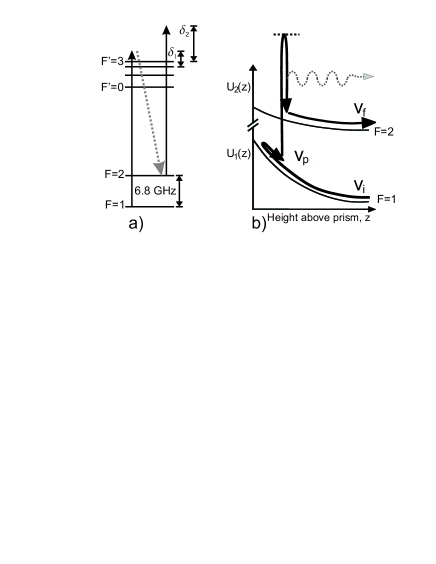
The blue detuned EW induces a repulsive optical dipole potential , where the subscript denotes the hyperfine ground state, , with the free space wave vector of the light, the refractive index and the angle of incidence [11, 12, 13]. The maximum potential , where is the incident intensity at the glass surface, and is the detuning. Here we define the detuning relative to the transition of the line (780 nm), see Fig.1. Note that we neglect the van der Waals surface attraction. This is justified as long as is much larger than the kinetic energy of the atoms. The main influence of this force is a reduction of the effective mirror area [14].
An atom entering the EW in the state is slowed down by the potential . Spontaneous Raman-scattering can transfer the atom to the higher hyperfine ground state (). When transferred into this state, the potential acting on the atom is , which is weaker due to the increase of the detuning by approximately the hyperfine splitting (Fig.1). The ratio of the two potentials, , quantifies the reduction in potential energy. As a result the atoms will bounce inelastically, i.e. to a lower height than their initial release position.
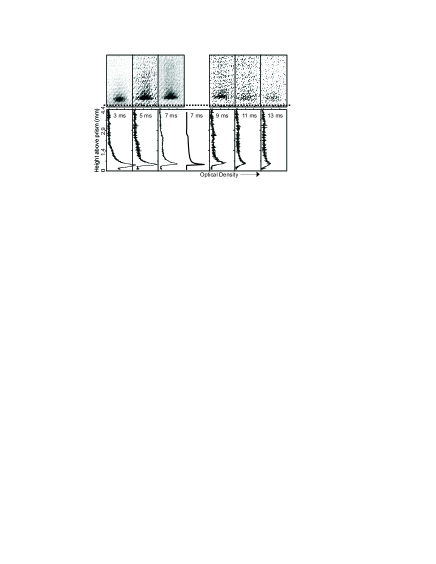
Experimental data of bouncing atoms are taken by absorption imaging. After a variable time delay the atomic cloud is exposed to s of probe light, resonant with the transition. Thus only atoms which have been transferred to contribute to the signal. The atomic cloud is imaged on a digital frame-transfer CCD camera. The presented images show an area of mm2 with a pixel resolution of m (Fig.2) . The initial position of the MOT is outside the field of view. The horizontal line at the bottom shows the prism surface.
A typical series with 2 ms time increments is shown in Fig.2, where is defined as the time that the center of the cloud reaches the mirror. Each density profile has been converted into a horizontal line sum. The solid curve is the result of a calculation described below. The amplitude of the experimental curves is rescaled such that the maximum optical density of the experimental curve coincides with the theoretical maximum value. This is the only fit parameter.
As expected, the atoms bounce up less high than their initial height. Furthermore, the spatial distribution shows another striking feature: it displays a high density peak at low , and a long low-density tail extending upward. Note also that there is a time-focus: the density peak is sharpest when the slowest atoms reach their upper turning point. This density peak is an immediate consequence of a caustic appearing at the minimum possible velocity.
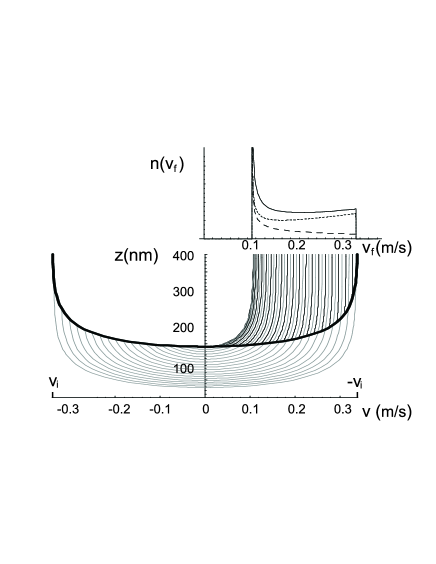
The caustic can be understood by considering the atoms as point particles moving in the EW potential. This corresponds to the ray-optics limit for the optical rainbow. We consider an atom arriving at the surface in its hyperfine ground state, with an initial downward velocity . Its trajectory through phase space is determined by energy conservation: , and is depicted in Fig.3 by the thick line. While it is slowed down by the EW it may scatter a photon at a velocity , and be transferred to the state. The atom continues on a new trajectory determined by . To illustrate the formation of the caustic, possible trajectories starting at various positions in phase space are depicted as thin gray () and black () curves. For asymptotically large the density of curves represents the outgoing velocity distribution, showing the caustic where the trajectories pile up. This distribution is similar to a rainbow. The density of outgoing trajectories diverges at the ”rainbow velocity”. Below this velocity the intensity is zero, similar to Alexander’s dark band in the optical rainbow [2]. Above the rainbow velocity the intensity distribution decreases smoothly.
Despite the similarities, there is a crucial difference between a rainbow created by sunlight refracted by waterdroplets and our ’velocity caustic’. The appearance of a rainbow is due to a deterministic process, where the scattering angle is uniquely determined by the impact parameter. In our experiment the incoming velocity is nearly single-valued, and is distributed over a broad range of outgoing velocities by the stochastic process of spontaneous Raman scattering.
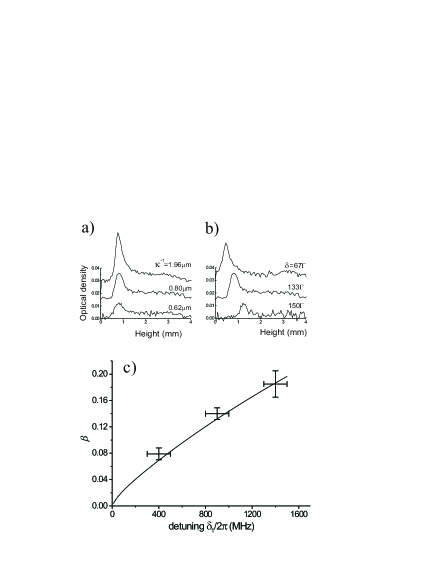
Given the novel character of this caustic, the analogy with known examples can only be valid to some extent. For example, the position of the caustic is independent of the size parameter . Similarly the optical rainbow angle does not depend on the droplet size. We measured for three different values of the decay length the atomic density profile at the upper turning point (Fig.4a). This is defined as the highest position reached by the peak density. The shape of the cloud did not change, but the number of atoms decreased with decreasing since the total number of scattered photons is lower.
The limitation to the analogy becomes apparent through the parameter which determines the position of the caustic. This parameter characterizes the “degree of dissipation” and therefore has no analogy in the optical rainbow, or any other deterministic caustic. For example, the optical rainbow angle is determined by the index of refraction of water. However, the energy of the photons is not changed, and therefore cannot be compared to . The change in the position of the caustic with can clearly be seen in Fig.3b,c. Here we measured the height of the upper turning point, as a fraction of the initial MOT height, for three values of the detuning.
In order to quantitatively analyze our experimental data, we write the optical hyperfine-pumping rate during the bounce as , where is the branching ratio to . We define as the survival probability for the atom to reach the velocity without undergoing optical pumping. This function decreases monotonically as , with . For , the solution is , where , with the atomic mass. When the pumping process takes place at a certain velocity , the atom leaves the surface with velocity (Fig.1). This results in a distribution of bouncing velocities, resulting from atoms which were pumped while moving toward () or away from () the surface : for , which diverges at . This velocity caustic originates from atoms which are pumped near the turning point. There are two reasons for scattering preferentially at this position. An atom spends a relatively long time at the turning point since its velocity is lowest there. In addition, the intensity of the EW, and thus the photon scattering rate is highest at the turning point. The divergence is an artefact of the ray-optics description. It disappears due to diffraction when the atoms are treated as matter waves.
To compare the experimentally obtained spatial distributions with the model, we first calculated the one-dimensional phase-space density . The spatial distribution is obtained by projecting on the -axis. Initially the MOT is described by a normalized gaussian, with mm, mm and cm/s. The cloud falls due to gravity and expands due to thermal motion. When it arrives at the EW, its velocity distribution is nearly gaussian centered around cm/s, with a spread of cm/s. When the cloud is reflected, its velocity distribution is changed in the way described above. We measure the spatial distribution of inelastically bounced atoms after a time of flight . To illustrate the agreement with the experimental data, the result for a time ms is drawn as the thick line in Fig. 2.
A very intriguing aspect of our experiment is the possibility to observe supernumeraries: interference of two trajectories with the same outgoing velocity, but with opposite pumping velocity . In the velocity distribution after the inelastic bounce, the high velocity tail is the sum of two contributions: from atoms moving towards and moving away from the surface when they are pumped to . Interference between these two paths should result in oscillations in the velocity distribution. This is a nontrivial effect because it involves the spontaneous emission of a photon.
Given our experimental parameters, we expect a typical oscillation period of cm/s. This spacing depends on , just as in a rainbow the supernumeraries depend on the droplet size. These oscillations are not yet resolved in our measurements, because in the EW-field the magnetic substates are not degenerate, each producing a different velocity distribution.
In conclusion, we have observed a new type of caustic due to the stochastic distribution of a monochromatic input. The caustic appears as a sharp peak at the lower edge of the velocity distribution of rubidium atoms, bouncing inelastically on an evanescent-wave atom mirror. The caustic bears some resemblance to the common optical rainbow. However its dissipative character makes it uncomparable with any deterministic caustics and qualifies it as a new physical phenomenon.
This work is part of the research program of the “Stichting voor Fundamenteel Onderzoek van de Materie” (FOM) which is financially supported by the “Nederlandse Organisatie voor Wetenschappelijk Onderzoek” (NWO). R.S. has been financially supported by the Royal Netherlands Academy of Arts and Sciences.
REFERENCES
- [1] M.V. Berry, in Les Houches, Session XXXV (1980), Physics of defects, R. Balian et al., eds., (North Holland, 1981) p. 455-543.
- [2] H.M. Nussenzveig, Sc. Am. 236, (1977).
- [3] K.W. Ford and J.A. Wheeler, Ann. Phys. 7, 287 (1959); D. Beck J. Chem. Phys. 37, 2884 (1962).
- [4] M.E. Brandan and G.R. Satchler, Phys. Rep. 285, 143 (1997).
- [5] J. Söding, R. Grimm and Yu.B. Ovchinnikov, Opt. Comm. 119, 652 (1995)
- [6] P. Desbiolles, M. Arndt, P. Szriftgiser, and J. Dalibard, Phys. Rev. A 54, 4292 (1996);
- [7] D.V. Laryushin, Yu.B. Ovchinnikov. V.I. Balykin, and V.S. Letokhov, Opt. Comm 135, 138 (1997);
- [8] Yu.B. Ovchinnikov, I. Manek, and R. Grimm, Phys. Rev. Lett. 79, 2225 (1997)
- [9] A. Landragin et al., Europhys. Lett. 39, 485 (1997)
- [10] P. Rosenbusch, B.V. Hall, I.G. Hughes, C.V. Saba, and E.A. Hinds, Appl. Phys. B 70, 709 (2000)
- [11] R.J. Cook and R.K. Hill, Opt. Comm. 43, 258 (1982).
- [12] V.I. Balykin, V.S. Letokhov,Yu.B. Ovchinnikov, and A.I Sidorov, JETP Lett. 45, 353 (1987)
- [13] D. Voigt, B.T. Wolschrijn, R. Jansen, N. Bhattacharya, R.J.C. Spreeuw, and H.B. van Linden van den Heuvell, Phys. Rev. A 61, 063412 (2000)
- [14] A. Landragin et al., Phys. Rev. Lett. 77, 1464 (1996)