Infrared Fluorescence of Xe2 Molecules in beam–excited Xe Gas at high Pressure
Abstract
We report experimental results of proton– and electron–beam–induced near–infrared (NIR) fluorescence in high–pressure Xe gas at room temperature. The investigated wavelength band spans the range In the previously unexplored range for we have detected a broad continuum NIR fluorescence at that shifts towards longer wavelengths as pressure is increased up to We believe that this continuum is produced in a way similar to the VUV continua of noble gas excimers and that the pressure–dependent shift can be explained by the interaction of the outer electron of the excimer with the gas.
keywords:
Xe , excimers , infrared fluorescence.PACS:
33.20.Ea , 34.50.Gb, , , , and ††thanks: Corresponding author. E-mail:davide.iannuzzi@pv.infn.it, Fax:+390382423241
1 Introduction
Excited states of rare gas atoms are produced easily by means of several techniques, including electric discharges, irradiation with ionizing particles, or resonance lines [1, 2]. Experimental studies of deexcitation processes allowed to shed light on the potentiality of rare gases as sensitive media in ionizing particle detection [3] and as media for high energy electronic transition lasers [4]. The ability to efficiently convert electron kinetic energy to electronic excitations and to rapidly convey the excitation energy to lower–lying atomic and excimer levels leads excited dense rare gases to emit a considerable fraction of the released energy in a narrow band in the vacuum–ultraviolet (VUV) range [5].
Beside the emission stemming from atomic transitions, a great deal of work has been devoted to the VUV continuum radiation related to transitions between excited states and the repulsive ground state of neutral diatomic rare–gas molecules. Several studies of either particle–beam– or laser–induced VUV fluorescence, including time–resolved spectroscopy, have contributed to clarify the kinetics of collisional deactivation of excited atomic levels leading to the formation of rare–gas excimers and to the population inversion required for VUV lasing [6, 7, 8, 9, 10, 11, 12, 13, 14, 15, 16, 17, 18, 19].
VUV fluorescence in particle–excited emission spectra of dense noble gases is also exploited for direct and proportional scintillation for high–energy particle detection [3]. The emission in the VUV range is produced by several reactions between ionized, excited, and neutral gas atoms and free electrons leading to excimers which decay radiating the VUV continua. At moderately high pressures this kind of emission is believed to dominate over all other types of radiative decay including atomic emission [14].
Much less attention has been devoted to possible infrared (IR) or near-infrared (NIR) emission, which might be related to transitions between excited states of the rare–gas dimers, because efficient lasers in these wavelength bands can be accomplished by much easier means. However, the current improvements in photomultiplier and semiconductor detector technology and the fact that the NIR emission can be treated with standard optical components make the NIR emission worth to be accurately investigated as a further promising tool to complement the VUV scintillation for the detection of ionizing radiation and to possibly enhance the energy resolution of detectors [20, 21].
Among rare gases, Xe is one of the most used species in detectors, both in the gaseous and in the liquid state. In spite of this, little spectroscopic information is available for NIR emission involving either higher excited excimer levels or excited atomic levels, and only VUV light is used for detection purposes.
Two issues have been mainly investigated in Xe. On one hand, there are studies on the pressure dependence (up to ) of atomic transition lines in the band [22, 12, 13]. This band has been investigated in order to study the deactivations reactions of the state–selectivelly photoexcited levels of Xe, which involve radiation and collisions with ground state Xe atoms. These states are of particular importance for understanding the dominant energy pathways in excimer lasers. In fact, they are the primary products of dissociative recombination of molecular ions and decay towards states belonging the manifold [11]. Further collisions of excited atoms in the manifold with ground state Xe atoms lead to the formation of the (in the scheme of Hund’s coupling case ) excimer states in the notation where spin–orbit coupling is neglected) [23]. The decay of these states towards the repulsive molecular ground state gives origin to the first and second VUV continua.
On the other hand, intense transient absorption bands induced in Xe by short electron beam pulses have been detected in the region m [2]. These bands are broader than atomic absorption lines appearing in the same region and have been thus attributed to bound–bound transitions between different excimer levels. Namely, one of the observed bands (called first absorption) is believed to correspond to the vibrational structure related to the transitions between the excimer states of the configuration (related to the excited atomic state) and the of the configuration (related to the atomic state) [24]. This suggests that radiative decay takes place prior to the vibrational relaxation of the excited molecule.
In contrast to the other noble gases, Xe does not show, in the explored range [2], a second absorption band at longer wavelengths. This may be associated with both a bound-free transition between the bound excimer state of the configuration and the (possibly) dissociative state of the configuration, and with a bound–bound transition between the and the excimer states. This last absorption band should also show vibrational structure [2].
It is therefore worth investigating the possibility of NIR emission from particle–excited Xe gas at high pressure in order to ascertain the feasibility of new scintillation detectors based on a simpler optics than VUV detectors. But it is also interesting to investigate possible alternative routes of the neutralization of the rare–gas dimer ions rapidly formed in three-body collisions to excimer levels different from the lowest ones in a situation where the large collisional frequencies will establish thermal equilibrium among the rotational and vibrational degrees of freedom on a time scale much shorter than the relaxation of the electronic states [25].
We have thus carried out measurements of NIR fluorescence in Xe gas at room temperature in the spectral region nm at pressures up to corresponding to a gas density The fluorescence has been induced by irradiating the gas sample with pulsed beams of either protons or electrons. We have detected an intense and broad band centered about which shows unexpected properties as a function of the gas density. Here we report the first results obtained.
2 Experimental Details
The experimental technique is based on the analysis of the NIR spectrum emitted by a gas sample irradiated with an ionizing particle beam. In our experiment, we have measured the response of a gaseous Xe sample excited by either an electron– or proton beam. In the first case, electrons are produced by a home-made keV electron gun described elsewhere [27]. The electron bunches have a duration of ns and contains approximately nC charge. In the proton case, a MeV, nA continuous beam is extracted by a van de Graaf accelerator (at INFN-LNL laboratories) and chopped into bunches through s long. The chopper frequency is Hz. A simplified schematics of the experimental setup is shown in Fig. 1.
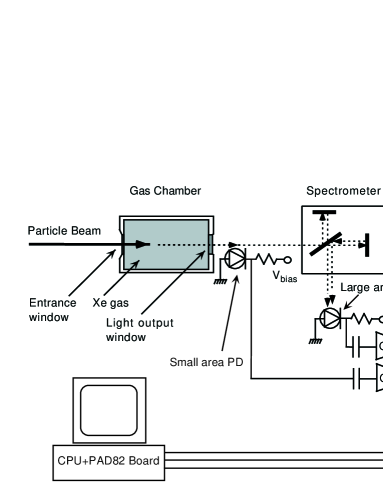
The Xe sample is kept at room temperature inside a cylindrical stainless-steel chamber. The chamber is previously evacuated down to about mbar and then filled with gas. The nominal impurity content (mainly O2) is 1 part per million. The filling pressure is measured by a pressure transducer (SuperTJE, Sensotec). The density is calculated by means of a standard equation of state [28].
The particle beam enters the chamber through a suitable window (20 m thick Fe window for protons, 8 m thick Kapton window for electrons). The emitted light exits the cell through an opposite quartz or sapphire window.
The emitted light spectrum is recorded and analyzed by a Fourier transform infrared spectrometer (Equinox55, Bruker Optics). The light exiting the interferometer is detected by a InGaAs photodiode with a sensitive area of mm2 (C30723G, EGG) and quantum efficiency in the nm range. The scheme of the electronic read-out of the photodiode is reported in Fig. 1. A similar but smaller InGaAs photodiode (GAP3000, Germanium Power Device) collects a fraction of the NIR light at the entrance of the spectrometer, just in front of the interferometer, for normalization purposes. Both photodiodes are kept at room temperature.
The electronic board controlling the movable mirror of the interferometer (TC20, Bruker Optics) and the read-out circuits of both photodiodes are connected to a personal computer equipped with an high-speed 16 bit A/D converter (PAD82, Bruker Optics). Since the particle bunches are too fast to take a complete interferogram in one single shot, we use the so-called step-scan technique. The mirror is moved, step by step, in the interval between two consecutive bunches. The signals of the two InGaAs detectors are digitized and stored by the computer. The final interferogram is obtained by sorting the large area photodiode data as a function of the mirror position. The signal of the smaller photodiode is used to weight the interferogram with the integrated light intensity in order to get rid of fluctuations of the particle beam intensity during the experimental run. Moreover, several acquisitions are stored for each mirror position in order to improve the signal-to-noise ratio.
The acquisition range is usually set between 5000 and 15000 cm-1. The resolution ranges between 50 and 100 cm-1. The interferogram-to-spectrum conversion is performed by the OPUS 3.03 system software (Bruker Optics). The spectrum is then weighted by the quantum efficiency of the detector.
The acquisition system has been calibrated by means of an infrared laser-diode (PGAS1S03/S, EGG). An Al2O3(Ti) sample has been irradiated in this experimental setup and its well-known laser emission spectrum has been obtained [29].
We have to finally note that the signal–to–noise ratio is not very high for several reasons, mainly because not many photons are emitted for each particle bunch and the statistics is therefore quite small. Moreover, the background noise level of the InGaAs detectors is pretty large since they cannot be cooled below room temperature.
3 Experimental Results
Time–integrated emission spectra were obtained from up to at room temperature. The corresponding gas density range is approximately In figure 2 we show a typical NIR emission spectrum from high–pressure proton–beam excited Xe gas at . The spectra obtained with an electron–beam are similar.
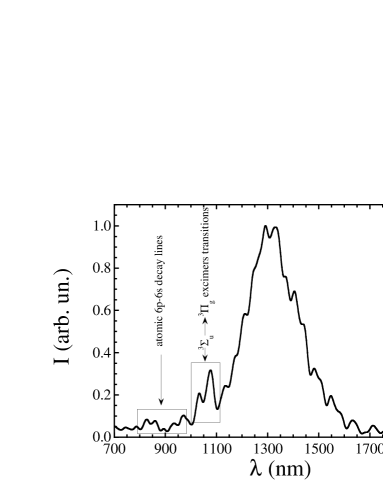
The most important feature of this spectrum is the central, largely unstructured, continuum centered about nm, which was not revealed before. In the figure we have framed in boxes the regions where atomic decay lines [13] and the (possible) excimer absorption bands [2] were previously observed. It cannot be ruled out the possibility that some lines might be obscured under such a broad continuum.
A wavelength nm corresponds to an energy difference i.e., of the right order of magnitude for electronic transitions in diatomic rare–gas molecules [23]. This fact and that the emission spectrum in this range is a continuum suggest that the broad NIR peak might be associated with a transition from a bound excimer level (possibly endowed with vibrational structure) to a dissociative state of lower energy different from the repulsive Xe2 ground state. This hypothesis would agree also with the observation that there is no emission at wavelengths shorter that the first and second VUV continua [1]. Moreover, a semiquantitative analysis of the potential energy curves of Xe suggests that such processes could result in emission in the region [24].
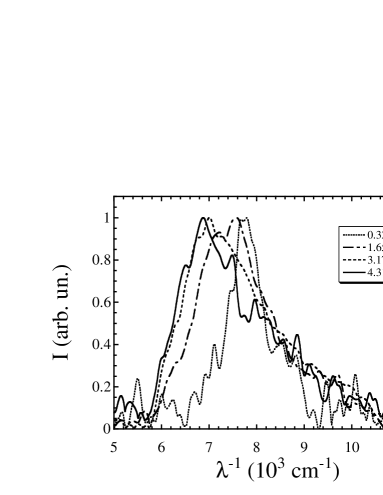
Upon increasing the gas pressure, the NIR continuum shifts to longer wavelengths. In figure 3 the spectra recorded at four different pressures are shown as a function of the inverse wavelength
In order to give an estimate of the density–dependent red–shift of the spectra, we plot in figure 4 the position of the emission maximum determined by fitting a Lorentzian curve to the the observed spectra. The error bars in the figure are the statistical uncertainties of the fit.

The position of the maximum shifts linearly with density towards the red wing. In any case, the maximum shift observed amounts to well in excess of the experimental accuracy.
A similar shift has been observed in the same density range for the second VUV continuum in Xe [1]. However, in that case the maximum relative shift of the emission peak amounts to and is comparable with the experimental accuracy of the data. It is also known that even the atomic lines of noble gases (for instance Kr and Xe in the wavelength range exhibit a weak density dependent red shift, of the order of in a density range much larger than the present one, which is interpreted in terms of density dependent local field corrections in the classical dispersion theory [26] .
It can be clearly noted from figure 3 that also the peak width is affected by pressure. Namely, the

NIR continuum broadens as increases. In figure 5 the emission FWHM, is plotted as a function of the gas density. (The error bars are again the statistical uncertainties of the fit.) At small densities, corresponds to an energy spread of and increases up to at the high density boundary of this experiment. This amount is too large to be due to thermal fluctuations only at room temperature). Moreover, the increase of is not linear with Therefore, a simple assumption of collisional broadening might be not completely adequate. Under this respect the observed behavior is opposite to that of the second VUV continuum. In fact, in the latter case the FWHM decreases almost linearly by in the same pressure range of the present experiment. The narrowing of the VUV continua with increasing pressure has been explained in terms of a hypothetic absorption in a ground state population that increases with increasing pressure. This fact would also be responsible for the red shift of the wavelength of the emission maximum [1].
4 Discussion
Owing to the similarities and differences of the NIR emission continuum with the observed VUV continua we would like to suggest a possible model for understanding the present experimental results.
The wavelength band of the NIR emission is centered about nm. This value roughly corresponds to the energy difference between the stable excimer levels of the configuration, correlated with the Xe + Xe dissociation limit, and the energy level of the Xe + Xe system. According to Mulliken [24], the latter system may give origin, among others, to short–distance excimer potential energy curves, which are mainly dissociative in nature. Namely, there are the mainly repulsive energy curves of the states of the excimer configuration and the repulsive energy curves of the excimer states belonging to the configuration. The latter ones intersect the potential energy curves of the stable excimers.
We therefore assume that excited Xe atoms belonging to the manifold can be deactivated to lower–lying excited Xe atoms in the manifold not only through direct atomic transitions but also via the formation of highly excited excimers These, in turn, decay radiatively to the dissociative states or to the mainly dissociative states leading to dissociation into a ground–state Xe atom and one excited Xe atom in the manifold. Finally, excited Xe atoms in the manifold give origin to the lower lying excimer levels responsible for the production of the well–known VUV continua. The NIR emission may originate from high vibrationally excited levels directly populated, or from relaxed vibrational levels populated through collisional processes [30].
The nature of the bound excimer levels of the configuration is predissociative owing to the intersection of their potential curves with those of the dissociative states [23]. This should produce a further increase of the width of the NIR band in addition to the usual collisional broadening. Moreover, at the temperature of the experiment several rotational degrees of freedom should be excited, too [25].
The most important feature of the observed NIR continuum is its large density–dependent red shift. It is well known [30] that the electronic structure of homonuclear excimers can be described quite accurately by an ionic molecular core and an electron in a diffuse Rydberg orbital much larger in diameter than the internuclear distance [2]. Such a state can exist even in a high pressure environment provided that the Rydberg electron is weakly scattered by the gas atoms, or, in other words, if the electron mean free path is much larger of the radius of the orbit of the Rydberg state. In a pretty dilute gas, like in the present experiment, this condition is fulfilled because the electron mean free path is several nanometers long [31].
In order to simplify the discussion, let us therefore treat the excimer levels with the aid of the Bohr model of a hydrogen–like atom in the same way as Wannier–Mott excitons are dealt with in liquids or solids [32]. The excimers can be considered as impurities in the gas and their highest excited states are given by the equation [32]
| (1) |
where is the principal quantum number and is the dielectric constant of the gas. The energy is expressed in eV. Eq. (1) is valid provided that the electron orbit is sufficiently large as to encompass several atoms of the gas.
However, if the radius of the orbit of the Rydberg electron is pretty large, the interaction of the outer electron with the atoms of the host gas gives origin to a density–dependent shift of the electron energy. This phenomenon affects the absorption lines of alkali vapors immersed in a buffer gas [33]. The energy shift depends on the ordinal number of the spectral lines of the series and converges to a limit, proportional to the density of the buffer gas. This limit has been calculated by Fermi [33] as
| (2) |
where is the electron mass and is the scattering length for the interaction of the slow, Rydberg electron with an atom gas. The energy levels of the highest excited states must be then corrected for this contribution yielding [32]
| (3) |
For attractive electron–atom interaction potential and gives origin to a density–dependent red shift of the spectral lines [33].
Let us furthermore assume that the excimer decays to a lower–lying, excited atomic level of Xe, whose energy levels can be approximated by the same Bohr equation Eq.(1). The Bohr formula does indeed give an ionization energy of 13.6 eV to be compared with the actual value of 12.1 eV for atomic Xe.
The correction has been included only in the energy levels of the excimer because it is assumed that the orbit of the electron in the less excited atom is smaller. On the contrary, the correction due to the gas polarizability is accounted for in the same way. Obviously, the validity of these approximations will depend on the agreement with the experimental data.
The energy released in the transition from the excimer level to the atomic one corresponds to a wavelength given by
| (4) |
where and are the principal quantum numbers of the final and initial states. The first contribution is positive because The dielectric constant of Xe can be obtained by the usual Lorentz–Lorenz formula but, in the density region of interest, it can be approximated, within by where is the atomic polarizability of Xe [34].
Actually, the value of the quantum numbers and are not known, the electron in the Xe atom gives origin to four non–degenerate states and there are also vibrationally excited states of the excimer. Therefore, we cast Eq. (4) in a form better suited for further analysis
| (5) |
where is a yet unkown constant to be determined and we have expanded By suitably collecting the terms proportional to the density we finally obtain
| (6) |
where we have exploited the fact that the electron–Xe atom scattering length is negative, [35].
Eq. (6) predicts a linear decrease of the inverse wavelength with increasing density. Moreover, it contains only one fitting parameter, which is obtained only as the intercept of the straight line at zero density. Once has been determined by the fitting procedure, the slope is no longer adjustable because it only contains additional contributions given by universal constants.
The straight line in figure 4 has been drawn with slope given by
with as determined from the zero–density extrapolation of the data. If a straight line is fitted to the data a slope of value is obtained. The agreement with the experimental slope is excellent. We stress once more the fact that as soon as the zero–density value of has been determined, there are no more free parameters left. By neglecting either the screening of the Coulomb interaction due to polarization or the density–dependent shift of the energy levels of the Rydberg electron in a large–radius orbit, the slope of the straight line would become nearly smaller than actually measured.
Obviously, the nature of the excimers in the configuration is predissociative because their potential energy curves intersect the repulsive potential energy curves of states leading to dissociation in a Xe atom plus an excited one in the manifold. Also the excimer states of the configuration are mainly repulsive, though their potential energy curves do not intersect those of the excimer states. Therefore, there is a continuum of kinetic energy available to the dissociation products and a continuum NIR emission band is produced. Nonetheless, the continuum of kinetic energy is probably distributed around the final states in such a way that an average value for it can be well approximated by Eq. (1). Moreover, the predissociative nature of the excimer states might be responsible for the non linear increase of the NIR continuum width. This might also be the reason for the very different behavior of the width of the VUV continuum [1], that decreases with increasing density. In fact, for the transitions there are no intersections between potential energy curves and the higher excimer states are not predissociative. However, a quantitative description would require much more accurate potential energy curves than those actually available.
The assumptions leading to the previously described model could raise severe criticisms. In particular, the radius of the Rydberg electron in the excimer might not be large enough to guarantee that the energy levels are affected either by the dielectric constants or by the Fermi shift or both. However, we believe that the striking agreement of the model with the experimental data gives some credit to the model itself. Further measurements at higher densities in Xe are needed (and are in progress) to confirm the first data reported here. Moreover, the investigation of mixtures of Xe with other noble gases with different polarizabilities and different should help testing the model.
References
- [1] H. A. Koehler, L. J. Ferderber, D. L. Redhead, and P. J. Ebert, Phys. Rev., A9 (1974) 768.
- [2] S. Arai, T. Oka, M. Kogoma, and M. Imamura, J. Chem. Phys., 68 (1978) 4595.
- [3] G. F. Knoll, Radiation Detection and Measurements, (Wiley, New York, 1989).
- [4] Excimer Lasers, in Topics in Applied Physics, vol. 30, Ch. K. Rhodes Editor, (Springer, Berlin, 1979).
- [5] D. C. Lorents, Physica, 82 C (1976) 19.
- [6] S. Arai and R. F. Firestone, J. Chem. Phys., 50 (1969) 4575.
- [7] N. Bőwering, M. R. Bruce, and J. W. Keto, J. Chem. Phys., 84 (1986) 709.
- [8] N. Bőwering, M. R. Bruce, and J. W. Keto, J. Chem. Phys., 84 (1986) 715.
- [9] O. Dutuit, R. A. Gutcheck, and J. Le Calvè, Chem. Phys. Lett., 58 (1978) 66.
- [10] T. Oka, K. V. S. Rama Rao, J. L. Redpath, and R. F. Firestone, J. Chem. Phys., 61 (1974) 4740.
- [11] E. V. George and C. K. Rhodes, Appl. Phys. Lett., 23 (1973) 139.
- [12] P. Moutard, P. Laporte, J.–L. Subtil, N. Damany, and H. Damany, J. Chem. Phys., 88 (1988) 7485.
- [13] P. Moutard, P. Laporte, N. Damany, J. L. Subtil, and H. Damany, Chem. Phys. Lett., 132 (1986) 521.
- [14] P. Moutard, P. Laporte, J.–L. Subtil, N. Damany, and H. Damany, J. Chem. Phys. 87 (1987) 4576.
- [15] E. Audouard, P. Laporte, J.–L. Subtil, and N. Damany, J. Chem. Phys., 89 (1988) 6176.
- [16] P. Millet, A. Birot, H. Brunet, J. Galy, B. Pons–Germain, and J. L. Teyssier, J. Chem. Phys., 69 (1978) 92.
- [17] A. Ulrich, A. J. Kőrner, G. Ribitzki, D. E. Murnick, E. Matthias, P. Kienle, and D. H. H. Hoffmann, J. Appl. Phys., 62 (1987) 357.
- [18] B. Busch, A. Ulrich, W. Krőtz, G. Ribitzki, J. Wieser, and M. Winkler, J. Appl. Phys., 74 (1993) 5960.
- [19] H. D. Wenck, S. S. Hasnain, M. M. Nikitin, K. Sommer, G. Zimmerer, and D. Haaks, Chem. Phys. Lett., 66 (1979) 138.
- [20] G. Carugno, Nucl. Instr. Meth, A 419 (1998) 617.
- [21] P. Lindblom and O. Solin, Nucl. Instr. Meth, A 268 (1988) 204.
- [22] P. Berejny, P. Millet, M. Saissac, and Y. Salamero, J. Phys. B: At. Mol. Opt. Phys., 26 (1993) 3339.
- [23] G. Herzberg, Molecular Spectra and Molecular Structure. I. Spectra of Diatomic Molecules, (Van Nostrand, Princeton, 1957).
- [24] R. S. Mulliken, J. Chem. Phys., 52 (1970) 5170.
- [25] M. Selg, Physica Scripta, 52 (1995) 287.
- [26] P. Laporte, N. Damany, and H. Damany, Phys. Rev., A12 (1975) 1944.
- [27] S. Belogurov, G. Bressi, G. Carugno, E. Conti, D. Iannuzzi, and A. T. Meneguzzo, Nucl. Instr. Meth., A 449 (2000) 254.
- [28] D. G. Friend, NIST Thermophysical Properties of Pure Fluids Database, v.3.0 (National Institute of Standards and Technology, Gaithersburg, 1992).
- [29] G. Bressi, G. Carugno, E. Conti, C. Del Noce, and D. Iannuzzi, Nucl. Instr. Meth. (in press).
- [30] E. Audouard and F. Spiegelmann, J. Chem. Phys., 94 (1991) 6102.
- [31] S. S. –S. Huang and G. R. Freeman, J. Chem. Phys., 68 (1978) 1355.
- [32] B. Raz and J. Jortner, Proc. Roy. Soc. London, A 317 (1970) 113.
- [33] E. Fermi, Nuovo Cimento, 11 (1934) 157.
- [34] G. C. Maitland, M. Rigby, E. Brian Smith, and W. A. Wakeham, Intermolecular forces. Their Origin and Determination, (Clarendon, Oxford, 1981).
- [35] K. Rupnik, U. Asaf, and S. P. McGlynn, J. Chem. Phys. 92 (1990) 2303.