Phase-coherent frequency measurement of the Ca intercombination line at 657 nm with a Kerr-lens mode-locked femtosecond laser
Abstract
The frequency of the Calcium 3P1—1S0 intercombination line at 657 nm is phase–coherently measured in terms of the output of a primary cesium frequency standard using an optical frequency comb generator comprising a sub–10 fs Kerr-lens mode-locked Ti:Sapphire laser and an external microstructure fiber for self–phase–modulation. The measured frequency of = 455 986 240 494 276 Hz agrees within its relative uncertainty of with the values previously measured with a conceptually different harmonic frequency chain and with the value recommended for the realization of the SI unit of length.
pacs:
06.20.Fn, 06.30.Ft, 42.62.EhSo far, the use of optical frequency standards for the realization of basic units, e. g. of time and length, was hampered by the difficulties of measuring their high frequencies. As a result, the most precise frequency values recommended by the Comité International des Poids et Measures (CIPM) are based on very few frequency measurements [1]. Recent progress in femtosecond pulse generation and the advent of microstructure optical fibers [2, 3, 4], however, have substantially facilitated such optical frequency measurements. These schemes [5, 6, 7] start with the highly periodic pulse train of a Kerr–lens mode–locked laser which corresponds in the to a comb–like frequency spectrum of equidistant lines. The spectral span of this comb reflects the duration of an individual pulse while the spacing between the lines is determined by the pulse repetition frequency. It has been shown, that the fast, spectrally far–reaching Kerr–lens mode–locking mechanism enforces a tight coupling [8] of the optical phases of the individual lines. As a result, the frequency of any of these lines is given by an integer multiple of the pulse repetition frequency and a frequency [9, 10, 11] which accounts for the offset of the entire comb with respect to the frequency origin. If these quantities are known, the unknown frequency of any external optical signal can be precisely determined by counting the frequency of the beat–note between this signal and a suitable comb line. In this Letter, we report the first application of this method to phase–coherent measurements of the frequency of an optical Ca frequency standard operating on the 1S0—3P1 intercombination transition at 657 nm.
The frequency of this state–of–the–art standard has already been measured with a conventional harmonic frequency chain [12, 13], and the frequency value of = 455 986 240 494 150 Hz has been recommended by the CIPM for the ’Practical realization of the definition of the metre (1997)’ [1] with a relative standard uncertainty of . The present experiments allow for the first time the comparison of two conceptually different phase–coherent optical frequency measurements, the conventional type operating in absolute–frequency domain and the novel type operating in difference–frequency domain. This comparison is performed without the need for intermediate transportable standards.
Two of the three required measurements mentioned above, the pulse repetition rate and the multiple integer factor, are straightforward to carry out. The measurement of the carrier–envelope offset frequency , which arises from the relative velocity of the carrier phase and the pulse envelope, is a more demanding task. Several more or less complex schemes, depending on the comb span available, have been proposed for the measurement of [10]. The simplest concept requires an octave span of the frequency comb which is not directly available from our laser. Thus, the available span has to be expanded, e. g. by external self–phase–modulation (SPM). Microstructure air–silica fibers, which allow for tailoring the group velocity dispersion (GVD) properties [2] are highly suited for SPM of moderate peak power pulses available from mode–locked laser oscillators since they provide both lateral and temporal confinement of the pulses over long interaction lengths. If the octave span is achieved, then the measurement can be accomplished by second–harmonic generation (SHG) of the spectral lines in the low–frequency wing of the comb. Whereas the of the comb lines are shifted by with respect to the origin, their harmonics are shifted by . Thus, the beat notes between these harmonics and the corresponding high–frequency–wing lines of the comb show the desired component at .
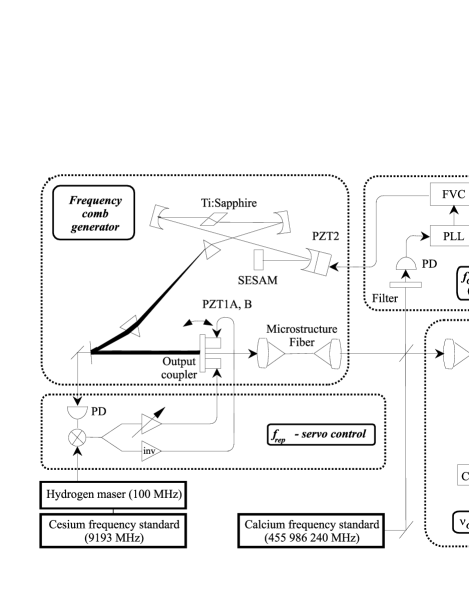
As depicted in Fig. 1, our measurement set–up consists of four parts: the frequency comb generator (i), detectors and electronics for servo control and/or data acquisition of the pulse repetition frequency (ii), of the beat note between the laser and Ca–standard radiation (iii) and of the carrier–envelope–offset frequency (iv).
i) The Kerr-lens mode-locked (KLM) Ti:Sapphire laser is similar to that
described in [14]. The laser generates pulses with a duration of 10 fs,
a repetition rate = 100 MHz, an
average power of 120 mW and a spectrum centered at 790 nm.
The group velocity dispersion (GVD) of its
cavity is controlled by double–chirped mirrors and an intracavity fused silica prism pair.
A similar external
prism pair (not shown in Fig. 1) is used for pulse recompression.
Approximately 30 mW of the laser output is
coupled into a 10 cm long piece of microstructure fiber with a core diameter of 1.7 m and a
zero–GVD wavelength of 780 nm [2]. The output spectrum of the fiber was measured to cover the
range from 520 nm to 1100 nm, while the comb structure with distinct lines spaced by
100 MHz is expected to be
preserved even in the extreme wings of the SPM–broadened spectrum. This was confirmed by measurement
of the fringe–visibility (after appropriate optical filtering) at the output of a two beam interferometer with
100 MHz fringe spacing yielding a 100 % visibility throughout the entire comb.
ii) The repetition frequency of the laser was detected with a fast Si PIN photo
diode yielding a 100 MHz
signal with a S/N–ratio of 140 dB (BW = 1 Hz). It was phase–locked to the 100 MHz
output signal of a hydrogen
maser which was controlled by the PTB primary Cs standards. The actuator of this servo loop is a double piezo
device (PZT1A and B) which tilts the output coupler where the spectral components are laterally
displaced by the intra–cavity double prism GVD compensator. Tilting of the output coupler
predominantally modifies the resonator
round–trip group delay [9] which, in turn, determines .
iii) The frequency of the beat note between the radiation from the Ca–standard
(at optical frequency ) and
the nearest comb mode was both measured and long–term stabilized. For this purpose, the output of the Ca
standard was combined with the emission from the output of the microstructure fiber, which was filtered by an
interference filter. The beat note was detected by a Si PIN photo diode.
Its output signal with a typical
S/N–ratio of 30 dB (BW = 100 kHz)
was filtered by a phase–lock–loop tracking oscillator (PLL) and subsequently
counted by a totalizing counter. The beat signal frequency was kept within the hold–in range of the PLL by an
additional servo loop controlling the length of the Ti:Sapphire–laser resonator with the help of a piezo transducer
(PZT2). The error signal of this slow loop was generated by a frequency–to–voltage–converter (FVC) which
monitored the output frequency of the PLL.
Unwanted cross–talk between the and servo loops was minimized by adjustment
of the lever point of the –tilting actuator to the lateral position of the red comb components
at 657 nm. This was accomplished
by choosing appropriate gain values (of opposite sign) for the piezo transducers PZT1A and B.
iv) The frequency was measured, as mentioned above, by external self–phase
modulation in the microstructure fiber and
subsequent second–harmonic generation in a nonlinear optical crystal. The infrared portion of the fiber
output around 1070 nm was frequency doubled with a non–critically phase–matched,
10 mm long LiB3O5 (LBO) crystal,
which was heated to about 140 ∘C in order to fulfill the type-I phase–matching condition
for this wavelength. The
beat note between the resulting green SHG signal and the green output of the fiber was detected by a photo
multiplier (PM) after spectral and spatial filtering both fields with a single mode fiber and a
600 l/mm grating, respectively.
The PM output signal with a S/N ratio of up to 40 dB(BW = 100 kHz)
was filtered with a
second tracking oscillator and counted by a second totalizing counter. Both counters were synchronously gated
by the same 1 Hz clock signal derived from the 100 MHz hydrogen maser signal.
The optical Ca frequency standard has been described elsewhere [13, 15], and only the relevant details shall be given here. This standard is operated in a different building and is linked to the Ti:Sapphire laser by a 150 m long polarization–preserving single–mode fiber. Two independent systems are available, producing clouds of between and ballistic Ca atoms which are released from magneto–optical traps (MOT 1 and MOT 2). Each trap is loaded for 15 ms. Then the trapping lasers at 423 nm and the magnetic quadrupole fields are switched off, and a homogeneous magnetic field of 0.23 mT is switched on for spectral separation of the Zeeman components. At the same time the cloud starts to expand and to fall down due to its thermal velocity ( 3 mK) and gravity, respectively. After a settling time for the magnetic field of 0.2 ms the atoms are interrogated by pulses from a frequency–stabilized dye laser. For the frequency measurements MOT 1 was employed, in which the low velocity atoms are directly captured from a thermal beam by three mutually perpendicular counterpropagating beams with two different frequencies. The atoms were excited in a time–domain analogue of the optical Ramsey excitation by two pulses separated by 216.4 s followed by two pulses with the same separation from a counterpropagating beam [15]. The frequency of the interrogating laser field was stabilized to the central fringe (FWHM of the fringes 1.16 kHz) of the interference structure that occurs when the fluorescence of the excited atoms is measured as function of the laser frequency. The uncertainty of the frequency of the Ca optical frequency standard during both measurement series was estimated to 53 Hz. A more detailed uncertainty budget is given in [15]. Several tests have been performed to check the validity of this estimate. By reversing the temporal order of the excitation pulses a shift of a few Hertz was determined. The frequency of the laser stabilized to atoms of MOT 1 was compared with its frequency when stabilized to a second MOT 2. Here, the atoms of an effusive beam are decelerated in a Zeeman slower and these slow atoms are deflected and directed towards the magneto–optical trap [16]. The frequency difference measured when the laser was stabilized alternatively to atoms from MOT 1 and MOT 2 by three pulses of a standing wave was Hz. An additional laser field at 672 nm was used in MOT 1 to repump the atoms which are lost via the 1D2 state [17]. The magnetic field of 0.23 mT caused a second order Zeeman shift of the Ca frequency of +3.1 Hz.
| 1 [Hz] | relative 1 | ||
|---|---|---|---|
| [Hz] | uncertainty | ||
| Series A | 100 | 328 | |
| Series B | 148 | 132 | |
| Series A+B | 126 | 180 | |
| Previous Meas. [15] | -20 | 113 | |
| CIPM recomm. [1] | 0 | 270 |
Two measurement series were carried out on different days with a total measurement time of 3000 and 4200 s, respectively. On these days the frequency deviation of the hydrogen maser and the Cs clock resulted in deviations of the measured Ca frequency of +26 Hz and 24 Hz, respectively. The deviations of the corrected measured mean values from the CIPM–recommended value of = 455 986 240 494 150 Hz are listed in Tab. 1 together with the corresponding relative 1 uncertainties, which comprise the estimated relative frequency uncertainties of the standards and those of the frequency measurements. The values of the previous measurement [13] using the harmonic frequency chain and the CIPM values [1] are shown for comparison.
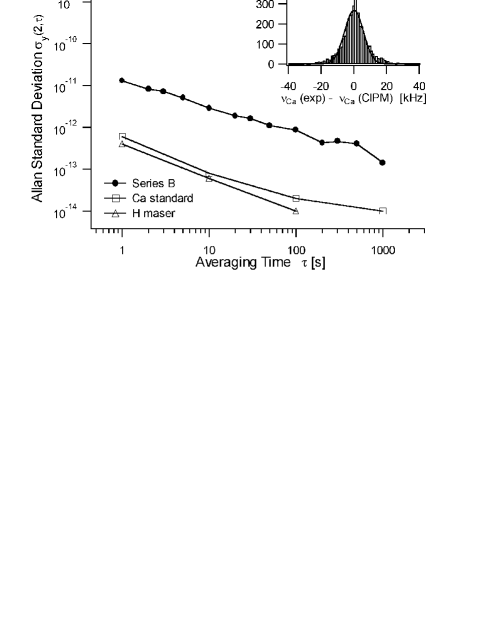
Fig. 2 shows the Allan standard deviation of the data of series B together with the corresponding frequency instabilities of the Ca standard [18] and those of the hydrogen maser [19]. The inset of Fig. 2 shows a histogram of the data of series B (1 s averages) with respect to the CIPM–recommended frequency. The center frequency of the fitted Gaussian of + 46 Hz agrees within the uncertainty with the mean value of series B. The instability of the frequency measurement process is about one order of magnitude larger than the frequency instability of the Ca standard and of the hydrogen maser. So far, the measurements are still limited by the non–optimum detection of the frequency fluctuations of the Ti:Sapphire laser. Substantial improvement of the measurement process can be expected if the instantaneous residual phase error between and the hydrogen maser reference signal is simultaneously measured, i.e. at a high harmonic of .
To conclude, the frequency of an optical frequency standard based on the Calcium 3P1—1S0 intercombination transition at 657 nm has been measured in terms of the output of a primary cesium frequency standard using a novel type of optical frequency chain. Accurate frequency measurements of this optical standard are of particular importance since it represents one of the realizations of the unit of length with lowest uncertainty. Furthermore, the optical frequency of the Ca standard is used as a reference for highly accurate frequency measurements of other optical or ultraviolet transitions [20]. The frequency value presented in this Letter agrees within its relative uncertainty with the CIPM–recommended value, which is based on a measurement with a harmonic frequency chain. The agreement justifies the confidence in the data obtained from both measurement schemes. The advantages of the novel scheme employed here, such as the substantially reduced complexity and the accurately known, dense grid of reference frequencies throughout the visible and near infrared range, allows a variety of new applications including the realization of optical clocks or ultra–precise measurements in fundamental physics.
We gratefully acknowledge financial support from the Deutsche Forschungsgemeinschaft through SFB 407, experimental assistance by B. Lipphardt and H. Schnatz, and help for the set–up of the Ti:Sapphire laser by G. Steinmeyer and U. Keller.
REFERENCES
- [1] T. J. Quinn, Metrologia 36, 211 (1999).
- [2] J. K. Ranka, R. S. Windeler, and A. J. Stentz; Opt. Lett. 25, 25 (2000).
- [3] J. C. Knight, T. A. Birks, P. S. J. Russell, and D. M. Atkin; Opt. Lett. 21, 1547 (1996).
- [4] N. G. R. Broderick, T. M. Monro, P. J. Bennett, and D. J. Richardson; Opt. Lett. 24, 1395 (1999).
- [5] A. Apolonski et al.; Phys. Rev. Lett. 85, 740 (2000).
- [6] S. A. Diddams et al.; Phys. Rev. Lett. 84, 5102 (2000).
- [7] M. Niering et al.; Phys. Rev. Lett. 84, 5496 (2000).
- [8] T. Udem, J. Reichert, R. Holzwarth, and T. W. Hänsch; Opt. Lett. 24, 881 (1999).
- [9] J. Reichert, R. Holzwarth, T. Udem, and T. W. Hänsch; Opt. Commun. 172, 59 (1999).
- [10] H. R. Telle et al.; Appl. Phys. B 69, 327 (1999).
- [11] D. J. Jones, S. A. Diddams, and J. K. Ranka; Science 288, 635 (2000).
- [12] H. Schnatz et al.; Phys. Rev. Lett. 76, 18 (1996).
- [13] F. Riehle et al.; IEEE Trans. Instrum. Meas. IM 48, 613 (1999).
- [14] D. H. Sutter et al.; Opt. Lett. 24, 631 (1999).
- [15] F. Riehle et al.; in Proceedings of the 1999 Joint Meeting of the European Frequency and Time Forum and The IEEE International Frequency Control Symposium (EFTF co/Société Francaise des Microtechiques et de Chronométrie (SFMC), Besancon, France) p. 700 (1999).
- [16] T. Kisters, K. Zeiske, F. Riehle, and J. Helmcke; Appl. Phys. B 59, 89 (1994).
- [17] C. W. Oates, F. Bondu, R. W. Fox, and L. Hollberg; Eur. Phys. J. D 7, 449 (1999).
- [18] F. Riehle et al.; in Trapped Charged Particles and Fundamental Physics, edited by D. H. E. Dubin and D. Schneider (American Institute of Physics, Woodbury, New York, 1999), pp. 348–356.
- [19] A. Bauch; Time–Unit–Section of the Physikalisch–Technische Bundesanstalt, Braunschweig, Germany, private communication (2000).
- [20] K. R. Vogel et al.; submitted to Opt. Lett. (2000).