MEASURING AND CONTROLLING ENERGY SPREAD IN CEBAF††thanks: Work supported by the United States Department of Energy under Contract No. DE-AC05-84ER40150.
Abstract
As compared to electron storage rings, one advantage of recirculating linacs is that the beam properties at target are no longer dominated by the equilibrium between quantum radiative diffusion and radiation damping because new beam is continually injected into the accelerator. This allows the energy spread from a CEBAF-type machine to be relatively small; the measured energy spread from CEBAF at 4 GeV is less than 100 parts per million accumulated over times of order several days. In this paper, the various subsystems contributing to the energy spread of a CEBAF-type accelerator are reviewed, as well as the machine diagnostics and controls that are used in CEBAF to ensure that a small energy spread is provided during routine running. Examples of relevant developments are (1) stable short bunches emerging from the injector, (2) precision timing and phasing of the linacs with respect to the centroid of the beam bunches on all passes, (3) implementing 2 kHz sampling rate feedback systems for final energy stabilization, and (4) continuous beam energy spread monitoring with optical transition radiation devices. We present measurement results showing that small energy spreads are achieved over extended periods.
1 INTRODUCTION
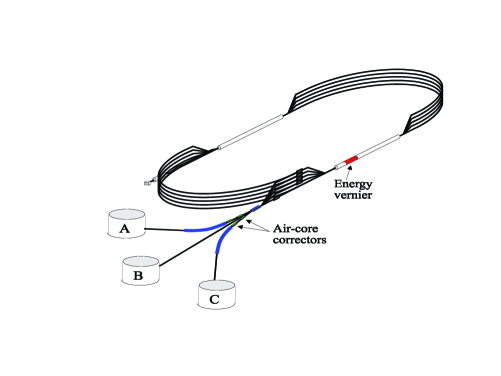
In this paper we summarize the present status on energy spread measurement and control in the Jefferson Lab nuclear physics accelerator called CEBAF. A schematic diagram of CEBAF appears in Fig. 1 and a summary of relevant beam parameters is given in Table 1, where all sizes are rms quantities. CW beam, originating in the injector, is recirculated up to five times through each linac. The beam may be directed into up to three experimental halls simultaneously, the beam current in the halls being at the third subharmonic of the accelerator operating frequency of 1497 MHz. Because of the low charge-per-bunch at even the highest operating current, collective effects are not an important source of energy spread in CEBAF. Fig. 1 locates some of the feedback system hardware, discussed in Section 6 below.
| Item | Value | Unit |
|---|---|---|
| Beam Energy | 0.8-6 | GeV |
| Beam Current | 180 | A/Hall |
| Normalized rms Emittance | 1 | mm mrad |
| Repetition Rate | 499 | MHz/Hall |
| Charge per Bunch | 0.4 | pC |
| Extracted rms Energy Spread | ||
| Transverse rms Beam Size | 100 | m |
| Longitudinal rms Beam Size | 60(200) | m(fsec) |
| Beam rms Angular Spread |
2 SOURCES AND TYPES OF ENERGY SPREADS IN RECIRCULATING LINACS
Because the electron beam remains in CEBAF for times that are short compared to the usual radiation damping times for the recirculation rings, the energy spread of the recirculating beam is not determined by the equilibrium defined by the quantum character of the emission of synchrotron radiation. What effects do determine the energy spread? The sources of energy spread will be grouped into two broad categories: the single bunch energy spread which is the same for all bunches in the train, and fluctuation energy spread which is derived from fluctuations in the beam centroid energy.
Sources of single bunch energy spread are: (1) the injected single bunch energy spread, (2) energy spread generated by the finite phase extent of the bunches interacting with the time-dependent accelerating field, (3) synchrotron emission in the arcs, (4) average phase errors in the synchronization of the cavity RF to the beam, (5) summed phase errors from whole linac sections that are not properly balanced, and (6) interactions of the beam energy spread with non-zero in the arcs, which might cause the injected bunch length to grow.
Sources of energy fluctuations are: (1) RF phase fluctuations in individual RF cavities, (2) RF amplitude errors in the individual cavities, (3) master oscillator noise, and (4) magnetic field fluctuations in dipole magnets that are used for energy measurements by the feedback system. We will address each of these potential sources of energy spread. The general philosophy used at CEBAF is to use measurements to ensure the machine setup minimizes the single bunch energy spread, and to use feedback systems to correct energy fluctuations. Our point-of-delivery diagnostics allow us to ensure that the energy spread is under control throughout the duration of physics running.
3 LONGITUDINAL MANIPULATIONS IN INJECTOR
In general terms, the function of the injector is to accelerate the electron beam to an energy high enough that the phase slip caused by different passes being at different energies is small, and to manipulate the longitudinal phase space of the beam in a way that minimizes the overall extracted energy spread. To solve the first problem, 45 MeV injection energy is sufficient for 4 GeV total acceleration. A simple calculation gives guidance on injection conditions that produce the optimal energy spread. Assume for the moment that one could phase each linac cavity for exactly maximum energy gain. Then the energy of a bunch electron after leaving the accelerator is where and are the initial and final energy, respectively, and is the phase of the electron with respect to the bunch centroid (assumed on crest at ). Utilizing the single particle distribution function for the electrons at injection to perform the proper statistical averages one obtains
where and are the rms energy spreads after acceleration and at injection, respectively, and is the rms phase spread at injection. The first term damps as energy is increased because the initial spread becomes a smaller part of the total, whereas the final term does not depend on the energy because both energy and energy spread accumulate at the same rate due to a non-zero bunch length. Given a certain longitudinal emittance from the source and the final energy, there is an optimum energy spread of at the optimal injected bunch length of . A typical measured value for is 6.7 keV ∘, yielding an optimal energy spread of at 4 GeV, with a bunch length of fsec. A primary function of the injector is to provide a longitudinal phase space “matched” to this bunch length.
A way of providing this match has been developed and documented in various conference proceedings and workshops [1, 2]. Here we concentrate on the measurements done routinely to ensure that proper bunching has been achieved. A main diagnostic used at CEBAF is to perform phase transfer function measurements [3, 4]. The basic idea is to phase modulate the beam at the beam chopper, with the rest of the RF phases in the accelerator held constant. By analyzing the longitudinal transfer function for its linear and non-linear behavior, one has a way to ensure that the beam longitudinal phase space is bunched in a way that minimizes distortion in the bunching process, including the non-linearities due to RF curvature and higher order terms [2]. Such measurements are routinely used to restore the proper operation of the injector after machine downs, or when certain types of operational problems arise.
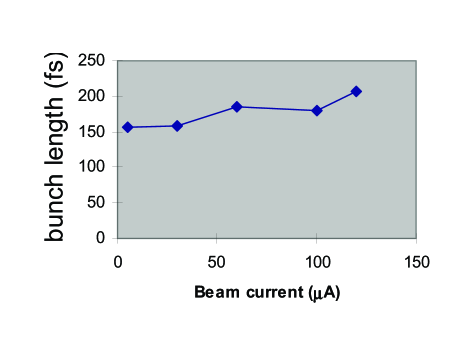
Next we present a summary viewgraph from another talk at this conference, which shows that the bunch length is properly adjusted [5]. In Fig. 2, we present the bunch length as measured by the zero-phasing method [6], as a function of current over the full operating range of the CEBAF accelerator. One observes a roughly constant bunch length between 150 and 200 fsec (45 and 60 m). This value is matched well enough that the extracted single bunch energy spread is less than .
What are the effects associated with breaking the assumption of ideal phasing? In an analysis that was used to set tolerances for the RF controls [7, 8, 9], it was demonstrated that as long as: (1) the uncorrelated amplitude errors in the cavities were under , (2) the uncorrelated phase fluctuations in the cavities were under several tenths of a degree, (3) the phasor sum of the gradients obtained from each cavity is purely real, and (4) the thermal drifts along the linac were stabilized to an error less than 2.6∘, then the resulting energy fluctuations in the beam would be less than for an assumed bunch length of 0.3∘. Another way of stating condition (3) is that for each pass through the accelerator, one would like to arrive at the time that provides the crest energy for the whole linac. Next, we discuss how this condition is achieved in practice.
4 PATH LENGTH AND
Suppose for the moment that the phase of one pass through one linac was off crest by radians. Then the relative energy spread generated by this error is , the factor of ten appearing because we have assumed one linac pass is not phased properly out of ten linac passes total. To have the resulting energy spread at 10 ppm, one needs the phase error to be less than mrad = 2∘ for a bunch length of 300 fsec.
Likewise, suppose that we require less than 10% growth in the bunch length going through each arc of CEBAF. By a statistical argument, there will be less than 30% bunch length growth after going through the nine arcs of the CEBAF accelerator. Given a beam energy spread less than 10-4, the of the arcs should not exceed 10 cm, a fairly weak limitation.
Presently, the apparatus in routine use to perform this measurement is based on measuring the time-of-arrival of each separate beam pass with a longitudinal pickup cavity tuned to the beam fundamental, whose output is mixed with the master oscillator in a phase detector arrangement [10]. The development of this device from first experiments to final instrument is documented in several Particle Accelerator Conference contributions [10, 11, 12]. Because only relative times-of-arrival are required, the precision of the method is very high. With 4.2 sec 4 A beam pulses, a precision of 0.1∘ = 185 fsec is routinely achieved. Such precision is clearly sufficient for setting the path length, and allows of the arcs to be determined to under 3 cm by an energy modulation experiment where the energy is changed by .
5 MASTER OSCILLATOR MODULATION SYSTEM
There is a significant limitation in the present system used to set the path length. Path length checks must be done invasively to normal beam delivery, by going into a pulsed beam mode. It would be far better to have a method to monitor the linac phases, including higher passes, continuously and accurately. During the last few years a system has been developed that will allow continuous monitoring and cresting of the linacs on all passes [13]. This system had its origin in an automatic beam-based linac cresting routine [14], and it is already used routinely to set the first pass through each linac close to crest.
The system takes advantage of the CW electron beam delivered by CEBAF and standard lockin techniques. It is based on phase modulating the master reference going to each of the linacs, at 383 Hz for measurements of the first, so-called north linac, and at 397 Hz for the south linac. Simultaneously and coherently with the modulations, one observes the position motion on a beam position monitor (BPM) downstream of both linacs at a point of non-zero dispersion. Linac cresting corresponds to zero output from the BPM at the modulation frequency. Long integration times permit cresting to be performed with high precision. The required phase modulation is small enough that the energy spread generated by the dither remains small.
Table 2 summarizes the system parameters and performance of the Master Oscillator Modulation system. Its performance, especially in the next step in setting the higher pass beams close to crest, should allow us to reduce the energy spread of the extracted beam by roughly a factor of two.
| Item | Value | Unit |
|---|---|---|
| Modulation Amplitude | 0.05 | 1497 MHz ∘ |
| Modulation Frequencies | 383, 397 | Hz |
| Sensitivity | 6000 | |
| Operating Current | 2 | A |
| Dispersion at BPM | 1.4 | m |
| Measurement Precision | 0.1 | 1497 MHz ∘ |
6 FAST FEEDBACK SYSTEM
As mentioned in the introduction, sources of bunch energy centroid fluctuations are corrected by a fast digital feedback system [15]. The system corrects beam position and energy near the targets of the nuclear physics experiments utilizing energy measurements obtained from the bend magnets which deliver the beam to the various halls, see Fig. 1. The system is capable of suppressing beam motion in the frequency band from 0 to 80 Hz and also performs narrow band suppression at the first twelve power line harmonics. The system operates with a 2.1 kHz sampling rate and utilizes two VME board computers to compute the corrections. Energy corrections are fed back as analogue signals to the gradient set points in the RF controls of a few cavities in the linac called vernier cavities.
For the standard optics in CEBAF, the horizontal dispersion is maximum in the middle of the bend magnets delivering the beam to the halls. Its value is approximately 4 m, meaning position fluctuations at 10 ppm correspond to 40 m of beam motion. The feedback system suppresses the fluctuations to around 20 m, limited by BPM noise [15]. The beam noise to be corrected is primarily at frequencies of 60 Hz and its first few harmonics.
Because the energy information is so closely tied to the magnetic fields in the beam delivery lines to the halls, a question arises about the stability of the magnetic fields themselves at the 10-5 level. The total magnetic field at several points within the magnets have been verified to be stable to 10 ppm, and the power supplies deliver current having similarly small fluctuations. Recently, we have installed a magnetic flux loop monitor through the dipole strings to the halls. This monitor will provide better quantitative information than we currently possess on residual fluctuations in the magnets, and will be able to address the issue of magnet stability directly.
7 ENERGY SPREAD DIAGNOSTICS
The accelerator is equipped with slow wire scanners using 22 m diameter tungsten wires. Beam profiles for currents in the 2 to 5 A range can be accurately measured once a minute with such scanners. More recently, we have developed a profile monitor that can measure even the most intense beams using forward optical transition radiation (OTR) [16, 17]. A very thin (1/4 m) carbon foil inserted into the beam path is not invasive to physics experiments for most CEBAF energies and currents. Presently, OTR monitors are installed in each of the Experimental Hall A and C beam transport lines at the high dispersion points of the beam optics. These monitors provide the experiments and the accelerator with 5 Hz measurement rates for each instrument by using a common image processing hardware. A dedicated software, developed under the EPICS [18] control system, multiplexes up to four video input channels connected to a single MaxVideo image processing board [19]. The global processing speed is 10 Hz, 5 Hz for each of the two OTR monitors. The Hall A OTR measures beams in the 1 to 180 A operational range; in Hall C, the dynamic range extends down to 0.1 A. The resolution of these monitors is limited by the CCD camera to about 2 pixels. This amounts to approximately 70 m of rms beam size.
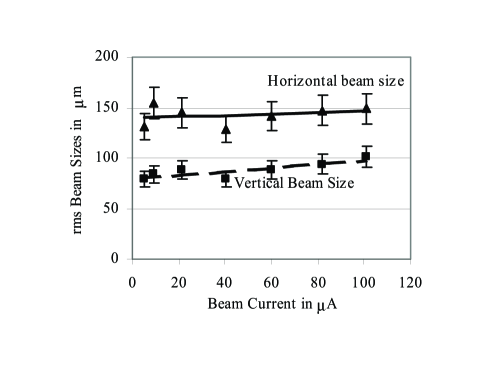
Fig. 3 shows that the energy spread is relatively stable and below for a wide range of beam currents. The horizontal size, measured at the 4 m dispersion point, is mostly due to the energy spread. Neglecting the betatron beam size, 40 m, and the camera resolution, 70 m, overestimates the actual energy spread by less than 25%.
Continuous small energy spread became an operational requirement at CEBAF in Dec. 1999, for a hypernuclear experiment housed in Hall A, and continued until May 2000 with a similar experiment in Hall C. Both experiments ran simultaneously during one month last March, with 2-pass beam for Hall A and a 4-pass beam for Hall C. Delivering two beams with tight energy spread and energy stability requirements instead of one proved demanding. The energy requirements for each experiment were similar: , with energy stability better than . In addition, Hall A needed the transverse beam sizes at the target to be less than 200 m but greater than 100 m and a beam position stable within 250 m.
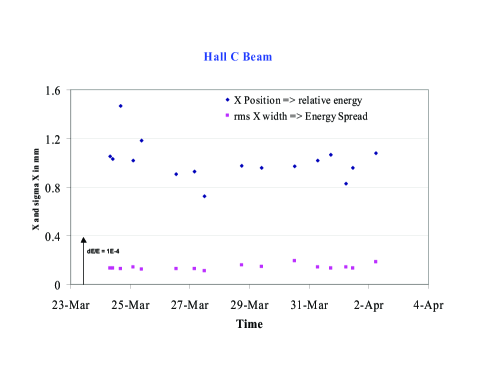
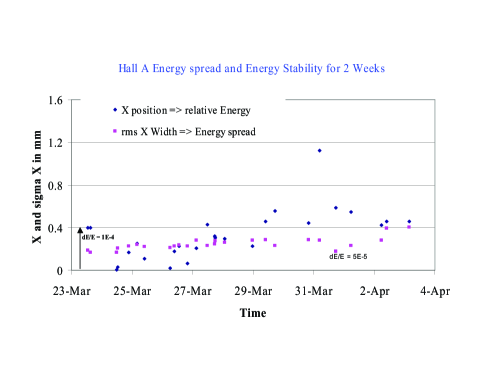
The energy spread requirements have been routinely achieved for the hall under feedback control. Because the feedback system can correct the energy fluctuations only in a single hall as presently configured, there were uncertainties that the spread in the other hall would remain small. Fig. 4 shows energy spreads and relative energies in the Hall C beam recorded over a 2-week period, with Hall C transport line providing the energy corrections to the energy feedback system. Small energy spreads were delivered throughout the period to Hall C, however drifts led to energy spread increases in the Hall A beam, as seen in Fig. 5.
Throughout the experiments in either hall, the energy spread and stability of both beams were continuously recorded. The OTR monitors have been critical in this task. They were initially too cumbersome to be easily used by all operator crews. The implementation of scripts that periodically check and adjust the camera illumination, that initialize the image processing board according to the beam, and that set a “data valid” flag quickly improved the instrument availability to 95% [19]. After these improvements, the machine crews were able to correct quickly unacceptable energy spreads, usually without interrupting beam delivery.
We are planning to improve the energy spread monitoring for two reasons: 1) At lower energies (1.2 GeV), the beam current had to be lowered to under 50 A to have acceptable radiation levels on sensitive beam-line equipment. 2) Experiments scheduled in 2002 require monitoring an energy spread of . As an alternate to OTR monitoring, we are planning to use synchrotron light beam monitoring, which is less invasive to the experimenters. However, the resolution of such a device is limited to about 100 m in the visible using the bending magnets of the hall transport lines. We are starting a development effort in order to reach about 30 m resolution utilizing the UV synchrotron emission.
8 CONCLUSIONS
We have demonstrated the ability of a CEBAF-type accelerator to produce beams with small energy spreads over long periods of time. We ensure that the energy spread remains small by: (1) ensuring the bunch length out of the injector is small, (2) ensuring that the beam remains close to the crest phase on each separate pass (soon continuously and automatically!), and (3) providing continuous fast correction of 60 cycle harmonic noise on the beam. We have developed beam diagnostic devices to continuously monitor and record beam conditions with 5 Hz update rates using digitization of multiple video monitors.
References
- [1] R. Abbott, et. al., “Design, Commissioning, and Operation of the Upgraded CEBAF Injector”, Proc. of the 1994 Linac Conf., 777 (1994)
- [2] G. A. Krafft, “Correcting and to obtain very short bunches at CEBAF”, Proc. of the Microbunches Workshop, AIP Conference Proceedings 367, 46 (1996)
- [3] C. G. Yao, “A New Scheme for Measuring the Length of Very Short Bunches at CEBAF”, Proc. of the 1990 Beam Instrumentation Workshop, AIP Conference Proceedings 229, 254 (1990)
- [4] G. A. Krafft, “Status of the Continuous Electron Beam Accelerator Facility”, Proc. of the 1994 Linac Conf., 9 (1994)
- [5] R. Kazimi, C. K. Sinclair, and G. A. Krafft, “Setting and Measuring the Longitudinal Optics in CEBAF Injector”, these proceedings
- [6] D. X. Wang, G. A. Krafft, and C. K. Sinclair, “Measurement of Femtosecond Electron Bunches Using a RF Zero-phasing Method”, Phys. Rev. E, 57, 2283 (1998)
- [7] A detailed calculation is performed in an internal note, G. A. Krafft, J. J. Bisognano, and R. Miller, “ Revised Energy Spread Estimate”, CEBAF-TN-0050 (1987). A similar calculation is performed in L. Merminga and G. A. Krafft, “Energy Spread from RF Amplitude and Phase Errors”, Proc. of the 1996 European Part. Acc. Conf., 756 (1996)
- [8] G. A. Krafft, et. al., “Energy Vernier System for CEBAF”, Proc. of the 1993 Part. Acc. Conf., 2364 (1993) summarizes the results in the internal note [7] above.
- [9] S. N. Simrock, et. al., “Operation of the RF Controls in the CEBAF Injector”, Proc. of the 2nd European Part. Acc. Conf., 824 (1990)
- [10] Y. Chao, et. al., “Commissioning and Operation Experience with the CEBAF Recirculation Arc Beam Transport System”, Proc. of the 1993 Part. Acc. Conf., 587 (1993)
- [11] G. A. Krafft, et. al., “Measuring and Adjusting the Path Length at CEBAF”, Proc. of the 1995 Part. Acc. Conf., 2429 (1995)
- [12] D. Hardy, et. al., “Automated Measurement of Path Length and ” Proc. of the 1997 Part. Acc. Conf., 2265 (1997)
- [13] V. A. Lebedev, J. Musson, and M. G. Tiefenback, “High- precision Beam-based RF Phase Stabilization at Jefferson Lab”, Proc. of the 1999 Part. Acc. Conf., 1183 (1999)
- [14] M. G. Tiefenback and K. Brown, “Beam-based Phase Monitoring and Gradient Calibration of Jefferson Laboratory RF Systems”, Proc. of the 1997 Part. Acc. Conf., 2271 (1997)
- [15] R. Dickson and V. A. Lebedev, “Fast Digital Feedback System for Energy and Beam Position Stabilization”, Proc. of the 1999 Part. Acc. Conf., 646 (1999)
- [16] P. Piot, et. al., “High Current CW Beam Profile Monitors Using Transition Radiation at CEBAF”, Proc. of the 1996 Beam Instrumentation Workshop, AIP Conference Proceedings 390, 298-305 (1997)
- [17] J.-C. Denard, et. al., “High Power Beam Profile Monitor with Optical Transition Radiation”, Proc. of the 1997 Part. Acc. Conf., 2198 (1997) Vancouver, BC.
- [18] L. Dalesio, et. al., Proc. Int. Conf. on Accelerators and Large Experimental Physics Control Systems (ICALEPS), 278 (1992)
- [19] D. Hardy, et. al., “Multivideo Source Image Processing for Beam Profile Monitoring System”, Proc. of the 2000 Beam Instrumentation Workshop, AIP proceedings to be published.