Signal Selection Based on Stochastic Resonance
Abstract
Noise aids the encoding of continuous signals into pulse sequences by way of stochastic resonance and endows the encoding device with a preferred frequency. We study encoding by a threshold device based on the Ornstein-Uhlenbeck process, equivalent to the leaky integrate-and-fire neuron model. Preferred frequency, optimum noise intensity, and optimum signal-to-noise ratio are shown to be linearly related to the AC amplitude of the input signal. The DC component of the input tunes the device either into transmission (preferred frequency nearly independent of signal amplitude) or selection mode (frequency rising with amplitude). We argue that this behavior may facilitate selective signal processing in neurons.
pacs:
05.40.-a, 87.19.La, 87.18.SnI Introduction
Our view of noise has shifted markedly over the past two decades: After it had long been seen merely as a nuisance, geophysicists first suggested in 1981 that noise may amplify the effect of weak periodic signals on dynamic systems [1]. This effect, called stochastic resonance (SR), has since been found in a variety of experiments. The origin of stochastic resonance in both dynamical and non-dynamical systems is well understood today, although theories are mostly confined to slow signals. A recent review of the field can be found in Ref. [2].
The finding that noise may aid signal detection and transmission has spurred intense research in the neurosciences, where scientists have long been puzzled by the seeming irregularity of neuronal activity. The benefits of noise for signal processing in neurons have now been demonstrated in a wide range of species: neurons transduce a signal (or stimulus) optimally if a certain amount of ambient noise is present [3]; see Ref. [4] for a review.
Recent studies by ourselves [5] and other authors [6] have revealed a further noise-induced resonance effect in model neurons: There is also an optimum signal frequency, for which the neuron responds with spike trains (output signals) that have a particularly high signal-to-noise ratio (SNR). In this letter, we show that this resonance frequency and the optimum noise amplitude are linearly related to the AC component of the signal impinging on a neuron, while the DC component serves as tuning parameter. We argue that these relations permit the neuron to switch between a signal transmission and a signal selection mode of operation.
The present work is based on the integrate-and-fire neuron model, which will briefly be reviewed in Sec. II, before the noise-induced response properties of the neuron are presented in Sec. III. Implications for neuronal signal processing are discussed in Sec. IV. More details are contained in Ref. [7].
II Model
We focus on the spike generator of neurons for the sake of both simplicity and generality. The spike generator integrates the net input current impinging on the neuron like a leaky capacitor. For sinusoidal input superimposed with white noise, the potential across the capacitor (the membrane potential) is thus governed by [8]
| (1) |
The input is characterized by the DC offset , the signal amplitude , the frequency , and the (arbitrary) initial phase . The noise term with root mean square amplitude and autocorrelation subsumes the noise arising both from cell biochemistry [9] and background activity in the neuronal network [10]. The neuron emits a stereotyped voltage pulse (a spike) whenever the membrane potential reaches a firing threshold ; the potential is reset to immediately thereafter. Time and voltage are measured in their natural units, i.e., the membrane time constant and the firing threshold .
The spike generator thus operates as an analog-to-digital converter [11], encoding the continuous input signal into a pulse train . Even though this model is a gross simplification of biological neurons, it has proven most fruitful for investigations of the nature of the neuronal code [12, 13]. For a derivation of this model from more realistic neuron models, see [14].
We restrict ourselves to sub-threshold signals, which would not elicit any spikes in the absence of noise, i.e., from integration of Eq. (1). These appear to be more relevant than super-threshold signals for the encoding of periodic signals [15]. Note that the membrane potential will oscillate about after an initial transient in the absence of noise.
We measure the performance of the neuron in coding the sinusoidal input by the signal-to-noise ratio
| (2) |
of the output spike train at the signal frequency. Here, is the power spectral density of the train for a given observation time , while the white power spectrum of a Poissonian spike train with equal mean interspike interval , i.e., , is used as reference noise level. is employed throughout [5, 16].
III Response Properties
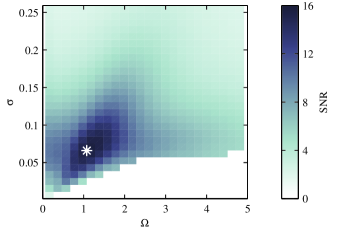
The leaky integrate-and-fire neuron responds best to sinusoidal stimulation—i.e. attains a maximum signal-to-noise ratio—at a particular combination of signal frequency and input noise amplitude , see Fig. 1. The location of the SNR maximum is marked by an asterisk [16]. In what follows, we shall explore the location of and the SNR value at this maximum as a function of the remaining stimulus parameters, namely the signal amplitude , the DC offset , and the reset potential .
In the absence of noise, sub-threshold stimuli evoke membrane potential oscillations about as pointed out in Sec. II. The gap between this average potential and the threshold, , needs to be bridged by the concerted effort of signal-induced oscillations and noise. It is therefore plausible to scale both stimulus and noise amplitude by this threshold distance, i.e., to define relative amplitudes,
| (3) |
Furthermore, the reset potential should enter only as the ratio of the reset distance to threshold distance, which we shall refer to as relative reset
| (4) |
This scaling can be established rigorously via escape noise approximations to the dynamics of the integrate-and-fire neuron [7, 17].
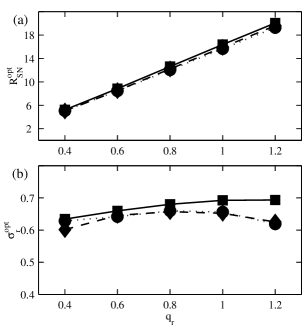
We shall now turn to the relation of the optimum tuning parameters (preferred signal frequency , scaled noise amplitude , and SNR ) to the signal amplitude parameters (scaled AC amplitude , and relative reset ; or DC offset and reset potential instead of ). Figure 2(a) indicates a perfect linear relation between , the attainable SNR, and the stimulus amplitude , while the optimum input noise amplitude is practically independent of , see Fig. 2(b): variations of are about one order of magnitude smaller than the range of values. Both relations are remarkably independent of the value of the DC offset (indicated by symbol/line type in Fig. 2, supporting the scaling given in Eq. (3). and are thus independent of the DC component of the signal transmitted for fixed reset potential.
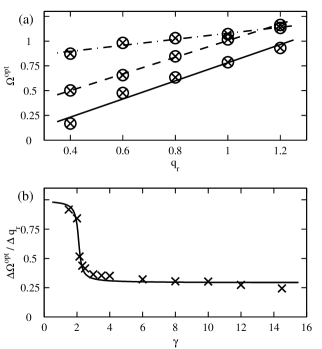
A different behavior is observed for the optimum frequency as shown in Fig. 3(a): For large values of , i.e., a strong positive DC offset, the optimum frequency is nearly independent of the signal amplitude , while small values of lead to a marked linear dependence of on : the preferred frequency may be selected by a variation of the signal amplitude. Figure 3(a) also clearly indicates that the response of the neuron depends on the DC offset and reset potential only via the relative reset , vindicating Eq. (4): each data point shown is a superposition of two almost perfectly coincident points obtained from different -combinations yielding the same (circles, crosses). The same is found for and (not shown). The results presented here are thus applicable both to sensory and cortical neurons: the former are best fit by the model for reset potentials [7], while the latter require [13].
Figure 3(a) indicates that the integrate-and-fire neuron may operate in two different modes: a transmission mode for large , which optimally encodes stimuli of a fixed preferred frequency irrespective of their amplitude, and a selection mode, in which the preferred frequency may be chosen by variation of the stimulus amplitude . The slope of the frequency-amplitude curve (linear least squares fit) as a function of the relative reset is shown in Fig. 3(b). There is a sharp transition between the selection and transmission modes at . No slope could be determined for , since the period of the optimal stimulus tends to the duration of the observation period for small amplitudes in this case.
The two modes of operation arise through different firing patterns: For large relative reset (), less than one spike is fired on average per stimulus period, i.e., the neuron fires at most one well phase-locked spike per period, and often skips periods in between spikes, with a slight increase in spike number with . For small reset (), in contrast, the neuron has a bursting firing pattern for small , i.e., two or three spikes are fired in rapid succession near the maximum of the signal in each period, followed by silence till the next period. As is increased and the optimum frequency rises, the signal period becomes too short to harbor more than one spike and bursting gives way to a more regular firing pattern, with a little more than one spike per period on average. For intermediate reset (), the neuron fires almost regularly, with about spikes per signal period independent of . Cold receptor neurons show all three kinds of firing patterns (skipping, regular, bursting) depending on ambient temperature [18]; their behavior is reproduced well by the integrate-and-fire neuron [7].
IV Functional Significance
Let us summarize the neuronal response properties and discuss them in turn: (i) The optimal signal-to-noise ratio scales linearly with the input signal amplitude, and (ii) is attained at a constant noise amplitude, while (iii) the preferred frequency is either independent of (transmission mode) or linearly related to the signal amplitude (selection mode).
Property (i) means that the optimal SNR of the spike train emitted by the neuron is related to the SNR of the input signal as [19], in qualitative agreement with recent findings in a variant model neuron [20]. This suggests a law of diminishing returns for the signal-to-noise ratio: there is no point in investing valuable resources to improve beyond a certain level, because resulting gains in would be minimal. Since the output of each neuron in turn is input to other neurons, the same argument holds for raising . The level of noise observed in the brain might thus reflect an evolutionary compromise between coding quality and resource consumption.
(ii) The independence of the optimum input noise amplitude from signal amplitude makes the integrate-and-fire neuron a useful signal processing device, as no fine-tuning of the noise to the signal is required to attain optimal performance. The noise level need only be adjusted relative to the DC offset, which largely reflects homogeneous background activity. The optimum noise amplitude of (relative to the threshold distance ) is in good agreement with the observation that coincidence detection in the auditory system of barn owls works best for sub-threshold stimuli which raise the average membrane potential to roughly one noise amplitude below threshold [15].
Property (iii) is the central finding reported here: a model neuron as simple as the integrate-and-fire neuron may switch between two distinct modes of operation, a transmission and a selection mode. Switching between the two modes is achieved by variation of the temporally homogeneous background input to the neuron: weak background activity activates the selection mode, a strong background the transmission mode. Switching between modes requires only moderate variations of the background activity as indicated by Fig. 3(b). In the former, an input signal of particular frequency reaching the neuron through synapses far from the cell body—and thus the spike generator—may easily be (de-)selected: modulatory input through synapses closer to the spike generator need only vary the amplitude of the net input current to the spike generator to tune the neuron’s optimum frequency either closer to or away from the given signal frequency . Selected signals are then coded into spike trains with high signal-to-noise ratio, i.e., trains with clear temporal structure, while deselected signals elicit more random output. Since pulse packets can propagate through networks of neurons only if they are sufficiently strong and tight [21], variation of the SNR provides a means of gating such packets through neuronal networks.
V Summary
We have shown here that the filter properties of a threshold system exploiting stochastic resonance in the sub-threshold regime are linearly related to the AC amplitude of the input signal, and may be tuned by variation of the DC signal amplitude. Our results indicate that such a simple device may, with the aid of noise, provide the means to selectively transmit signals in neuronal networks. It might thus harness noise for the benefit of neuronal computation. Although our study is set in the framework of neurons as the most widespread threshold detectors in nature, the results apply more generally to any threshold system that may be characterized as an Ornstein-Uhlenbeck escape process.
We would like to thank A. N. Burkitt, G. T. Einevoll and W. Gerstner for critically reading an earlier version of the manuscript.
REFERENCES
- [1] R. Benzi, A. Sutera, and A. Vulpiani, J. Phys. A 14, L453 (1981).
- [2] L. Gammaitoni, P. Hänggi, P. Jung, and F. Marchesoni, Rev. Mod. Phys. 70, 223 (1998).
- [3] A. Longtin, A. Bulsara, and F. Moss, Phys. Rev. Lett. 67, 656 (1991). J. K. Douglass, L. Wilkens, E. Pantazelou, and F. Moss, Nature 365, 337 (1993). J. E. Levin and J. P. Miller, Nature 380, 165 (1996). J. J. Collins, T. T. Imhoff, and P. Grigg, J. Neurophysiol. 76, 642 (1996). P. Cordo et al., Nature 383, 769 (1996). F. Jaramillo and K. Wiesenfeld, Nature Neurosci. 1, 384 (1998). E. Simonotto et al., Phys. Rev. Lett. 78, 1186 (1997). R. Srebro and P. Malladi, Phys. Rev. E 59, 2566 (1999).
- [4] K. Wiesenfeld and F. Jaramillo, Chaos 8, 539 (1998).
- [5] H. E. Plesser and T. Geisel, Phys. Rev. E 59, 7008 (1999).
- [6] F. Liu, J. F. Wang, and W. Wang, Phys. Rev. E 59, 3453 (1999). T. Kanamaru, T. Horita, and Y. Okabe, Phys. Lett. A 255, 23 (1999).
- [7] H. E. Plesser, Ph.D. thesis, Georg-August-Universität, Göttingen, 1999, webdoc.sub.gwdg.de/diss/1999/plesser.
- [8] H. C. Tuckwell, Stochastic Processes in the Neurosciences (SIAM, Philadelphia, 1989).
- [9] A. Manwani and C. Koch, Neural Comput. 11, 1797 (1999).
- [10] Z. F. Mainen and T. J. Sejnowski, Science 268, 1503 (1995).
- [11] R. Sarpeshkar, Neural Comput. 10, 1601 (1998).
- [12] W. Gerstner, R. Kempter, J. L. van Hemmen, and H. Wagner, Nature 383, 76 (1996). P. Maršálek, C. Koch, and J. Maunsell, Proc. Natl. Acad. Sci. USA 94, 735 (1997). G. Bugmann, C. Christodoulou, and J. G. Taylor, Neural Comput. 9, 985 (1997). J. Feng, Phys. Rev. Lett. 79, 4505 (1997). L. F. Abbott, J. A. Varela, K. Sen, and S. B. Nelson, Science 275, 220 (1997).
- [13] T. W. Troyer and K. D. Miller, Neural Comput. 9, 971 (1997).
- [14] W. Kistler, W. Gerstner, and J. L. van Hemmen, Neural Comput. 9, 1015 (1997). C. F. Stevens and A. M. Zador, in Proceedings of the 5th Joint Symposium on Neural Computation (Institute for Neural Computation, UCSD, La Jolla, CA, 1998), pp. 172–177. P. Lánský, Phys. Rev. E 55, 2040 (1997).
- [15] R. Kempter, W. Gerstner, J. L. van Hemmen, and H. Wagner, Neural Comput. 10, 1987 (1998).
- [16] was determined for each -combination shown in Fig. 1 by numerical evaluation of Eq. (2); see [5, 7] for details and [22] for a related approach. To obtain , was maximized with respect to and using a Nelder-Mead direct search algorithm [23].
- [17] H. E. Plesser and W. Gerstner, Neural Comput. 12, 367 (2000).
- [18] H. A. Braun, K. Schäfer, and H. Wissing, Funkt. Biol. Med. 3, 26 (1984).
- [19] K. Wiesenfeld et al., Phys. Rev. Lett. 72, 2125 (1994).
- [20] A. N. Burkitt and G. M. Clark, Synchronization of the neural response to noisy periodic input, 1999, submitted.
- [21] M. Diesmann, M.-O. Gewaltig, and A. Aertsen, Nature 402, 529 (1999).
- [22] T. Shimokawa, A. Rogel, K. Pakdaman, and S. Sato, Phys. Rev. E 59, 3461 (1999).
- [23] MATLAB Function Reference, The MathWorks, Inc., Natick, MA, USA, 1998.