Radiative recombination of bare Bi83+:
Experiment versus theory
Abstract
Electron-ion recombination of completely stripped Bi83+ was investigated at the Experimental Storage Ring (ESR) of the GSI in Darmstadt. It was the first experiment of this kind with a bare ion heavier than argon. Absolute recombination rate coefficients have been measured for relative energies between ions and electrons from 0 up to about 125 eV. In the energy range from 15 meV to 125 eV a very good agreement is found between the experimental result and theory for radiative recombination (RR). However, below 15 meV the experimental rate increasingly exceeds the RR calculation and at Erel= 0 eV it is a factor of 5.2 above the expected value. For further investigation of this enhancement phenomenon the electron density in the interaction region was set to 1.6106 cm-3, 3.2 cm-3 and 4.7106 cm-3. This variation had no significant influence on the recombination rate. An additional variation of the magnetic guiding field of the electrons from 70 mT to 150 mT in steps of 1 mT resulted in periodic oscillations of the rate which are accompanied by considerable changes of the transverse electron temperature.
pacs:
34.80.LxI Introduction
Recombination between electrons and highly charged ions plays an important role in different areas of modern physics. The basic two- and three-body recombination processes are of very fundamental nature and thus provide an excellent testing ground for collision theory and atomic structure calculations. Cross sections and rate coefficients of these processes are needed for the understanding of astrophysical and fusion plasmas and also provide useful information for applications in accelerator physics [1]. In particular, beam losses in ion storage rings by electron-ion recombination during electron cooling can post harsh limits to the handling and the availability of ions for further experiments.
During the last decade electron-ion recombination has been extensively investigated. Merged-beams experiments using storage ring coolers and single-pass electron targets at accelerators have provided excellent conditions for a new generation of recombination measurements. In these experiments an incident ion beam is merged with a cold beam of electrons over a distance of typically 50 to 250 cm depending on the specific electron beam device. By choosing the appropriate accelerator facility, ions of most elements in all possible charge states can be investigated nowadays.
Free electrons can be captured by ions via several different mechanisms. The main recombination channel for a bare ion is radiative recombination (RR)
| (1) |
RR is the direct capture of a free electron by an ion Aq+ where the excess energy and momentum are carried away by a photon. After the capture, which is inverse to photoionization, the electron can be in an excited state and there will be further radiative transitions within the ion until the electron has reached the lowest accessible energy level. RR is a non-resonant process with a diverging cross section at zero center-of-mass (c.m.) energy which continuously decreases towards higher c.m. energies.
Another recombination mechanism possible for a bare ion is three-body recombination (TBR)
| (2) |
where the excess energy and momentum are carried away by a second electron. This process is important at high electron densities and very low center-of-mass energies between electrons and ions.
The pioneering experiment on radiative recombination of bare ions was performed by Andersen et al. [2] in 1990. Absolute rate coefficients were measured for C6+ with a merged-beam technique finding a reasonably good agreement between experiment and theory in the investigated energy range from Erel= 0 to 1 eV where Erel is the relative energy between the ensembles of electrons and ions in the interaction region (for the definition of Erel see section III).
In a number of consecutive measurements different bare ions (D+,He2+,C6+,N7+,Ne10+,Si14+,Ar18+) [3, 4, 5, 6] have been investigated at several facilities. The measured rate coefficients have been in accordance with a theoretical approach to RR by Bethe and Salpeter [7] for relative energies 0.01 eV. The experiments were limited by counting statistics to an energy range of only a few eV. Recently an experiment with Cl17+-ions revealed excellent agreement between the measured rate and RR theory for relative energies from 0.01 eV up to 47 eV [8]. However, in all of these measurements strong deviations of the experimental findings from the theoretical predictions were found at very low electron-ion relative energies ( meV) . The measured rate coefficient typically shows an additional increase towards lower energies resulting in a so-called rate enhancement factor at = 0 eV of 1.6 (He2+) to 10 (Ar18+) for bare ions (no enhancement observed with D+) and up to 365 for a multicharged multi-electron system like Au25+ [9]. It should be noted that in contrast to the RR cross section which diverges at = 0 eV the measured rate coefficient obtains a finite value due to the experimental electron and ion velocity spreads (see section 3).
After the first observation of the so called enhancement phenomenon in an experiment with U28+-ions at the GSI in Darmstadt in 1989 [10] and a later experimental confirmation of that same result [11] this effect has been observed over and over again in many different experiments at different facilities. Whereas the very high rate enhancement factors of multicharged complex ions like Au25+, Au50+, Pb53+ and U28+ could be partly traced back to the presence of additional recombination channels such as dielectronic recombination (DR) [9, 12, 13, 14] or polarization recombination (PIR) [15] the origin of the observed discrepancies between experiment and theory for bare ions is still unknown. Theoretical calculations applying (MD) computer simulations [16, 17] have been performed by Spreiter et al. [18]. Taking into account the experimental conditions at the heavy ion storage ring TSR in Heidelberg they found an increase of the local electron density around the ion. This could possibly lead to a higher number of recombination processes but to date the recombination of the electrons with the ion is not included in their theoretical description.
For the clarification of this phenomenon dependences of the enhancement on external experimental parameters have been studied at different storage rings. Variations of the electron density [6, 8] within a total range from about 106 cm-3 up to almost 1010 cm-3 showed little effect on the enhancement. The dependence of the total recombination rate followed the dependence on the mean transverse electron energy spread [19] as expected for RR alone. A systematic study of the ion charge-state dependence of the excess rate coefficient for a number of bare ions [3] yielded roughly a Z2.8 scaling for atomic numbers 1 Z 14. The first external parameter observed to influence the enhancement has been the magnetic field strength in the interaction region of electrons and ions [9]. The experimental results show a clear increase of the recombination rate maximum of Au25+ ions at with increasing magnetic field strength. Recently this dependence has also been observed in experiments with lithium-like F6+ and bare C6+-ions at the TSR heavy ion storage ring in Heidelberg [20, 21].
In the present measurement, which was carried out at the Experimental Storage Ring of the GSI in Darmstadt, we extended the range of investigated bare ions to the high-Z ion Bi83+. It was the first experiment of this kind with such a heavy bare ion providing information on RR in addition to studies of the radiative electron capture in ion-atom collisions using x-ray spectroscopy [22, 23, 24]. Beside a comparison of measured absolute rate coefficients with calculated RR rates for relative energies from = 0 eV to 125 eV dependences of the recombination rate on the electron density and the magnetic guiding field of the electron beam in the cooler have been investigated.
The present paper is organized as follows. After a short description of the theoretical approaches, the experimental setup and the evaluation of recombination rates are described. The experimental results are presented and compared with RR calculations.
II Theory
In order to describe RR theoretically Kramers developed a semi-classical theory already in 1923 [25]. A full quantum mechanical treatment was performed by Stobbe seven years later [26]. In 1957, Bethe and Salpeter [7] derived an approximate formula for the RR cross section that is identical to Kramers result
| (3) |
The capture of an electron by a bare ion produces a hydrogenic state with principal quantum number . In this case E0 is the binding energy of the ground state electron in the hydrogenic ion or atom and Ecm is the kinetic energy in the electron-ion center-of-mass frame. The total cross section for this process is obtained by summing up the contributions of all accessible Rydberg states:
| (4) |
where is the maximum principal quantum number that can
contribute. This number is generally limited by experimental
conditions. The approach of Bethe and Salpeter clearly shows the
typical features of RR cross sections: the divergence at zero
electron energy and a monotonic decrease for increasing electron
energy. However, as a semi-classical approximation
Eq. 3 is only valid in the limit of high quantum
numbers and low electron energies, i.e. for and
. Since the quantum mechanical treatment of
Stobbe involves the rather tedious evaluation of hydrogenic dipole
matrix elements one often applies correction factors
, the so called Gaunt factors, to Eq. 3
to account for deviations from the correct quantum result at low
and high . The use of Gaunt factors is convenient
because they are either tabulated [27] or given in an
easy parametrization [28]. We here apply tabulated
[29] values using
| (6) | |||||
where is the nuclear charge of the ion and = 13.6 eV is the ground-state energy of the hydrogen atom. Eq. 6 is exact for bare ions at zero relative energy and does not deviate by more than about 5% from the quantum mechanically correct hydrogenic result at the highest energies considered in this paper.
For high-Z ions and high relative energies the non-relativistic dipole approximation presented above is not valid. In general an exact relativistic calculation with the inclusion of higher multipoles is required [30]. Nevertheless experiments investigating the Radiative Electron Capture (REC) into the K-shell of high-Z ions have shown that the experimental results are in very good overall agreement with the non-relativistic dipole approximation [31] as long as is below the electron rest energy . Because of this observed accordance Eq. 6 is used for the calculations presented in this paper.
III Basic relations
In the experiment cross sections at very
low center-of-mass energies are not accessible due to the
finite velocity spread of the colliding particles. In the present
work the lowest limit of is at about
110-5 eV. The measured quantity is a rate coefficient
which theoretically results from a convolution of the
cross section with the velocity distribution function
| (7) |
In our experiment the ion velocity distribution is negligibly narrow compared to that of the electrons due to the cooling of the ion beam to a relative momentum spread below 10-4 and due to the large mass difference between electrons and ions. Therefore the distribution function is dominated by the electron velocity distribution. Considering the axial symmetry of the merged beams experiment two velocity coordinates are sufficient to describe the distribution: the velocity component in beam direction and the velocity component perpendicular to the beam. The appropriate velocity (or energy) spreads are characterized by two corresponding temperatures and . Due to the acceleration of the electrons these temperatures are quite different ( ) resulting in a highly anisotropic velocity distribution which is therefore often called ‘flattened’. Its mathematical form is given by
| (9) | |||||
with being the average longitudinal center-of-mass velocity
| (10) |
where and are the longitudinal velocity components of the electron and ion beam in the laboratory frame, respectively. The relative energy of electrons and ions is
| (11) |
with
| (12) |
Under cooling conditions is zero and, hence, also Erel is zero then. For comparisons of experimental results with theory the cross sections resulting from Eq. 6 have to be convoluted with the experimental velocity distribution according to Eq. 7 using the experimental temperatures and .
IV Experiment
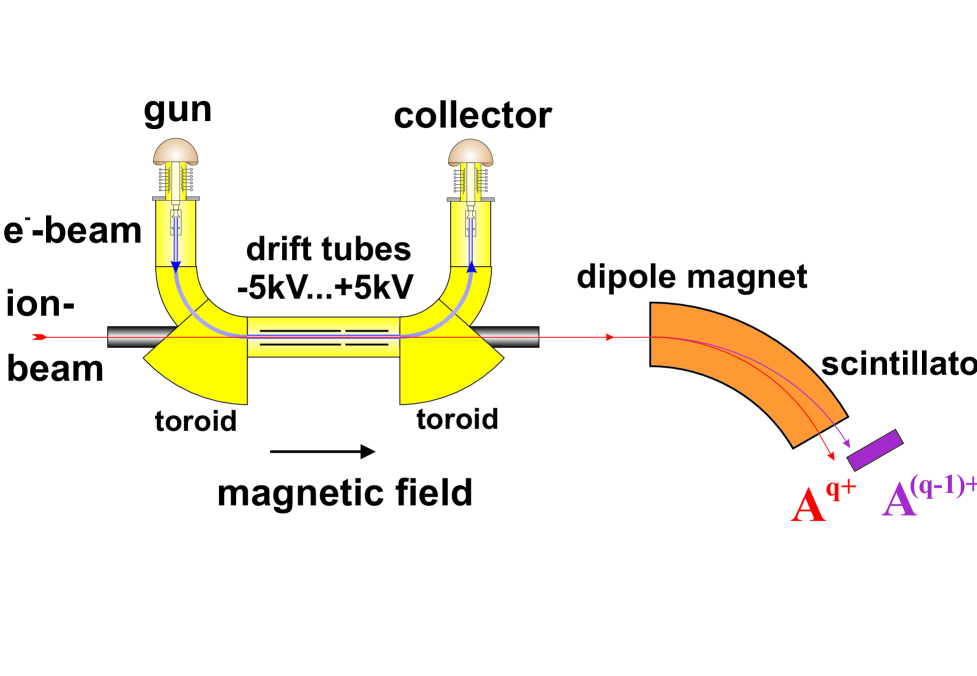
The measurements have been performed at the Experimental Storage Ring (ESR) of the Gesellschaft für Schwerionenforschung (GSI) in Darmstadt [32]. 295.3 MeV/u Bi83+-ions supplied by the GSI linear accelerator UNILAC and the heavy ion synchrotron SIS were injected into the ESR. Only one shot of ions was sufficient to provide an ion current of typically 400-800 A at the beginning of a measurement. In the storage ring the circulating Bi83+ ions were merged with the magnetically guided electron beam of the electron cooler with an electron energy of 162 kV (Fig. 1). Before starting a measurement, the ion beam was cooled for several seconds until the beam profiles reached their equilibrium widths. During the measurement the electron energy was stepped through a preset range of values different from the cooling energy thus introducing non-zero mean relative velocities between ions and electrons. After each voltage step a cooling interval was inserted. The whole scheme of energy scan measurements was realized by applying voltages from -5 kV to 5 kV to the two drift tubes surrounding the electron and the ion beam in the interaction region. The voltages were supplied by a system of sixteen individual power supplies controlled by very fast high-voltage switches. This instrument has specially been constructed for the recombination experiments [33]. Only 2 ms are needed by this device to switch to and set a certain voltage with a relative precision of 10-4. The repetition rate of voltage settings with this precision is limited to 40 per second.
Recombined Bi82+ ions were counted as a function of the electron energy on a scintillator detector located behind the first dipole magnet downstream of the electron cooler. The dipole magnet bends the circulating Bi83+ ion beam onto a closed orbit and separates the recombined Bi82+ ions from that orbit. In between two measurement steps of 40 ms duration, the electron energy was always set to the cooling energy for 20 ms in order to maintain good ion beam quality. The experimental data stream was continuously collected and stored after each ms. The time-resolved measurements allowed us to observe and eliminate drag force effects from the data in a detailed off-line analysis. Such effects are a result of the cooling force exerted by the electrons on the ion beam which can lead to a time-dependent shift of the ion velocity towards the electron velocity. The friction forces are particularly effective at relative energies close to zero.
The kinetic energy of the electrons is defined by the cathode voltage , the drift tube voltage and the space charge potential in the interaction region. Assuming coaxial beams it is calculated as
| (13) | |||||
| (14) |
where is the classical electron radius. The quantities = 10 cm and = 2.54 cm are the radii of the drift tube and the electron beam, respectively. The ion beam diameter is only of the order of a millimeter and, hence, the electron energy distribution probed by the ions is rather flat across the ion beam. In the present experiment we performed measurements with different electron currents which produced space charge potentials ranging from 17.2 V to 51.7 V.
The space charge corrected electron energy and the ion
energy are used to calculate the relative energy of
electrons and ions in the center-of-mass frame. A relativistic
transformation yields
| (16) | |||||
| (17) | |||||
| (18) |
where is the angle between the electron and the ion beam directions. According to Eq. 16 the minimum relative energy = 0 eV cannot be reached if an angle 0 is present. Therefore the alignment of the beams was optimized before the recombination experiments in order to achieve = 0 mrad with an uncertainty of 0.1 mrad.
The counting rate measured at the scanning energy is given by
| (20) |
with denoting the electron-ion recombination rate coefficient, the detection efficiency of the scintillator detector which is very close to unity, m the nominal length of the interaction zone, (E) the electron density at energy , the number of stored ions, m the ring circumference and the relativistic Lorentz factor for the transformation between the c. m. and the laboratory frames. denotes the measured background rate due to collisions with residual gas molecules. In order to extract an absolute rate coefficient from the experimental data the background has to be subtracted by taking into account the counting rate
| (21) |
at a reference energy . Combining Eqs. 20 and 21 at has to be calculated from
| (23) | |||||
Because of RR one always has a non-zero recombination rate coefficient at the reference point. Usually is chosen such that practically equals zero, but in general one has to re-add the rate which has been neglected by subtracting ) from . In the present experiment the reference rate has been measured at the maximum accessible scan energy = 125 eV. According to RR theory the rate coefficient at this energy is = 3.6 10-10 cm3 s-1. This correction leads to a modification of the measured rate coefficient at = 0 eV by only 0.2 .
Electron and ion beams are merged and demerged by bending the electron beam in a toroidal magnetic field with a bending radius of 120 cm. An electron beam of 2.54 cm radius is still overlapping the ion beam for 25 cm before and after the straight overlap section of 250 cm. The merging and demerging sections therefore contribute to the measured counting rate. As one can see in the left panel of Fig. 2 where the calculated potential distribution of the drift tubes for an applied voltage of 1 V is plotted against the position inside the cooler (along the central axis of ion and electron beam) the influence of the voltage applied to the drift tubes is restricted to the straight overlap section of the cooler. Thus, the electron energy in the toroidal sections is always the same independent of the drift tube potential. This results in a constant contribution to the measured counting rate which is considered by the background subtraction procedure described above.
The right panel of Fig. 2 shows the distribution
of angles between electron trajectories and the ion beam
direction along the geometrical cooler axis. The electrons
strictly following the magnetic field lines, the non-zero angles
result from the measured transverse magnetic guiding field
components in this section. The measurement was restricted to a
length of 2.26 m (90 % of the straight overlap section) fully
including the drift tube area. As one can see increases
rapidly at the edges of the measured range. Using steerer magnets
the electron beam can be shifted to a position minimizing the
influence of angular deviations. Both the distributions of the
electric potential and angle (Fig. 2) can be
combined via Eq. 16 into a distribution of
relative energies along the ion beam axis. Fig. 3
shows the relative energies along the straight overlap section for
different voltages applied to the drift tubes. Obviously the
desired relative energies are only realized along a certain
fraction of the whole interaction length which, in addition,
depends on the energy. The measured rate coefficient at a given
relative energy always contains contributions from
other relative energies according to:
| (24) |
with being the relative energy at the position inside the cooler. According to Eq. 24 the correct rate coefficient can be obtained by a deconvolution which is performed iteratively. In a first iteration step the measured rate coefficient is inserted as in Eq. 24. Then the difference between the obtained result and the measured rate is subtracted from . In a next step the new is likewise inserted in Eq. 24 and the difference is calculated. The procedure is carried on until in a step k the relative difference is below at all measured energies. This is the case after only a few iteration steps.
Although the relative statistical errors of the results presented below amount to less than in the rate coefficient maximum, the systematic uncertainty in the absolute recombination rate coefficient has been estimated to be .
V Experimental results and discussion
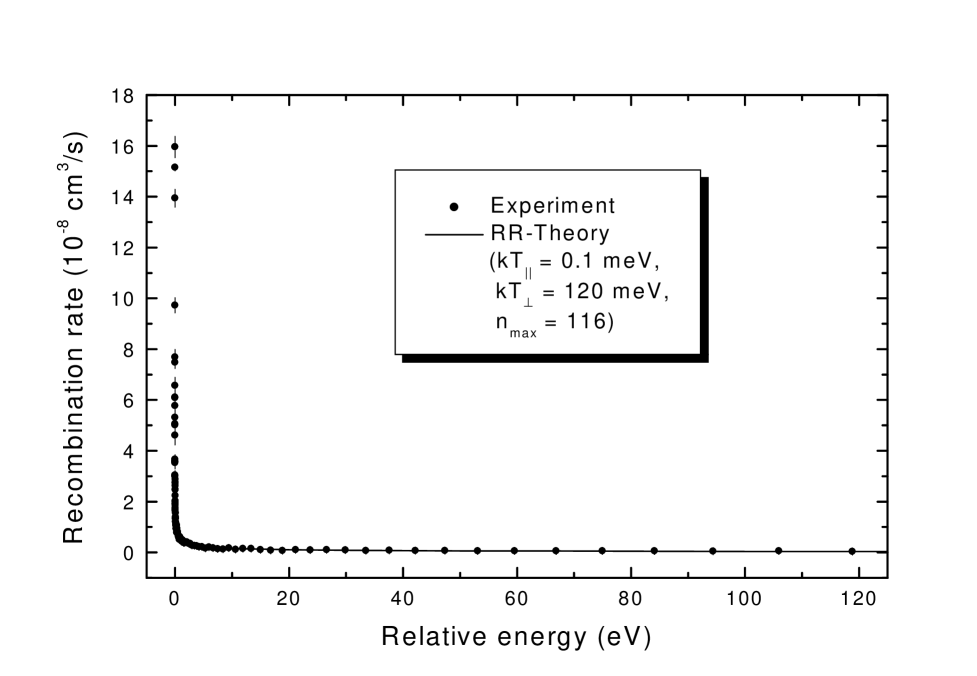
In Fig. 4 the measured absolute rate coefficient of Bi83+ with free electrons is plotted versus the relative energy from 0 eV to 125 eV. The spectrum shows the typical shape of an RR rate coefficient with a maximum at = 0 eV and a continuous decrease for increasing relative energies.
For the comparison of the measured rates with RR theory one has to know the maximum principal quantum number and the temperatures and (see sections II and III). For the temperature characterizing the transverse motion of the electrons one has to assume = 120 meV which corresponds to the cathode temperature. For the longitudinal electron motion = 0.1 meV is inferred from the analysis of resonance shapes in dielectronic recombination (DR) measurements with lithium-like Bi80+-ions performed during the same beamtime. is determined by field ionization in the dipole magnet which separates the parent beam and the recombined ions. A first approximation of this value is the field ionization limit , which is obtained from
| (25) |
[34], where q is the charge state of the ion and the motional electric field seen by the ions with velocity in the transverse magnetic field of the charge-analyzing magnet. In this context one also has to account for the possibility that high Rydberg states can decay to states below , provided the ions have some time between the recombination process and the arrival at the ionizing electric field . Therefore, a realistic estimate for the cut-off is given by
| (26) |
where denotes the maximum principal quantum number of
Rydberg states which decay before the recombined ions arrive at
the analyzing magnet and thus are saved from field ionization. A
crude estimate of based on a number of assumptions on
the population and the decay of excited states is obtained from a
numerical solution of the following equation [35]
| (28) | |||||
| (29) |
The time of flight of the ions between the recombination act and the arrival at the analyzing magnet influences the survival probability of ions in high Rydberg states. In the derivation of Eq. 28 cascade processes were neglected. They should not be of large influence considering the decay rates in undisturbed hydrogenic systems. A more problematic assumption underlying Eq. 28 is that the fields seen by the ions during their flight time are considered not to change the nl distribution of states as it results from the initial population by radiative recombination. Changes of decay rates by Stark mixing in the fields are not accounted for but probably deserve further attention. Also, instead of a sharp cut-off at or a distribution of field ionization probabilities [34] around or , respectively, would be more realistic, however, these cannot easily be calculated without further assumptions. In addition, the influences of the experimental conditions providing electric fields via contributions inside the interaction area, the toroidal fields and the dipole correction magnets after the cooler have to be considered.
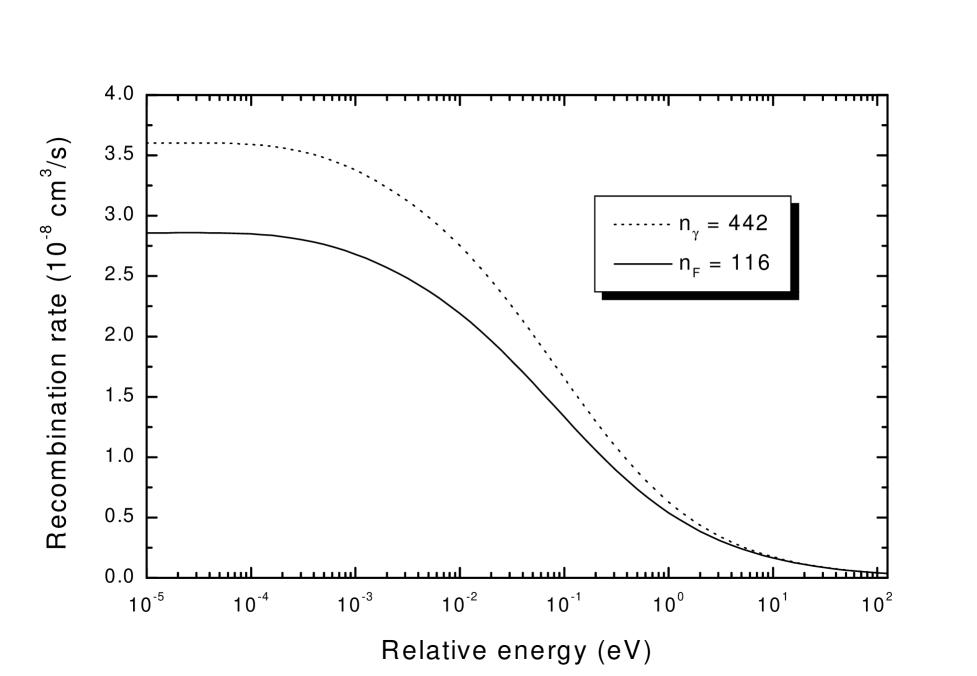
In the present experiment and have been calculated to be 116 and 442, respectively. A comparison of both RR rate curves resulting from Eqs. 6 and 7 is shown in Fig. 5. As expected the theoretical rate for = = 442 (dotted line) lies above the curve with = = 116 (solid line). Comparing the experimental and the theoretical rate coefficients the curve calculated for = 116 shows a very good agreement with the experimental data for relative energies from = 15 meV to 125 eV (Fig. 4). However, one can also obtain a good agreement for = 442 if one assumes a higher transverse electron temperature = 250 meV. Such an interdependency between and has also been found in experiments with bare Cl17+ and C6+-ions at the TSR in Heidelberg [8, 21]. Because of the impossibility to accurately obtain both parameters from a fit of the theoretical RR curve to the experimental spectrum and in view of the rather crude estimation of we deliberately choose = = 116 throughout the rest of this paper. This implies a reasonable choice for the transverse temperature of = 120 meV, which is in accordance with the cathode temperature. That same temperature is also suggested by the accompanying DR measurements with Bi80+-ions. In this discussion the longitudinal temperature does not play a role since it has very little influence on the RR rate coefficient.
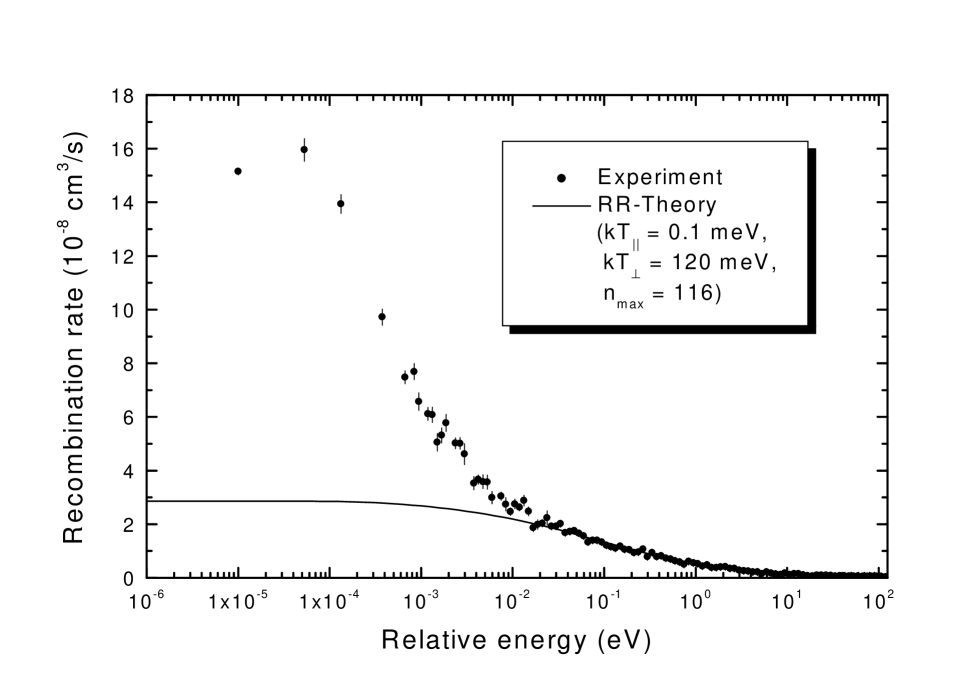
In Fig. 6 the experimental and theoretical data of Fig. 4 are shown again using a logarithmic energy scale in order to focus on a comparison at very low energies. The shape of the experimental spectrum with an additional increase towards low energies 15 meV is typical for low energy recombination measurements. At Erel = 0 eV we obtained a maximum rate coefficient of 1.5 cm3 s-1 exceeding the theoretical rate of 2.9 cm3 s-1 by a factor of 5.2. As already mentioned in the introduction this rate enhancement phenomenon has also been observed at other facilities, however, the Bi83+-experiment provides the first quantitative determination of the rate enhancement factor for a bare ion with . As mentioned above, for the light ions He2+, N7+, Ne10+ and Si14+ a dependence of = was found in Stockholm [3]. This scaling cannot be directly confirmed for Bi83+. In order to obtain an agreement with the -scaling the measured rate coefficient for Bi83+ would have to be more than 400 % higher which is beyond the experimental uncertainty. However, one has to be careful with comparing results from different facilities since the experimental conditions vary drastically. Apart from the extremely high electron energy of 162 keV and the extremely high nuclear charge in the present case the influence of the experimental parameters , and the magnetic guiding field B has to be considered. It is known from previous experiments with F6+ and C6+ ions [21] that the excess rate scales as and as . Using the present temperatures in comparison with the Stockholm conditions the excess rate found in the present experiment has to be multiplied by a factor of approximately 3.2 in order to normalize it to the Stockholm conditions. This removes part of the discrepancy mentioned above. The magnetic field dependence of found in similar experiments with other ions would, however, reduce the normalization factor again. To little is known to date about the exact numbers for such a normalization.
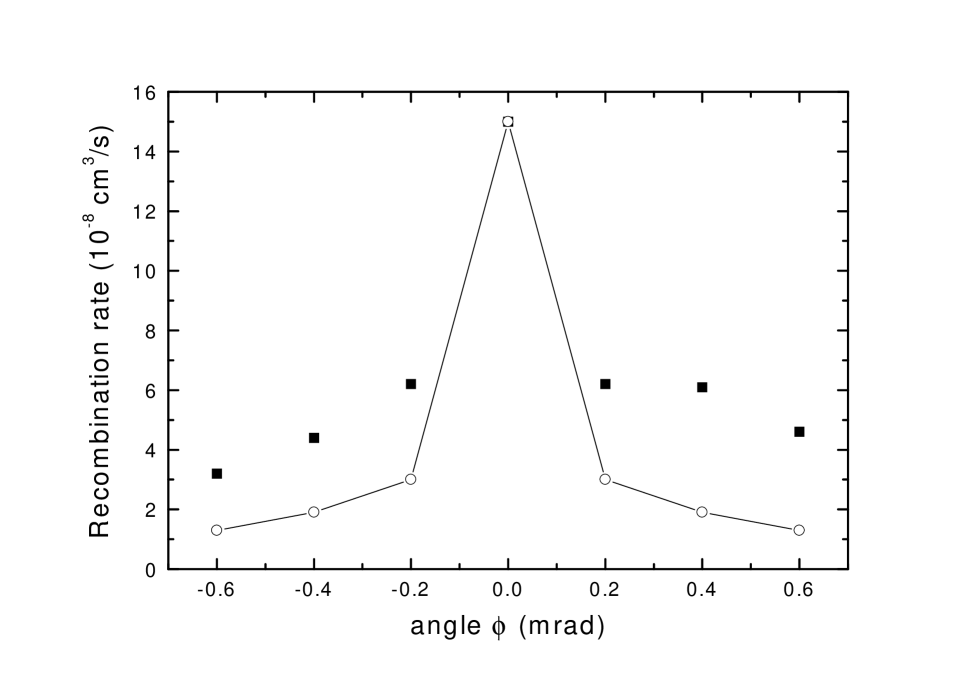
As mentioned already in section IV the alignment of the beams has been carefully optimized before starting the recombination experiment. During the measurement we artificially introduced an angle between the beams in order to check the obtained settings. This was implemented by superimposing in the interaction region a defined transverse (horizontal) magnetic field in addition to the unchanged longitudinal field along the ion beam direction. Fig. 7 shows the maximum recombination rate at = 0 eV for different angles from -0.6 mrad to 0.6 mrad in the horizontal plane. At = 0 mrad the maximum recombination rate is obtained. The open circles in Fig. 7 denote the expected rates for the selected angles. They have been determined by taking recombination rates from the ( = 0 mrad)-spectrum at the minimum relative energies possible at the corresponding angle (see eq. 16). The squares in Fig. 7 represent the measured rate coefficients at the minimum relative energies accessible at the selected angles. All of them are lying above the expected value. Such a behaviour is already known from other experiments at the ESR. Obviously the ion beam reacts on the introduction of the transverse magnetic field component, Lorentz and cooling forces appear to minimize the effect of the change. In any case, the distribution shows a rather symmetric progression with the maximum at = 0 mrad confirming the accurate adjustment of the cooler.
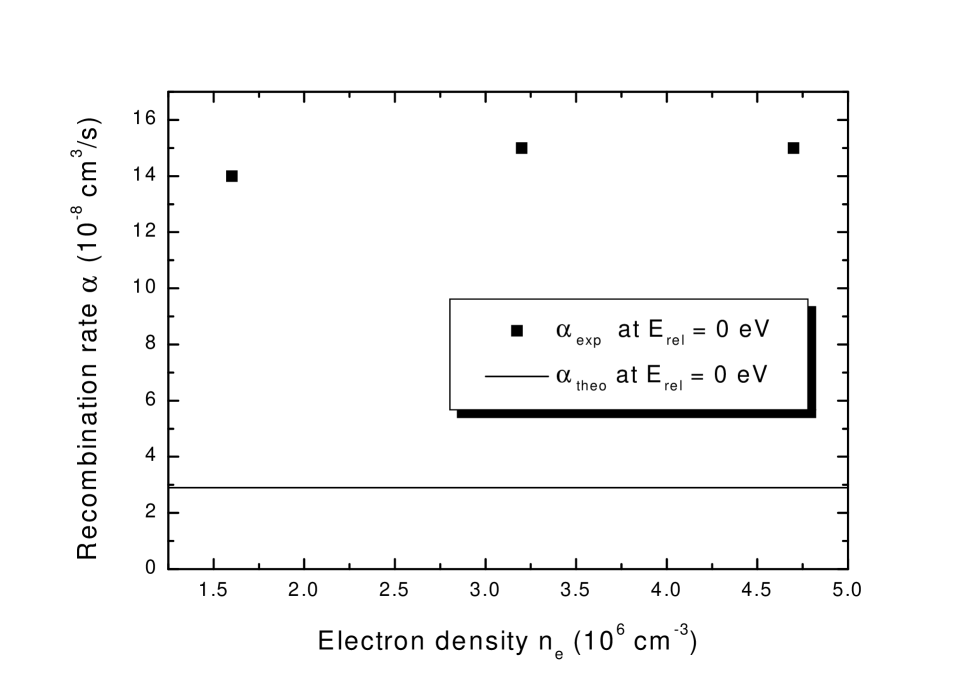
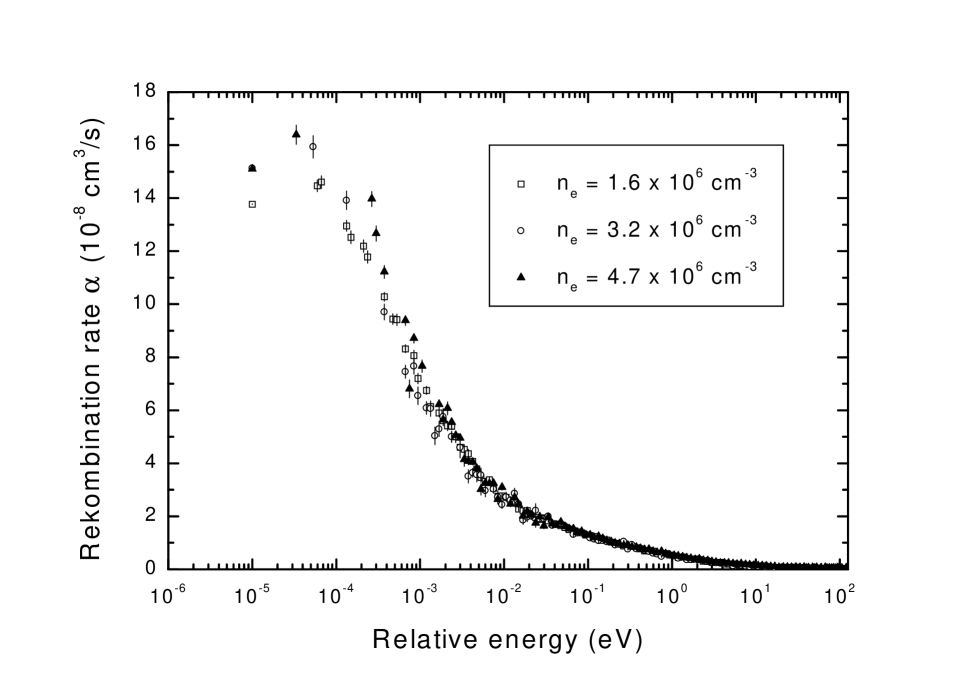
In order to investigate the influence of the electron density on the recombination rate we performed recombination measurements for three different densities = 1.6106 cm-3, cm-3 and 4.7106 cm-3. In Fig. 8 the rate coefficient at Erel= 0 eV is plotted against the electron density ne. The solid line represents the theoretical rate coefficient calculated with kT||= 0.1 meV and kT⟂= 120 meV at Erel= 0 eV. There is a small difference between the maximum rate coefficient cm3 s-1 for = 1.6106 cm-3 and cm3 s-1 for the two higher densities but this deviation is within the experimental uncertainty. In addition Fig. 9 shows that the shape of the spectra is equal for all densities indicating identical temperatures in the measurements. Therefore it can be concluded that there is no significant influence of the electron density on the recombination rate. This observation is in accordance with findings at the CRYRING [6], the TSR [8] and the GSI single pass electron target [9]. The lack of any density dependence rules out TBR (eq. 2) as a possible mechanism leading to enhanced recombination rates at low energies. With a significant contribution of TBR to the observed rates one would expect an increase of the recombination rate with increasing electron density in contrast to all experimental observations. In the context of storage rings TBR has been discussed in some detail by Pajek und Schuch [37]. They found theoretically that TBR effectively populates high Rydberg states of the ion where the electrons are very weakly bound. As mentioned above such ions are reionized in the dipole magnet and therefore do not contribute to the measured recombination rate.
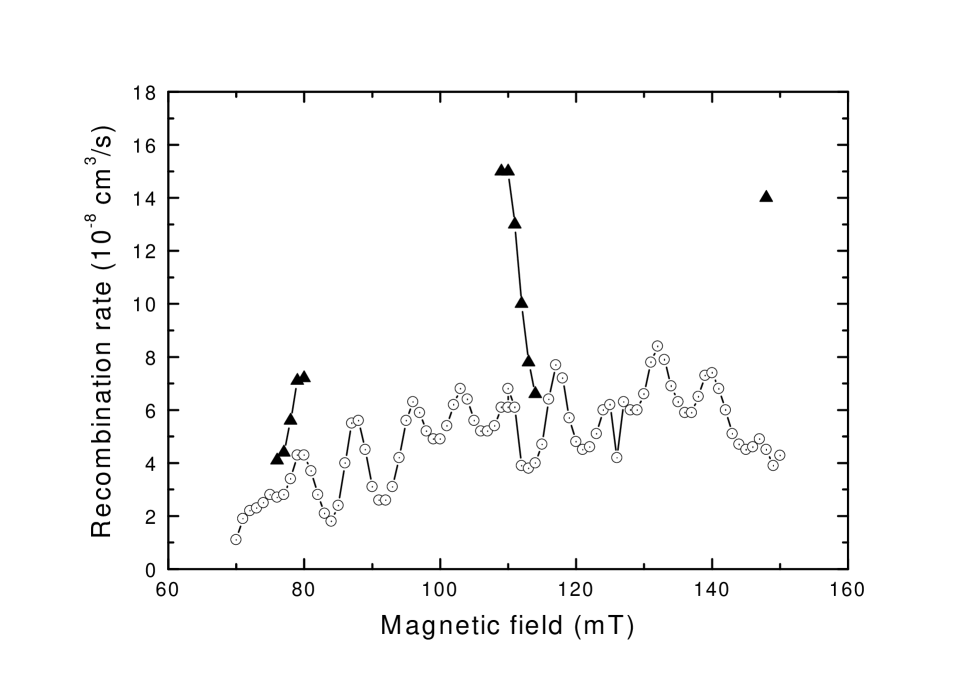
In a next stage of our experiment we also varied the magnetic guiding field of the electron beam between 70 mT and 150 mT in steps of 1 mT. The standard field strength used for the previous measurements was 110 mT. In contrast to the more careful adjustments of the magnetic field at the TSR [20, 21] which were accompanied by measurements of the cooling force and the beam profiles in order to preserve the beam quality no other cooler setting beside the magnetic field was changed at the ESR. This procedure was motivated by an earlier experiment of the ESR cooler group [38] showing an oscillation of the recombination rate for 310 MeV/u U92+-ions induced by small changes of the magnetic field. The new results obtained for 295.3 MeV/u Bi83+ are shown in Fig. 10 where the maximum recombination rate at = 0 eV is plotted versus the magnetic field strength . Since the measurement of a complete recombination spectrum is very time-consuming only the recombination rate at cooling has been recorded for each magnetic field setting. For these data points a background subtraction and corrections due to the potential and angle distributions inside the cooler were not possible. Therefore these recombination rates represented by the open circles in Fig. 10 can only display the qualitative dependance on the magnetic field.
A complementary method of determining the recombination rate at cooling can be applied by analyzing the lifetime of the Bi83+ beam in the ring. Fitting an exponential curve to the decay of the ion current stored in the ring with being the ion current at the beginning and with representing the offset of the ion current transformer, one can extract the storage lifetime of the Bi83+-beam in the ring. Assuming that electron-ion recombination in the cooler is the only loss mechanism for stored ions one can calculate the corresponding recombination rate . is the effective electron density which is times the ratio of the interaction length and the ring circumference. Fig. 11 shows a comparison of the rates obtained with the different methods resulting in a good agreement of the data.
A Fourier analysis of the experimental data reveals an ”oscillation period” of the recombination rate of 7.6 mT. Recent measurements of the ESR cooler group with 300 MeV/u Kr36+,35+-ions show that this value can be influenced by a variation of the magnetic fields of the toroids (see Fig. 1) moving the electron beam into and out of the interaction area . Due to the Lorentz force the electrons are moving on helical trajectories through the cooler. It has been observed by the ESR group that the ”oscillation period” corresponds to a change of the magnetic field that allows the electrons one more turn inside the toroid. In order to find an explanation for these observations one has to take a precise look at the measured recombination spectra. Therefore we performed complete recombination measurements with all corrections for 12 selected field strengths. The results are represented by the full triangles in Fig. 10. The maximum recombination rates at = 0 eV obtained in these measurements show the same progression as the open circles.
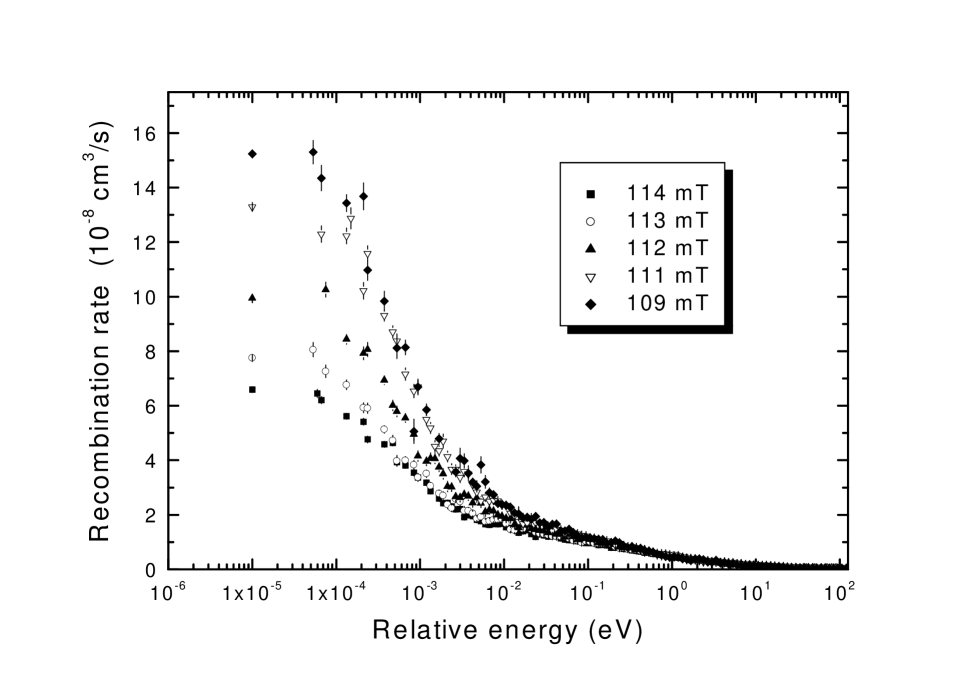
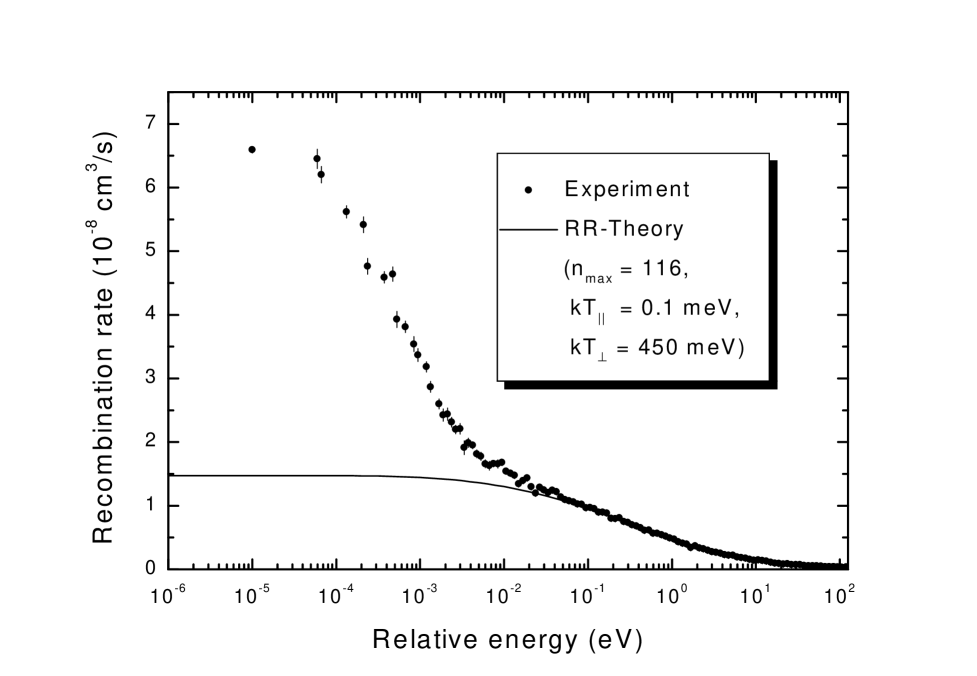
In Fig. 12 recombination spectra for different magnetic fields between B = 109 mT and 114 mT are shown in the energy range from = 0 eV to 125 eV. For 1 eV the measured rate coefficients are practically identical. At energies below 1 eV the recombination rates show significant differences depending on the magnetic field strength. However, the rate enhancement is always there which one can see in Fig. 13 where the recombination rate for the oscillation minimum at B = 114 mT is compared with RR theory. In order to describe the experimental data a transverse electron temperature of = 450 meV was applied which is nearly a factor of 3 higher than the one obtained by a fit of RR theory to the experimental data at the standard magnetic field strength of B = 110 mT. From the measured rate at = 0 eV of = 6.6 cm3 s-1 and the theoretical value at = 0 eV of = 1.5 cm3 s-1 one calculates a rate enhancement factor = 4.4.
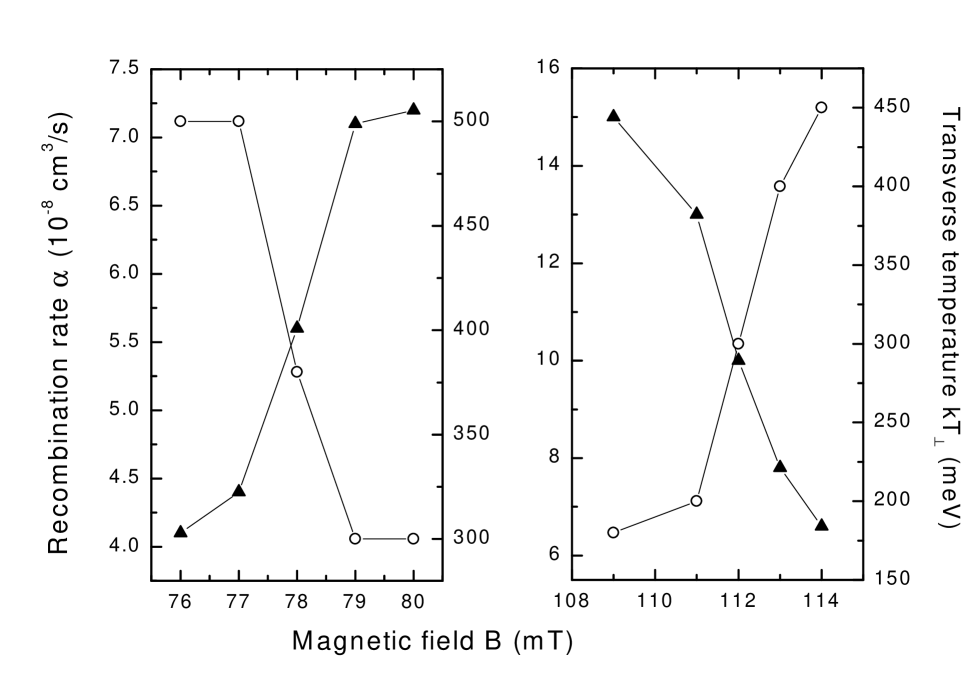
Analysing all the complete recombination spectra measured for different magnetic fields a connection between the maximum rate coefficient at = 0 eV and the adapted transverse electron temperature becomes obvious which is documented in Fig. 14. In the left panel representing the data for magnetic fields between 76 mT and 80 mT the measured maximum rate coefficient at = 0 eV (full triangles) increases with increasing magnetic field whereas the transverse electron temperature (open circles) adapted to the corresponding recombination spectra decreases in this region. In the right spectrum monitoring the same data for magnetic fields between 109 mT and 114 mT one can see a decrease of the maximum rate coefficient at = 0 eV accompanied by an increase of the transverse electron temperature . Therefore there seems to be a relationship between the rate coefficient and the transverse electron temperature (or: the electron beam quality) which would easily explain the periodic reductions of the recombination rate at = 0 eV. Nevertheless it should be pointed out that this interpretation does not explain the observed general enhancement of the rate coefficient at = 0 eV. A further theoretical analysis should especially focus on the possible influence of the electron energy since in experiments with lithium-like 97.2 MeV/u Bi80+ ions (corresponding to 53.31 kV cooling voltage instead of 162 kV for 295.3 MeV/u) during the same beam-time the oscillations did not appear. This is in agreement with the results obtained at the ESR and other storage rings in experiments at low ion energies. There, oscillations of the recombination rate at cooling have not been observed.
VI Conclusions
The recombination of bare Bi83+ ions with free electrons has been studied at the GSI Experimental Storage Ring (ESR) in Darmstadt. Within the experimental uncertainty we found very good agreement between the measured rate coefficient and the theory for radiative recombination (RR) for energies from Erel = 15 meV to 125 eV. At very low center-of-mass energies between ions and electrons, however, the measured rate exceeds the theoretical predictions by a factor of 5.2. This first rate enhancement result for a bare ion with very much greater than 18 does not follow a dependence of the enhancement found in an experiment with the light ions He2+, N7+, Ne10+ and Si14+. Therefore additional measurements in the mid-Z range are necessary in order to obtain more information about the influence of on the recombination enhancement phenomenon. The increase of the electron density in the interaction area from = 1.6106 cm-3 to 4.7106 cm-3 appears to have no significant effect on the recombination rate. A variation of the magnetic field from 70 mT to 150 mT revealed a strong dependence of the recombination rate at low energies on this parameter. The observed oscillations of the maximum recombination rate at = 0 eV confirmed previous observations with bare U92+ ions. Comparing the recombination spectra with RR theory one finds strong variations of the transverse electron temperature connected to the oscillations of the recombination rate. In future experimental and theoretical studies this relationship has to be investigated in more detail. Finally, we want to emphasize, that the observed recombination rate enhancement significantly reduces the lifetime of ion beams in storage rings during the electron cooling procedure. At the present ion energies, recombination in the cooler by far dominates over all factors influencing the beam lifetime. The recombination rate enhancement hence reduces the beam lifetime by approximately a factor 5 as compared to the assumption of pure RR.
VII Acknowlegments
The Giessen group gratefully acknowledges support for this work through contract GI MÜL S with the Gesellschaft für Schwerionenforschung (GSI), Darmstadt, and by a research grant (number 06 GI 848) from the Bundesministerium für Bildung und Forschung (BMBF), Bonn.
REFERENCES
- [1] W.G. Graham et al. (eds), Recombination of Atomic Ions, NATO ASI Series B: Physics vol 296 (Plenum Press,New York, 1992)
- [2] L.H. Andersen, J. Bolko, P. Kvistgaard, Phys. Rev. Lett. 64, 729 (1990)
- [3] H. Gao, R. Schuch, W. Zong, E. Justiniano, D.R. DeWitt, H. Lebius, W. Spies, J.Phys. B 30, L499 (1997)
- [4] A. Wolf, J. Berger, M. Bock, D. Habs, B. Hochadel, G. Kilgus, G. Neureither, U. Schramm, D. Schwalm, W. Szmola, A. Müller, M. Wagner, R. Schuch Physics of Highly Charged Ions Supplement to Z. Phys. D 21 (Springer, Berlin, Heidelberg, NewYork,1991) p 69
- [5] O. Uwira, A. Müller, W. Spies, A. Frank, J. Linkemann, C. Brandau, T. Cramer, C. Kozhuharov, J. Klabunde, N. Angert, P.H. Mokler, R. Becker, M. Kleinod, N.R. Badnell, Hyp. Interact. 108, 167 (1997)
- [6] H. Gao, S. Asp, C. Biedermann, D.R. DeWitt, R. Schuch, W. Zong, H. Danared, Hyp. Interact. 99, 301 (1996)
- [7] H. Bethe, E. Salpeter, Quantum Mechanics of One- and Two-Electron Systems (Springer, Berlin, Heidelberg, New York, 1957)
- [8] A. Hoffknecht, Rekombination hochgeladener Ionen mit freien Elektronen bei niedrigen Energien, Dissertation Universität Gießen Shaker Verlag, Aachen, ISBN 3-8265-6580-0 (1999)
- [9] A. Hoffknecht, O. Uwira, S. Schennach, A. Frank, J. Haselbauer, W. Spies, N. Angert, P.H. Mokler, R. Becker, M. Kleinod, S. Schippers, A. Müller, J.Phys. B 31, 2415 (1998)
- [10] A. Müller, S. Schennach, M. Wagner, J. Haselbauer, O. Uwira, W. Spies, E. Jennewein, R. Becker, M. Kleinod, U. Pröbstel, N. Angert, J. Klabunde, P.H. Mokler, P. Spädtke, B. Wolf, Phys. Scr. T 37, 62 (1991)
- [11] D.M. Mitnik, M.S. Pindzola, F. Robicheaux, N.R. Badnell, O. Uwira, A. Müller, A. Frank, J. Linkemann, W. Spies, N. Angert, P.H. Mokler, R. Becker, M. Kleinod, S. Ricz, L. Empacher, Phys. Rev. A 57, 4365 (1998)
- [12] O. Uwira, A. Müller, J. Linkemann, T. Bartsch, C. Brandau, M. Schmitt, A. Wolf, D. Schwalm, R. Schuch, W. Zong, H. Lebius, W.G. Graham, J. Doerfert, D.W. Savin, Hyp. Interact. 108, 149 (1997)
- [13] S. Baird, J. Bosser, C. Carli, M. Chanel, P. Levvre, R. Ley, R. Maccaferri, S. Maury, I. Meshkov, D. Möhl, G. Molinari, F. Motsch, H. Mulder, G. Tranquille, F. Varenne, Phys. Lett. B 361, 184 (1995)
- [14] G.F. Gribakin, A.A. Gribakina, V.V. Flambaum, Aust. J. Phys., 52, 443 (1999)
- [15] L. Bureyeva, V. Lisitsa, J. Phys. B, 31, 1477 (1998)
- [16] G. Zwicknagel, C. Toepffer and P.G. Reinhard, Laser Part. Beams 13, 311 (1995)
- [17] G. Zwicknagel, C. Toepffer and P.G. Reinhard, Hyp. Interact. 99, 285 (1996)
- [18] Q. Spreiter and C. Toepffer, Hyp. Interact. 114, 245 (1998)
- [19] U. Schramm, T. Schüßler, D. Habs, D. Schwalm, A. Wolf, Hyp. Interact. 99, 309 (1996)
- [20] A. Hoffknecht, T. Bartsch, S. Schippers, A. Müller, N. Eklöw, P. Glans, M. Beutelspacher, M. Grieser, G. Gwinner, A.A. Saghiri, A. Wolf, Phys. Scr. T 80, 298 (1999)
-
[21]
G. Gwinner, T. Bartsch, M. Beutelspacher, N. Eklöw, P. Glans,
A. Hoffknecht, E. Lindroth, A. Müller, A.A. Saghiri,
S. Schippers, M. Schmitt, D. Schwalm, G. Wissler, A. Wolf,XXII ICPEAC, July 21-27,1999, Sendai, Japan, Book of Abstracts,
edited by Y. Itikawa et al., p. 381, and
G. Gwinner, A. Hoffknecht, T. Bartsch, M. Beutelspacher, N. Eklöw, P. Glans, M. Grieser, E. Lindroth, A. Müller, A.A. Saghiri, S. Schippers, D. Schwalm, G. Wissler, A. Wolf, submitted to Phys. Rev. Letters - [22] H.F. Beyer, G. Menzel, D. Liesen, A. Gallus, F. Bosch, R. Deslattes, P. Indelicato, T. Stöhlker, O. Klepper, R. Moshammer, F. Nolden, H. Eickhoff, B. Franzke, M. Steck, Z. Phys. D 35, 136 (1995)
- [23] T. Stöhlker, P.H. Mokler, C. Kozhuharov and A. Warczak, Comments At. Mol. Phys. 33, 271 (1997)
- [24] T. Stöhlker, T. Ludziejewski, F. Bosch, R.W. Dunford, C. Kozhuharov, P.H. Mokler, H.F. Beyer, O. Brinzanescu, B. Franzke, J. Eichler, A. Griegal, S. Hagmann, A. Ichihara, A. Krämer, J. Lekki, D. Liesen, F. Nolden, H. Reich, P. Rymuza, Z. Stachura, M. Steck, P. Swiat and A. Warczak, Phys. Rev. Lett. 82, 3232 (1999)
- [25] H.A. Kramers, Philos. Mag. 46, 836 (1923)
- [26] M. Stobbe, Ann. Physik 7, 661 (1930)
- [27] K. Omidvar, P.T. Guimares, Astrophys. J. Suppl. 73, 555 (1990)
- [28] M.R. Flannery in Atomic, Molecular & Optical Physics Handbook (American Institute of Physics, New York,1996) p 625
- [29] L.H. Andersen, J. Bolko, Phys. Rev A 42, 1184 (1990)
- [30] A. Ichihara, T. Shirai and J. Eichler, Phys. Rev. A 54, 4954 (1996)
- [31] T. Stöhlker, C. Kozhuharov, P.H. Mokler, A. Warczak, F. Bosch, H. Geissel, R. Moshammer, C. Scheidenberger, J. Eichler, A. Ichihara, T. Shirai, Z. Stachura, P. Rymuza, Phys. Rev. A 51, 2098 (1995)
- [32] B. Franzke, Nucl. Instr. Meth. B 24/25, 18 (1987)
- [33] H. Horneff, Patentschrift DE 4040164 C2, Deutsches Patentamt (1992)
- [34] A. Müller, D.S. Belić, B.D. DePaola, N. Djurić, G.H. Dunn, D.W. Mueller, C. Timmer, Phys. Rev A 36, 599 (1987)
- [35] A. Wolf, report MPI H-V15-1992 (MPI für Kernphysik, Heidelberg) (1992) p. 75; A. Müller and A. Wolf, Hyp. Interact. 107, 233 (1997)
- [36] S. Schennach, A. Müller, O. Uwira, J. Haselbauer, W. Spies, A. Frank, M. Wagner, R. Becker, M. Kleinod, E. Jennewein, N. Angert, P.H. Mokler, N.R. Badnell, M.S. Pindzola, Z. Phys. D 30, 291 (1994)
- [37] M. Pajek, R. Schuch, Hyp. Interact. 108, 185 (1997)
- [38] M. Steck,Workshop on New Projects for Atomic Physics at GSI, Darmstadt, 21.-22. July 1997