Auroral field-aligned currents by incoherent scatter plasma line observations in the E region
Zusammenfassung
The aim of the Swedish-Japanese EISCAT campaign in February 1999 was to measure the ionospheric parameters inside and outside the auroral arcs. The ion line radar experiment was optimised to probe the E-region and lower F-region with as high a speed as possible. Two extra channels were used for the plasma line measurements covering the same altitudes, giving a total of 3 upshifted and 3 downshifted frequency bands of 25 kHz each. For most of the time the shifted channels were tuned to 3 (both), 4 (up), 5.5 (down) and 6.5 (both) MHz.
Weak plasma line signals are seen whenever the radar is probing the diffuse aurora, corresponding to the relatively low plasma frequencies. At times when auroral arcs pass the radar beam, significant increases in return power are observed. Many cases with simultaneously up and down shifted plasma lines are recorded. In spite of the rather active environment, the highly optimised measurements enable investigation of the properties of the plasma lines.
A modified theoretical incoherent scatter spectrum is used to explain the measurements. The general trend is an upgoing field-aligned suprathermal current in the diffuse aurora, There are also cases with strong suprathermal currents indicated by large differences in signal strength between up- and downshifted plasma lines. A full fit of the combined ion and plasma line spektra resulted in suprathermal electron distributions consistent with models.
, , , 1National Institute of Polar Research, 1-9-10 Kaga, Itabashi-ku,
Tokyo 173-8515, Japan.
2Swedish Institute of Space Physics, Box 812, S-981 28 Kiruna, Sweden.
1 Introduction
The incoherent scatter spectrum consists mainly of two lines, the widely used and relatively strong ion line and the very weak easily forgotten broadband electron line. There is also another line present, the plasma line, due to scattering from high frequency electron waves, namely Langmuir waves. From the downgoing and upgoing Langmuir waves, two plasma lines can be detected by the radar. The frequency shift from the transmitted signal is the frequency of the scattered Langmuir wave plus the Doppler shift caused by electron drift. Plasma lines can be used to measure the electron drift and hence the line-of-sight electric current. The problem in ion line analysis with the uncertainty of the radar constant can be solved by the plasma line frequency determination and when that is done the speed of measurement can be significantly increased by including the plasma line in the ion line analysis. However, since the frequency of the plasma lines is not known beforehand, and the frequency is varying with height, it is difficult to measure them with enough resolution.
There have been a number of reports on plasma line measurements and their interpretation. Most of them have discussed the frequency shift from the transmitted pulse and the scattering has mainly been from the F-region peak, e.g. Showen (1979), Kofman et al. (1993) and Nilsson et al. (1996a). The latter two showed also that the simple formula for the Langmuir wave frequency,
| (1) |
where is the plasma frequency, the wave number the electron gyro frequency, the electron Debye length and the angle between the scattering wave and the magnetic field, is valid to within a few kHz and thus enough to set the radar system constant. To be able to deduce any electron drifts, or current, out of the positions of the lines these authors also show that Eq. (1) is not sufficient, and it is necessary to carry out more accurate calculations. Hagfors and Lehtinen (1981) had also to go to further expansions in deriving the ambient electron temperature from the plasma lines. The fact that so many reports deal with the F region peak is due to the altitude profile shape of the plasma line frequency, which according to Eq. (1) will also show a peak around that height. The measurements can thus be made relatively easily using rather coarse height resolution but good frequency resolution and only detect the peak frequency. Measurements using the same strategy, but at other heights, have been made with a chirped radar by matching the plasma line frequency height gradient and the transmitter frequency gradient (Birkmayer and Hagfors, 1986; Isham and Hagfors, 1993). This technique allows determination of the Langmuir frequency with very high frequency resolution, but do not use the radar optimally, since the chirped pulse cannot be used for anything else than plasma line measurements.
The enhancement of the plasma lines, which occurs in the presence of suprathermal electron fluxes (Perkins and Salpeter, 1965), either photoelectrons or secondaries from auroral electrons, has been investigated by Nilsson et al. (1996b), where they also calculate predictions of plasma line strength for different incoherent scatter radars and altitudes. They also show that the power of the plasma line is rather structured with respect to ambient electron density, depending on fine structure in the suprathermal distributions due to excitations of different atmospheric constituents.
Incoherent scatter plasma lines in aurora are more difficult to measure since the variations in the plasma parameters are strong with large time and spatial gradients. Reports of auroral plasma lines in the aurora are also more rare, and most of them are based on too coarse time resolution (Wickwar, 1978; Kofman and Wickwar, 1980; Oran et al., 1981; Valladares et al., 1988), with resolutions ranging from 30 seconds up to 20 minutes. The enhancements over the thermal level were high, but consistent with what could be expected of model calculations of suprathermal electron flux. They also tried to calculate currents and electron temperature from the frequency shifts of the plasma lines but with very large error bars. Kirkwood et al. (1995) used the EISCAT radar and the filter bank technique and recorded much higher intensities of the plasma lines, since they got down to resolutions of 10 seconds, and showed also that the plasma-turbulence model proposed by Mishin and Schlegel (1994) was not consistent with the data, but could be explained by reasonable fluxes of suprathermal electrons.
In this paper we present data obtained with the high resolution alternating code technique (Lehtinen and Häggström, 1987), as was also done for F-region plasma lines by Guio et al. (1996), with even higher intensities due to the time resolutions of 5 seconds. An interesting, but at the time of the experiment not realisable at EISCAT, technique would have been the type of coded long pulses used by Sulzer and Fejer (1994) for HF-induced plasma lines. From relative strengths between up- and downshifted lines we detect a general trend of upgoing field-aligned currents in the diffuse aurora carried by the suprathermal electrons. We propose a generalisation of the theoretical incoherent scatter spectrum, to include multiple shifted electron distributions, and in one example we do a full 7-parameter fit of the incoherent scatter spectrum, including the enhanced plasma lines assuming Maxwellian secondary electrons, resulting in the first radar measurement of its flux and a current carried by the thermal electrons.
2 Experiment
The measurements we present were collected by the 930 MHz EISCAT UHF incoherent scatter radar, with its transmitter located at Ramfjordmoen in Norway (69.6 °N, 19.2 °E, L=6.2). The signals scattered from the ionosphere were received at stations in Kiruna, Sweden and Sodankylä, Finland as well as at the transmitting site. General descriptions of the radar facility are given by Folkestad et al. (1983) and Baron (1984). Local magnetic midnight at Ramfjordmoen is at about 2130 UT. The aim, in the Swedish-Japanese EISCAT campaign in February 1999, was to measure the ionospheric parameters inside and outside the auroral arcs.
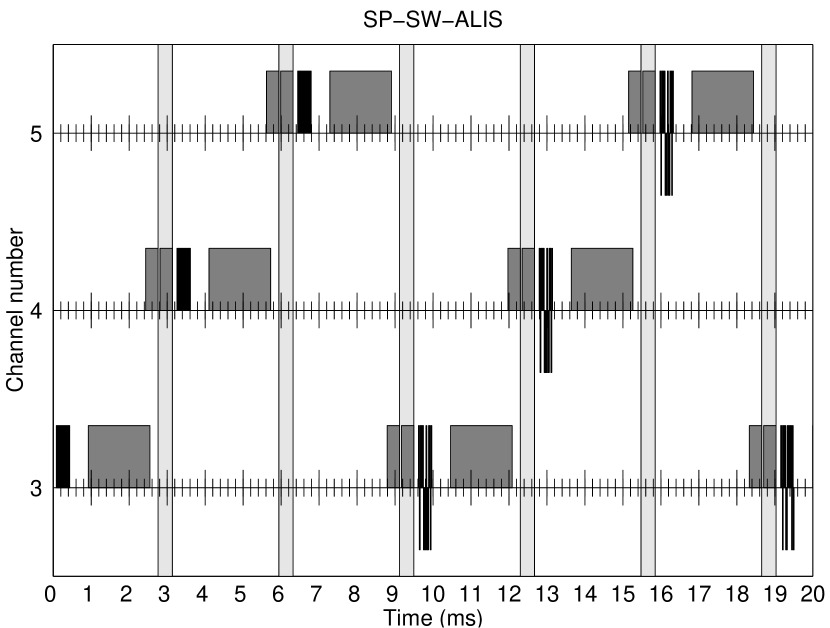
For this a 3 channel ion line alternating code (Lehtinen and Häggström, 1987) experiment, optimised to probe the E-region and lower F-region with as high a speed as possible, was developed. The 16 bit strong condition alternating code with bitlengths of 22 s was used, giving 3 km range resolution, and with a sample rate of 11 s the range separations in consecutive spectra were 1.65 km. Fig. 1 shows the transmission/reception scheme of the first 20 ms of the radar cycle. The whole alternating code sequence takes about 0.3 s to complete. During this period the incoherent scatter autocorrelation functions (ACF) at the probed heights should not change significantly for the alternating codes to work. In order to keep this as short as possible, the short pulses, normally used for zerolag estimation, were dropped and instead a pseudo zero lag, obtained from decoding the power profiles of the different codes in the alternating code sequence, was used. Fig. 2 shows the range-lag ambiguity function for this lag centred around 0 s in the lag direction, but the main contribution to the signal comes from around 7 s. The more normal lag centred at 22 s is also shown for comparison. The range extents are rather similar but the power is, of course, considerably lower for the pseudo zero lag. Nevertheless, this is taken care of in the analysis and this lag is rather important in events with high temperatures giving broad ion line spectra or narrow ACFs. The transmitting frequencies were chosen to give maximum radiated power for a given high voltage setting.
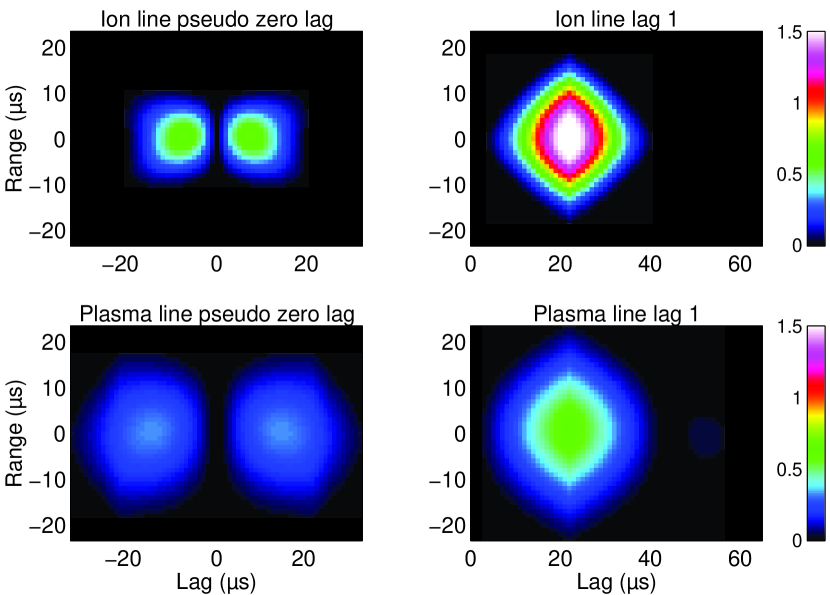
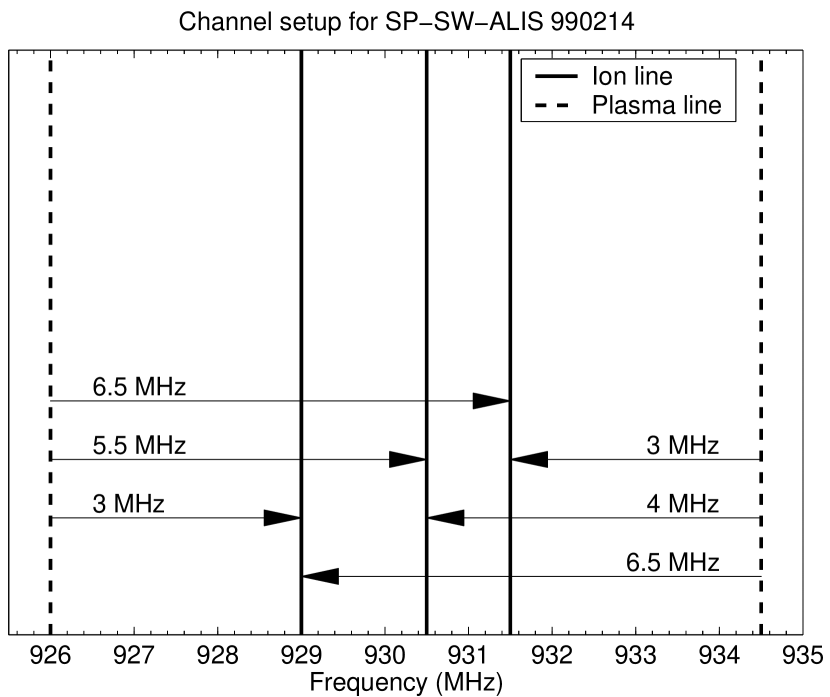
The monostatic plasma line part of the experiment used two channels covering the same ranges as the ion line but with 3.3 km range separations between the spectra. The frequency setup for the experiment, illustrated in Fig. 3, gives the possibility for 3 upshifted and 3 downshifted bands. For 3 MHz and 6.5 MHz frequency shifts, both the up- and downshifted plasma lines were measured. In addition there was a 4 MHz upshifted and a 5.5 MHz downshifted band. The width of these bands should have been set to match the bit length of the codes used, 50 kHz, but unfortunately this was not the case and 25 kHz wide filters were erroneously used. This gave naturally less signal throughput, and in Fig. 2 the corresponding range/lag ambiguity functions for the plasma line channels are included for the first two lags. The decoding still works, giving just slightly increased unwanted ambiguities, but above all the pseudo zero lag is moved out to a larger lag value. This fact, with one exception, almost ruled out the possibilities to measure plasma line spectra because, as will be shown here later, they are likely to be rather wide, due to large time and height gradients of the plasma parameters. This lead the analysis to use mainly the undecoded zerolag, which after integration over the different codes, almost resembles the shape of a 352 s (16s) long pulse.
The experiment contained a large number of antenna pointings in order to follow the auroral arcs, but as this day was cloudy over northern Scandinavia the transmitting antenna was kept fixed along the local geomagnetic field line. The remote sites, receiving only ion lines, were monitoring the same pulses as the transmitting site, and were used to measure the drifts in the F-region, to derive the electric field. Thus, these antennas intersected the transmitted beam at the F-region altitude giving the best signal, for this day mostly at 170 km.
3 Measurements
3.1 Ion line
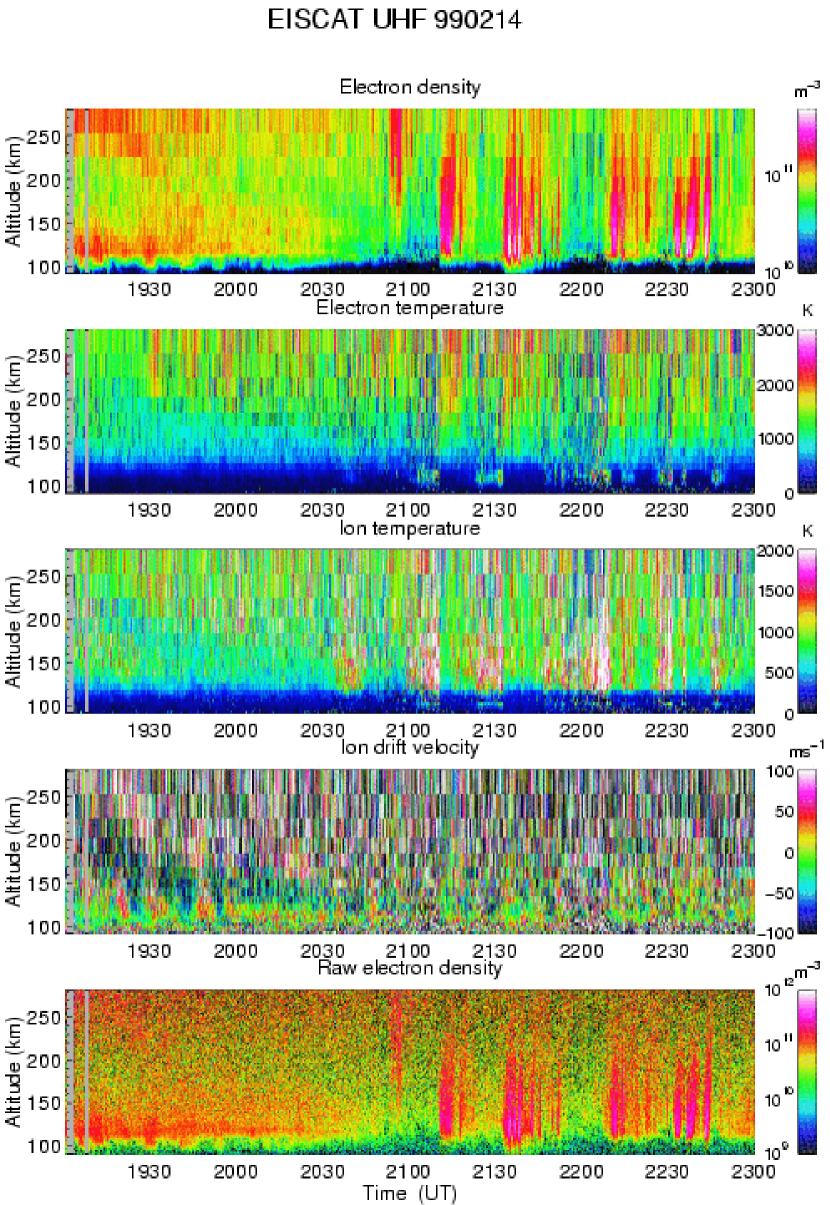
The experiment started at 1900 UT on 14 February 1999 and continued until 2300 UT. Fig. 4 shows an overview of the parameters deduced from the ion line measurements, which were analysed using the on-line integration time, 5 seconds, in order to be compared to the plasma line data. The analysis was done using the GUISDAP package (Lehtinen and Huuskonen, 1996), but a correction of 45% of the radar system constant used in the package had to be invoked to fit the plasma line measurements according to Eq. (1). This short integration time was possible due to the highly optimised mode used, with all the transmitter power concentrated to the E-region. In range, some integration was done, so that at lower heights 2 range gates were added together and with increasing height the number of gates added together increases to 15 in the F-region.
There is a rather strong E-region from the start, but no real arcs, and we interpret this as diffuse aurora. The peak electron density shows some variation, but as time goes the E-region ionisation decreases until 2050 UT, where it is almost gone. The density peak during this time was at around 120 km altitude and the lower edge of the E-region at 110 km, but at times the ionisation reaches down to 100 km. At 2050 UT and onwards until 2240 UT the ionosphere above Tromsø became more active and several auroral arcs passed the beam. Around some of the arcs there are short-lived enhancements of electric field, seen as F-region ion and E-region electron temperature increases. In the last 10 minutes of the experiment the arc activity disappeared and again there was diffuse aurora. From the field aligned ion drifts it is evident that there is a rather strong wave activity in the diffuse aurora until 2050 UT, while it is not so clear in the continuation of the experiment. The last panel with the inferred electron density from the pseudo zero lag shows the same features as the fitted density panel but with highest possible resolution since no height integration is made.
3.2 Plasma line
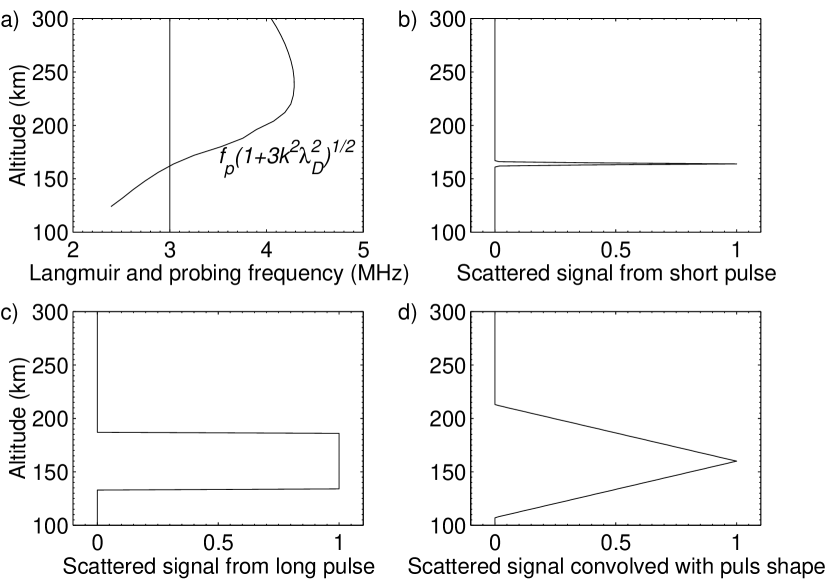
Since the analysis of the plasma lines was forced to handle the undecoded zerolags of the alternating codes, it was necessary to analyse their profile shape. Fig. 5 shows how this analysis was performed. From the fitted parameters of the ion line, electron density and temperature, a profile of the approximate Langmuir frequency can be calculated using Eq. (1). When probing at fixed frequency, there will be scattered signal only from heights where the probing and Langmuir frequencies match each other. The effect of the undecoded zerolag is similar to the one where a normal long pulse is used, but with a lower signal strength. So, the profile shape will be a square pulse centred on the corresponding altitude, since no gating is performed. Because the signal strengths are rather weak compared to the system temperature, there is a great deal of noise in the profile shape. To be able to extract the altitude and signal power, a fitting procedure need to be performed. For this a continous function and a good first guess is needed and the measured plasma line profile was convolved with the pulse shape to have a triangular shape and also showing a peak close to the matching height.
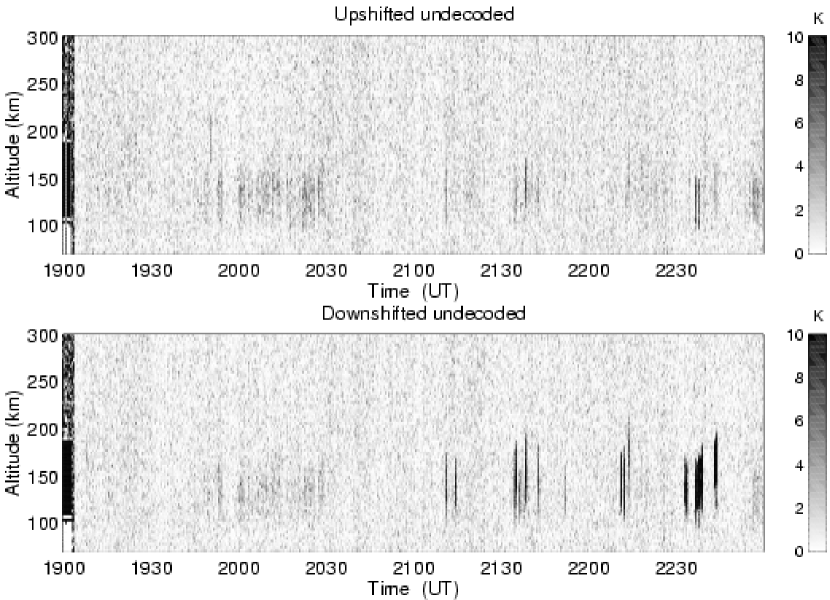
The plasma line part of the experiment is overviewed in Fig. 6. The signal strengths shown should be compared with the UHF system temperature of about 90 K. At first glance there is almost nothing in the upshifted part, but a more careful look shows weak signals between 1940 and 2030 UT and after 2250 UT, corresponding to the occurrence of diffuse aurora. Similar echoes can also be seen in the downshifted channel, and are due to plasma lines at 3 MHz offset from the transmitted frequencies, according to the ion line measurements. In the downshifted part after 2100 UT, frequent events of rather strong signals in phase with auroral arcs pass the beam. Most of these are from the 5.5 MHz shift, but some of them also are due to plasma lines at 6.5 MHz. Such events are less frequent and for most of them there are also signals in the upshifted part.
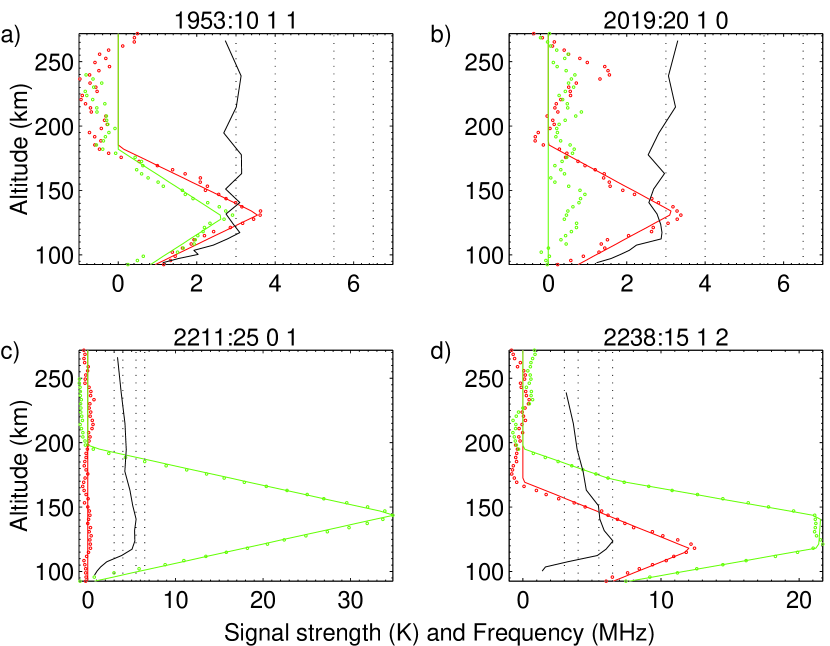
Due to the fact that the same channel is used for several frequencies, there can be several altitudes that fulfill the matching condition between Langmuir and probing frequency. This complicates the analysis somewhat, and there have to be several fits with different numbers of triangles superposed on each other. Some examples of this analysis are shown in Fig. 7, from only one plasma line to several both up- and downshifted lines. Using a lower limit of 2 K signal power, the total number of 5 second integration events with enhanced plasma lines for this evening was 256, and a total of 468 plasma line echoes were detected, divided into 220 on 3 MHz, 19 on 4 MHz, 157 on 5.5 MHz and 72 on 6.5 MHz.
4 Theory
In order to relate the plasma line measurements to physical quantities it is necessary to investigate the spectrum of the incoherent scatter process. The Nyquist theorem approach, derived in a long series of papers by Dougherty and Farley (1960, 1963), Farley et al. (1961), Farley (1966) and finally Swartz and Farley (1979), arrives at
| (2) |
where
| (3) |
| (4) |
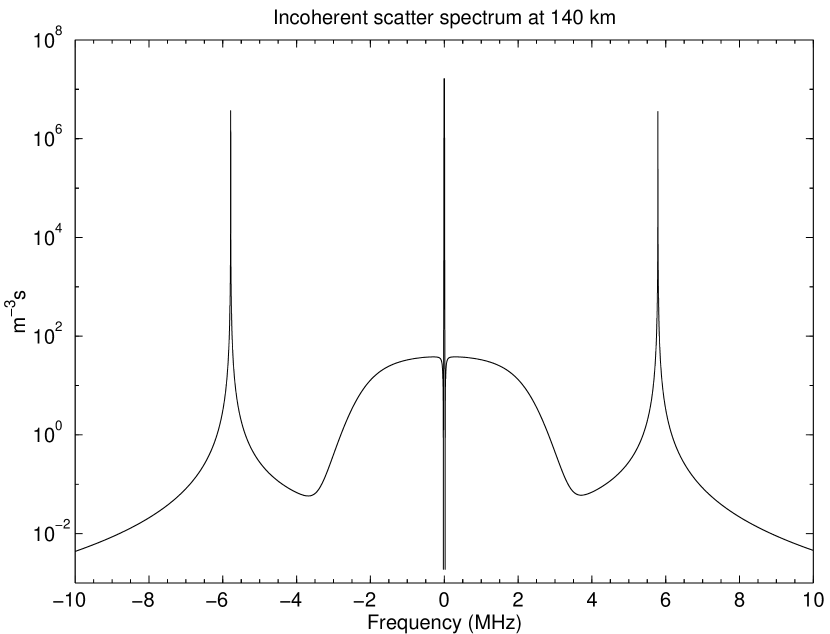
and the index stands for electrons and for the different ion species. and are the densities, the classical electron radius, the bulk velocity, the charge, the electron charge and the temperature. The complex normalised admittance function, , contains most of the physics with the plasma dispersion function and have as main arguments the collision frequency and magnetic field. The same result was also reached by Rosenbluth and Rostoker (1962), using the dressed particle approach. In Fig. 8 there is an example of the spectrum, showing clearly the strong ion line around zero offset frequency and the rather weak plasma lines at rather large offsets. The plasma lines become enhanced by a photo electron or auroral electron produced suprathermal electron distribution, and in order to simulate what this extra distribution does to the spectrum a modification to the formula has to be made. First, a rewriting of Eq. (2) following Swartz (1978) has to be performed in order to separate the electron and ion contributions to the spectrum:
| (5) |
where
| (6) |
is the frequency shift, , is the dielectricity and is the Boltzmann constant. Here, a normalisation of the spectrum has also been performed, so that the zero lag of the corresponding ACF is the raw electron density and the vector velocity is replaced by the line-of-sight velocity. Using a treatment in analogy to the ion contribution, it is now possible to rewrite the spectrum to support a number of Maxwellian electron distributions as
| (7) |
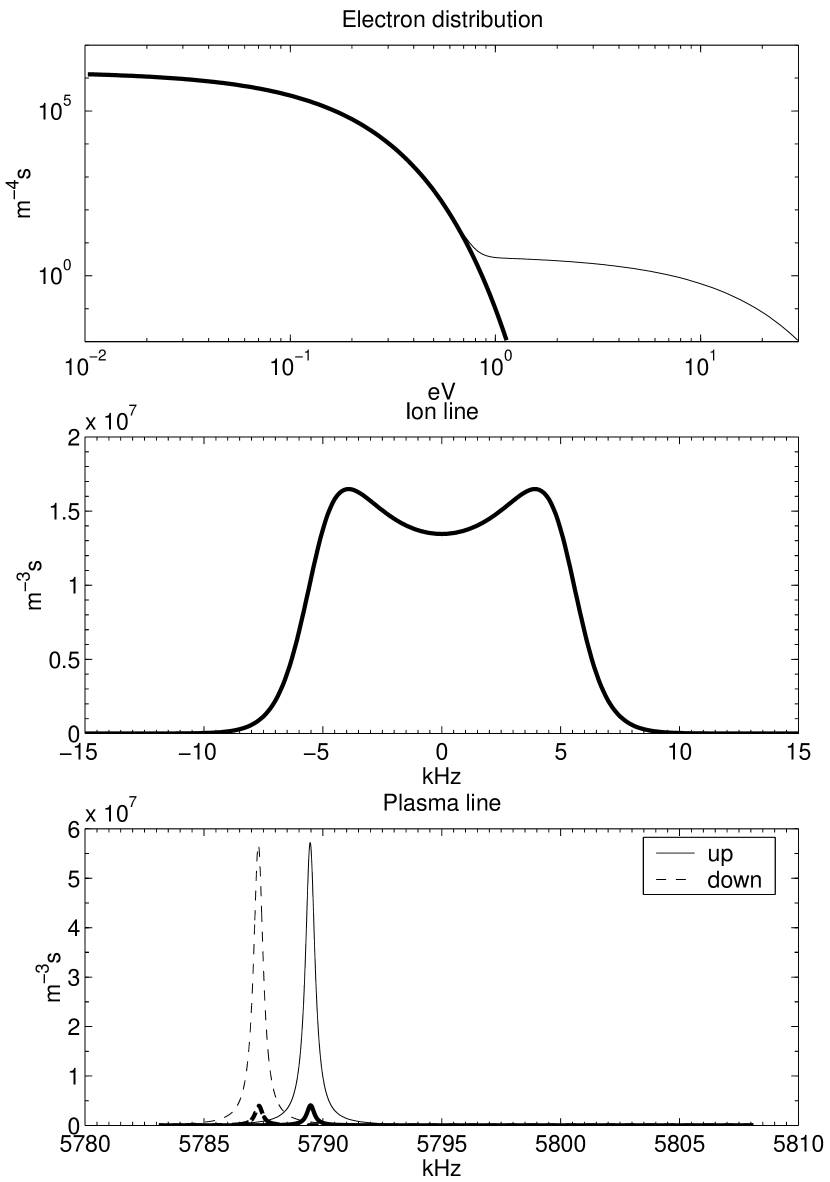
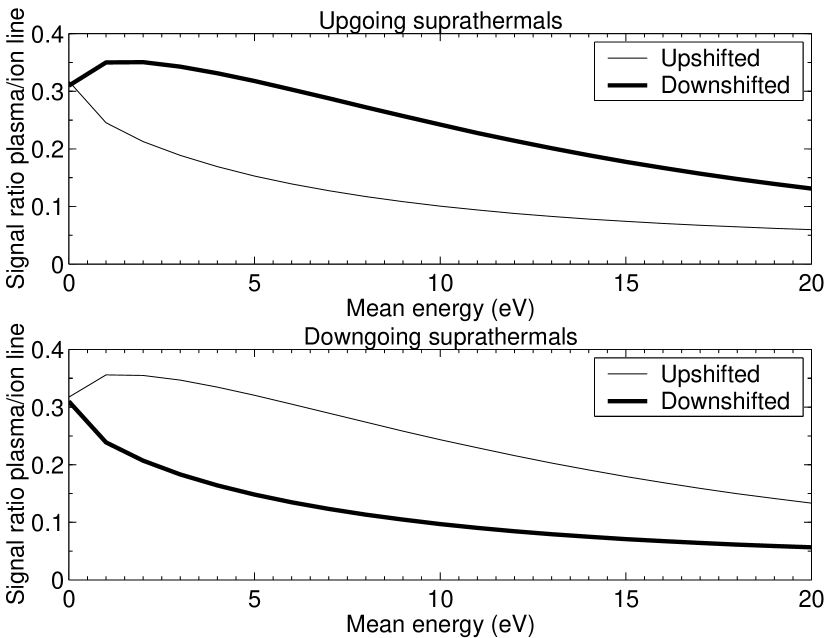
In Fig. 9 the effect on the plasma lines of a suprathermal distribution with a reasonable density of m-3 and width of 10 eV is shown, being lower than the ionisation energy for most ions. The plasma lines grow considerable and the integrated power over the bandwidth used in the experiment becomes comparable to the power of the ion line. It may also be noted that there is no effect at all seen in the ion line. Perkins and Salpeter (1965) have shown similar calculations, but when their method was based on large expansions to allow non-Maxwellian distributions one can here more directly superpose a few Maxwellian distributions to explain the measurements and even make fits of the spectra taken to get estimates of the suprathermal distributions, which is of great importance in auroral measurements. A consequence of Eq. (7) is that it is also possible to derive the spectrum assuming currents carried by the suprathermal distribution, since it allows different drift velocities on the various distributions. Indeed, Fig. 10, shows differential strengths on the two plasma lines, with upgoing electrons enhancing mainly the downshifted line and downgoing ones the upshifted line.
5 Discussion
Plasma line measurements in the active auroral ionosphere are not an easy task, due to the large variations in the ionospheric parameters. The Langmuir frequencies are largely dependent on the ambient electron density, making the line move considerably as the density changes, which it does on time scales of seconds. Moreover, the density height gradient makes the lines very broad when measured over a specific height interval, and at times even broader than the receiver band. A chirped radar would solve only a part of the problem at the cost of transmitter power. These complications make it hard to draw any conclusions on the power in the lines, as one does not know for sure the scattering volume or the time duration of the scattering. Bearing this in mind and to at least minimise these effects, one can nevertheless look at the different distributions in height and power for the different lines to get an idea of their nature, using the on-line integration time of 5 seconds.
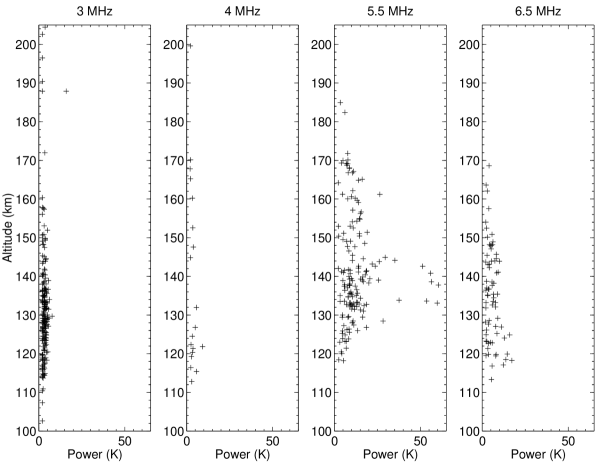
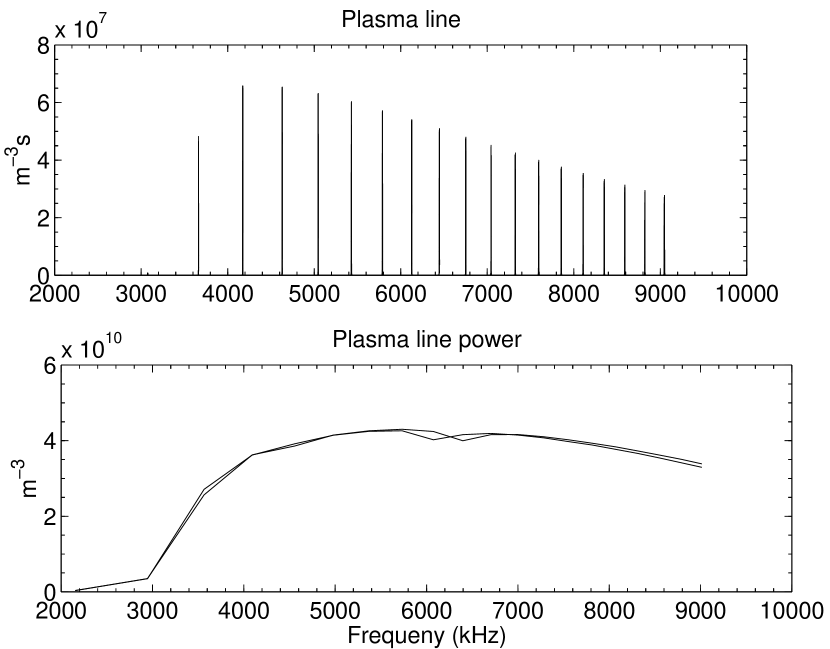
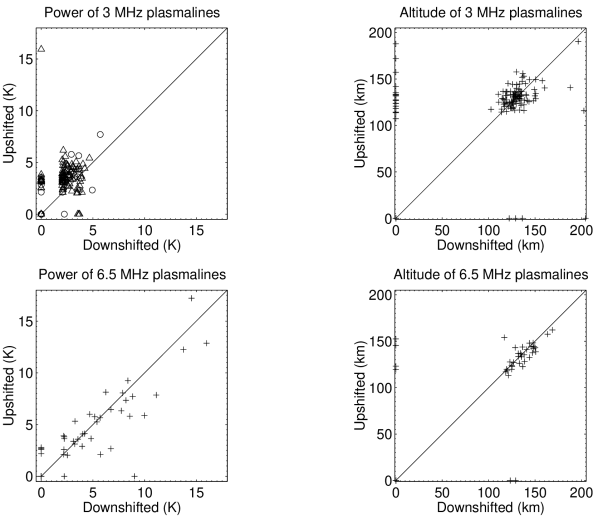
The altitude distributions for the different frequencies are shown in Fig. 11. One must note that the signal levels shown are not corrected for range, as the scattering volumes are not known, so signals from a higher altitude are in fact stronger than the corresponding signal from a lower height. It is clearly seen that the strongest signal is the 5.5 MHz line, followed by 6.5, 4 and 3 MHz. The altitude distribution shows more or less the expected dependence on range, but there are some exceptions: In one point at 188 km in the 3 MHz band and for the 5.5 MHz band the strong values between 130 and 140 km seem to be stronger than the others, even taking into account the range effect. However, the number of points are too few to be used as evidence on altitude effects. Most of the echoes are coming from around 120-150 km altitude and Fig. 12 shows a simulation of the expected strength of the plasma line for given background electron density. It shows a peak at around 5.5 MHz and this is also what the experiment shows. A more realistic suprathermal distribution will decrease the returned power for a number of frequencies and one should see the figure as an upper-limit estimate. Indeed, Nilsson et al. (1996b), have made predictions of the expected strength of Langmuir waves for different heights and carefully derived distributions. These predictions are in rather good agreement with the present measurements showing a strong peak between 5 and 6.5 MHz. Although there is some uncertainty on the scattering volume, the observed strengths of the plasma lines can be used to get some estimates of the distribution of the suprathermal population. Assuming a width of 6 eV, one need, to get to the measured strengths for the 3 MHz case, a suprathermal density of about m-3 which is 0.5 % of the thermal population. For the 5.5 and 6.5 MHz cases, it is enough with only m-3, but the uncertainty of volume is even larger here due to the active environment and the values should maybe be the same as for the lower frequency offsets.
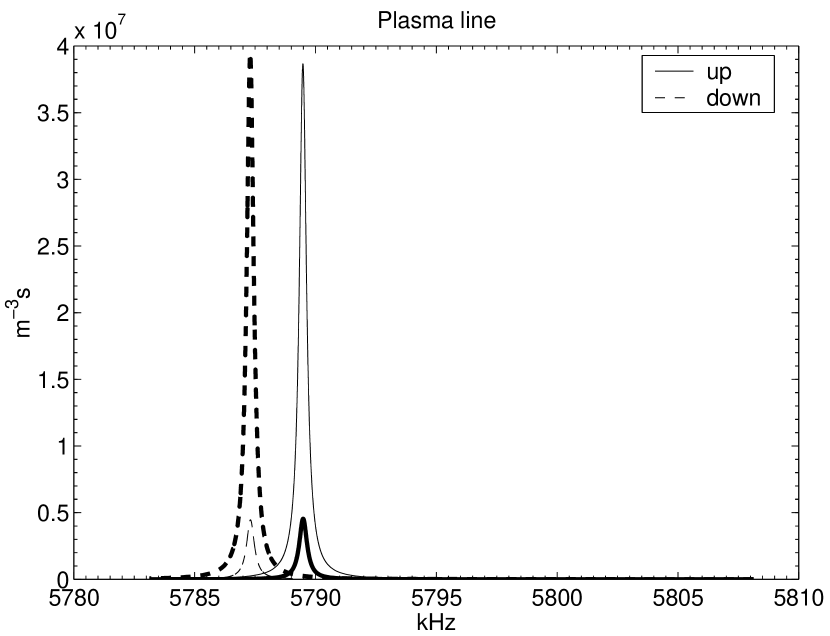
The most interesting thing with incoherent plasma lines is, of course, the possibility to derive differential drifts between ions and electrons, and from these deduce ionospheric currents. For this, one needs to measure the up- and downshifted lines simultaneously. Although the time of the measurement for both lines were not exactly the same in this experiment, the time shifts between them are so small (3-6 ms) compared to the total cycle time (300 ms) of the codes, that this effect is of minor importance. In Fig. 13, the strengths and altitudes of the two concurrently recorded up- and downshifted plasma lines are shown. In general, there are stronger up- than downshifted lines for the 3 MHz case, whereas no such trend can be seen in the 6.5 MHz band. However, there are exceptions to these overall trends and on occasions there are large differences in the signal strengths between the lines. Almost all of the 3 MHz plasma lines were recorded in diffuse aurora and this evident difference in signal power needs a closer examination. When there is a drift of the thermal electrons, the plasma lines shift, and when probing at a fixed frequency, the scatter may not come from the same altitude for the up- and downshifted lines respectively. The strength of the plasma line is also rather altitude dependent due to the damping by the collisions of electrons with ions and neutrals. But Fig. 13 shows no general height difference between the up- and downshifted 3 MHz lines, so this difference in strength cannot be explained by thermal electron bulk drifts. To simulate the effect of current carried by suprathermal electrons, Fig. 14 illustrates the strength of the 3 MHz plasma lines for Maxwellian electron beams of different energies. With no net current the lines are of almost the same strength, and the difference is mainly dependent on where in the receiver band the lines are. However the experiment shows stronger upshifted lines, thus it is evident that the diffuse aurora this night contained fluxes of downgoing suprathermal electrons or, in other words, there was an upgoing current carried by suprathermal electrons. The average power ratio between up- and downshifted lines, 1.4, can be used to estimate the amount of current carried by the suprathermals. As before, using a density of m-3 and temperature of 6 eV, and shifting this population to a current density of 15 Am-2 brings to the observed ratios. This current seems somewhat high, but not unrealistic.
For the 6.5 MHz bands there may be a slight difference with respect to the altitude, and that is most likely due to thermal currents causing frequency shifts of the plasma lines. This effect is not very clear, but as lower heights have higher density, or Langmuir frequency, and as the downshifted line is at a slightly lower height, this is most probably an effect of a downgoing current carried by thermal electrons. The correction due to heat-flow in the plasma dispersion function, discussed by Kofman et al. (1993) and confirmed later also by Nilsson et al. (1996a) and Guio et al. (1996), but not taken into account here, would also show the same effect in altitude difference between the lines. The band widths used here, 25 kHz, are much wider than the effect of heat-flow, which is less than or around 1 kHz in the F-region and much lower in the E-region, so that cannot explain the 6.5 MHz height differences. A recent paper by Guio et al. (1998) with proper calculation of the dispersion equation investigates the heat-flow and finds that it is not necessary to invoke the effect at all, but as this paper don’t go to the same extreme the heat-flow has to be considered.
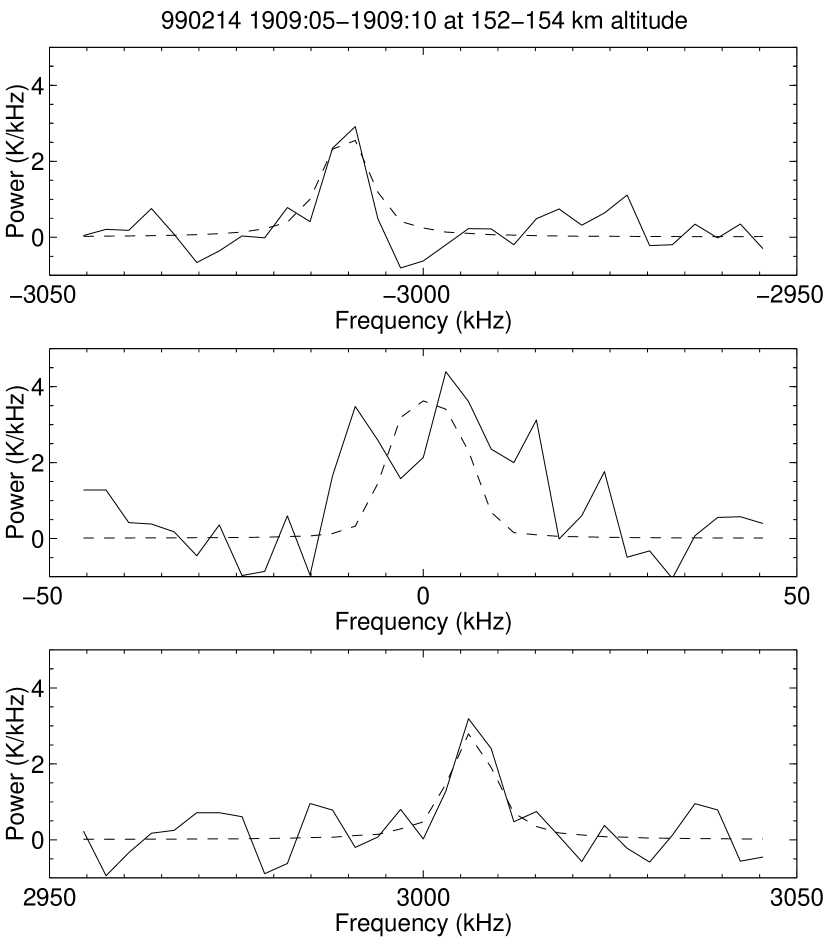
Most of the above discussions on currents are only on directions, but to get any quantitative numbers it is necessary to look at the individual spectra. Of the 256 events of enhanced plasma lines, there is only one that is good enough to investigate. All the other are too broad either due to the Langmuir frequency gradient smearing or the fact that the Langmuir frequency at the height in question is varying during the 5 second time slots. A further reason is that the stationarity condition for the alternating code technique is not fulfilled, due to changes of Langmuir frequency, and the spectra change too much within the 300 ms cycle. Anyway, there is one, and the up- and downshifted bands, together with the ion line band, are shown in Fig. 15. The shifts in this case are around 3 MHz as deduced from the ion line analysis. These spectra were then fitted to the theoretical spectrum in Eq. (7) using 7 ionospheric parameters, the thermal parameters for both ions and electrons and the parameters of a non-shifted suprathermal electron distribution. At the first glance the fit on the ion line seems rather poor, but the fit was done as usual in the time domain with proper weighting on the different lags of the ACF, and in the FFT process to produce Fig. 15 these statistical properties are lost. The fit looks actually better in the time domain, but the frequency domain was chosen in the figure to be more informative. The current density , and with the fitted parameters, the field aligned current carried by the thermal electrons, amount to 12 Am-2 downward. This is opposite the general current seen in the plasma line strength for the 3 MHz band, but the magnitudes are comparable. For this case no current could be seen on the suprathermals, and it is evident that the currents are rather structured. Of course, there are many more cases of no plasma lines than enhanced plasma lines in the diffuse aurora, and some cases of only one plasma line either up- or downshifted. It is not surprising that this single example of thermal currents do not follow the general trend. Again, heat-flow is not taken into account, but that should increase the current somewhat. The deduced suprathermal distribution is in good agreement with those Kirkwood et al. (1995) derived from the precipitating flux of primaries; of course in the present case the distribution is Maxwellian and without the fine structure due to the atmospheric constituents, but the numbers are comparable.
6 Conclusions
We have made measurements of plasma lines in the active auroral E-region. During 256 periods of 5 second integration we found a total of 468 plasma line echoes, divided into 220 on 3 MHz, 19 on 4 MHz, 157 on 5.5 MHz and 72 on 6.5 MHz. It may seem strange to try to measure plasma lines at such a low frequency as 3 MHz giving low signal levels, but in fact most of the echoes and the most interesting results came from this frequency offset.
The strongest echoes were found at the 5.5 MHz line, and somewhat weaker ones at 6.5 MHz, inside auroral arcs. One must, however, note that the strength measured inside the arcs is mostly a low-limit estimate due to the active environment. The integration period used, 5 s, is rather long in auroral arc conditions, and changes typically occur on shorter time scales. Therefore, effects of gradients in the Langmuir frequency profile, and hence scattering volumes, have not been taken into account.
The Holy Grail in incoherent scatter plasma lines is the possibility to measure currents, and in this case, the field-aligned currents in aurora. The simulations carried out here, the extended full incoherent scatter spectrum with multi-Maxwellian distributions of electrons, show that the strength of the lines is determined by the suprathermal part of the electron distribution, and the frequency mainly by the thermal part. For simultaneous up- and downshifted plasma line differences in intensity we can deduce currents carried by suprathermals, and for differences in frequency, currents carried by thermals.
The simultaneous up- and downshifted frequencies of the 3 MHz line in the diffuse aurora show, on average, an upward field-aligned suprathermal current during the two main periods when they were detected, 1940-2030 UT and 2250-2300 UT. In the arcs in general, there is an indication of downward thermal current as seen from the altitudes of the 6.5 MHz echoes. Of course, no rule is without exceptions, and there are cases where one line is much stronger than the other or the other line is not at all enhanced, indicating strong currents.
In the full 7-parameter fit of the incoherent scatter spectrum with the ion line and the both enhanced plasma lines, we obtained a thermal current with a suprathermal distribution of electrons consistent with distributions derived from precipitating fluxes.
Acknowledgements.
One of the authors (I.H.) was working under a contract from NIPR and is grateful to the Director-General of NIPR for the support. We are indebted to the Director and staff of EISCAT for operating the facility and supplying the data. EISCAT is an International Association supported by Finland (SA), France (CNRS), the Federal Republic of Germany (MPG), Japan (NIPR), Norway (NFR), Sweden (NFR) and the United Kingdom (PPARC).Literatur
- Baron (1984) Baron, M., The EISCAT facility, J. Atmos. Terr. Phys., 46, 469–472, 1984.
- Birkmayer and Hagfors (1986) Birkmayer, W. and Hagfors, T., Observational technique and parameter estimation in plasma line spectrum observations of the ionosphere by chirped incoherent scatter radar, J. Atmos. Terr. Phys., 48, 1009–1019, 1986.
- Dougherty and Farley (1960) Dougherty, J. P. and Farley, D. T., A theory of incoherent scattering of radio waves by a plasma, Proc. Roy. Soc. London, A, 259, 79–99, 1960.
- Dougherty and Farley (1963) Dougherty, J. P. and Farley, D. T., A theory of incoherent scattering of radio waves by a plasma: 3. Scattering in a partly ionized gas, J. Geophys. Res., 68, 5473–5486, 1963.
- Farley (1966) Farley, D. T., A theory of incoherent scattering of radio waves by a plasma: 4. The effect of unequal ion and electron temperatures, J. Geophys. Res., 71, 4091–4098, 1966.
- Farley et al. (1961) Farley, D. T., Dougherty, J. P., and Barron, D. W., A theory of incoherent scattering of radio waves by a plasma: II. Scattering in a magnetic field, Proc. Roy. Soc. London, A, 263, 238–258, 1961.
- Folkestad et al. (1983) Folkestad, K., Hagfors, T., and Westerlund, S., EISCAT: An updated description of technical characteristics and operational capabilities, Radio Sci., 18, 867–879, 1983.
- Guio et al. (1996) Guio, P., Bjørnå, N., and Kofman, W., Alternating-code experiment for plasma-line studies, Ann. Geophys., 14, 1473–1479, 1996.
- Guio et al. (1998) Guio, P., Lilensten, J., Kofman, W., and Bjørnå, N., Electron velocity distribution function in a plasma with temperature gradient and in the presence of suprathermal electrons: application to incoherent-scatter plasma lines, Ann. Geophys., 16, 1226–1240, 1998.
- Hagfors and Lehtinen (1981) Hagfors, T. and Lehtinen, M., Electron temperature derived from incoherent scatter radar observations of the plasma line frequency, J. Geophys. Res., 86, 119–124, 1981.
- Isham and Hagfors (1993) Isham, B. and Hagfors, T., Observations of the temporal and spatial development of induced and natural plasma lines during HF modification experiments at Arecibo using chirped ISR, J. Geophys. Res., 98, 13 605–13 625, 1993.
- Kirkwood et al. (1995) Kirkwood, S., Nilsson, H., Lilensten, J., and Galand, M., Strongly enhanced incoherent-scatter plasma lines in aurora, J. Geophys. Res., 100, 21 343–21 355, 1995.
- Kofman and Wickwar (1980) Kofman, W. and Wickwar, V., Plasma-line measurements at Chatanika with high-speed correlator and filter bank, J. Geophys. Res., 85, 2998–3012, 1980.
- Kofman et al. (1993) Kofman, W., St-Maurice, J.-P., and van Eyken, A. P., Heat flow effect on the plasma line frequency, J. Geophys. Res., 98, 6079–6085, 1993.
- Lehtinen and Häggström (1987) Lehtinen, M. and Häggström, I., A new modulation principle for incoherent scatter measurements, Radio Sci., 22, 625–634, 1987.
- Lehtinen and Huuskonen (1996) Lehtinen, M. and Huuskonen, A., General incoherent scatter analysis and GUISDAP, J. Atmos. Terr. Phys., 58, 435–452, 1996.
- Mishin and Schlegel (1994) Mishin, E. and Schlegel, K., On incoherent-scatter plasma lines in aurora, J. Geophys. Res., 99, 11 391–11 399, 1994.
- Nilsson et al. (1996a) Nilsson, H., Kirkwood, S., and Bjørnå, N., Bistatic measurements of incoherent-scatter plasma lines, J. Atmos. Terr. Phys., 58, 175–187, 1996a.
- Nilsson et al. (1996b) Nilsson, H., Kirkwood, S., Lilensten, J., and Galand, M., Enhanced incoherent scatter plasma lines, Ann. Geophys., 14, 1462–1472, 1996b.
- Oran et al. (1981) Oran, E., Wickwar, V., Kofman, W., and Newman, A. L., Auroral plasma lines: A first comparison of theory and experiment, J. Geophys. Res., 86, 199–205, 1981.
- Perkins and Salpeter (1965) Perkins, F. and Salpeter, E. E., Enhancement of plasma density fluctuations by nonthermal electrons, Phys. Rev., 139, 55–62, 1965.
- Rosenbluth and Rostoker (1962) Rosenbluth, M. N. and Rostoker, N., Scattering of electromagnetic waves by a nonequilibrium plasma, Phys. Fluids, 5, 776–788, 1962.
- Showen (1979) Showen, R. L., The spectral measurements of plasmalines, Radio Sci., 14, 503–508, 1979.
- Sulzer and Fejer (1994) Sulzer, M. P. and Fejer, J. A., Radar spectral observations of HF-induced ionospheric Langmuir turbulence with improved range and time resolution, J. Geophys. Res., 99, 15 035–15 050, 1994.
- Swartz (1978) Swartz, W. E., Analytic partial derivatives for least-squares fitting incoherent scatter data, Radio Sci., 13, 581–589, 1978.
- Swartz and Farley (1979) Swartz, W. E. and Farley, D. T., A theory of incoherent scattering of radio waves by a plasma: 5. The use of the Nyquist theorem in general quasi-equilibrium situations, J. Geophys. Res., 84, 1930–1932, 1979.
- Valladares et al. (1988) Valladares, C. E., Kelley, M. C., and Vickrey, J. F., Plasma line observations in the auroral oval, J. Geophys. Res., 93, 1997–2003, 1988.
- Wickwar (1978) Wickwar, V. B., Plasma lines in the auroral E layer, J. Geophys. Res., 83, 5186–5190, 1978.