Dielectronic recombination of lithium-like Ni25+ ions — high resolution rate coefficients and influence of external crossed E and B fields
Abstract
Absolute dielectronic recombination (DR) rates for lithium-like Ni25+() ions were measured at high-energy resolution at the Heidelberg heavy-ion storage ring TSR. We studied the center-of-mass energy range 0–130 eV which covers all =0 core excitations. The influence of external crossed electric (0–300 V/cm) and magnetic (41.8–80.1 mT) fields was investigated. For the measurement at near-zero electric field resonance energies and strengths are given for Rydberg levels up to n32; also Maxwellian plasma rate coefficients for the =0 DR at electron temperatures between 0.5 and 200 eV are provided. For increasing electric field strength we find that for both the and the series of Ni24+() Rydberg resonances with the DR rate coefficient increases approximately linearly by up to a factor of 1.5. The relative increase due to the applied electric field for Ni25+ is remarkably lower than that found in previous measurements with lighter isoelectronic Si11+, Cl14+ and also Ti19+ ions, [T. Bartsch et al, Phys. Rev. Lett. 79, 2233 (1997); 82, 3779 (1999) and to be published] and in contrast to the results for lighter ions no clear dependence of the electric field enhancement on the magnetic field strength is found. The Maxwellian plasma rate coefficients for =0 DR of Ni25+ are enhanced by at most in the presence of the strongest experimentally applied fields.
pacs:
34.80.Lx,32.60.+i,36.20.Kd,52.20.-jI Introduction
Dielectronic recombination (DR) is an electron-ion collision process which is well known to be important in astrophysical and fusion plasmas[1, 2]. In DR the initially free electron is transferred to a bound state of the ion via a doubly excited intermediate state which is formed by an excitation of the core and a simultaneous attachment of the incident electron. This two step process
| (1) |
involves dielectronic capture (time-inverse Auger process) as the first step with a subsequent stabilization of the lowered charge state by radiative decay to a state below the ionization limit. This second step competes with autoionization which would transfer the ion back into its initial charge state with the net effect being resonant elastic or inelastic electron scattering. Another recombination process, which in contrast to DR is non-resonant, is radiative recombination (RR)
| (2) |
where the initially free electron is transferred to a bound state of the ion and a photon is emitted simultaneously. The cross section for RR diverges at zero electron energy and decreases rapidly towards higher energies. In the present investigation we regard RR as a continuous background on top of which DR resonances are emerging.
In the case of narrow non-overlapping DR resonances the DR cross section due to an intermediate state labelled can be well approximated by[3]
| (3) |
with the electron-ion center-of-mass (c. m.) frame energy , the Lorentzian line shape normalized to and the resonance strength
| (5) | |||||
where is the resonance energy, and are the statistical weights of the initial ionic core and the doubly excited intermediate state , and denote the rate for an autoionizing transition from to and the rate for a radiative transition from to states below the first ionization limit, respectively. The summation indices and run over all states which from can either be reached by autoionization or by radiative transitions, respectively.
Soon after the establishment of DR as an important process governing the charge state balance of ions in the solar corona[4], Burgess and Summers[5] and Jacobs et al.[6] realized that DR cross sections should be sensitive to external electric fields present in virtually any plasma environment. The electric field enhancement of DR rates was subsequently reproduced in a number of theoretical calculations[7]. Briefly, the effect arises from the Stark mixing of states and the resulting influence on the autoionization rates which, by detailed balancing, determine the capture of the free electron. Autoionization rates strongly decrease with increasing and, therefore, only low states significantly contribute to DR. Electric fields mix low and high states and thereby increase the autoionization rates of the high states and consequently also the contribution of high Rydberg states to DR.
The control of external fields in experiments using intense ion and electron beams is a challenge. Results from early recombination experiments[8, 9] could only be brought in agreement with theory under the assumption that external electric fields had been present in the interaction region. The first experiment where external fields were applied under well controlled conditions was performed by Müller and coworkers[10] who investigated DR in the presence of external fields (DRF) of singly charged Mg+ ions. They observed an increase of the measured DR cross section by a factor of about 1.5 when increasing the motional electric field from 7.2 to 23.5 V/cm. The agreement of these results with theoretical predictions[11, 12] was at the 20% level. Further DRF experiments with multiply charged C3+ ions also revealed drastic DR rate enhancements by electric fields[13]; however, the large uncertainties of these measurements left ambiguities.
The first DRF experiment using highly charged ions at a storage ring was carried out with Si11+ ions by Bartsch et al.[14]. It produced results with an unprecedented accuracy, enabling a detailed comparison with theory. Whereas the overall agreement between experiment and theory for the magnitude of the effect (up to a factor of 3 when increasing the field from 0 V/cm to 183 V/cm) was fair, discrepancies remained in the functional dependence of the rate enhancement on the electric field strength. This finding stimulated theoretical investigations of the role of the additional magnetic field which is always present in storage ring DR experiments, since it is needed to guide and confine the electron beam within the electron cooler. In a model calculation Robicheaux and Pindzola[15] found that in a configuration of crossed and fields indeed the magnetic field influences through the mixing of levels the rate enhancement generated by the electric field. More detailed calculations[16, 17] confirmed these results. It should be noted that in theoretical calculations by Huber and Bottcher[18] no influence of a pure magnetic field of at least up to 5 T on DR was found.
Inspired by these predictions we previously performed storage ring DRF experiments using Li-like Cl14+[19] and Ti19+[20] ions and crossed and fields where we clearly discovered a distinct effect of the magnetic field strength on the magnitude of the DR rate enhancement. The electric field effect decreased monotonically with the field increasing from 30 mT to 80 mT. A decrease of the electric field enhancement by a crossed magnetic field is also predicted by the model calculation of Robicheaux and Pindzola[15] for magnetic fields larger than approximately 20 mT where, due to a dominance of the magnetic over the electric interaction energy, the -mixing weakens and consequently the number of states participating in DR decreases. At lower magnetic fields -mixing yields an increase of the DR rate with increasing field. A corresponding experimental observation has been made recently by Klimenko and coworkers[21] who studied recombination of Ba+ ions from a continuum of finite bandwidth which they had prepared by laser excitation of neutral Ba atoms. For a given electric field strength of 0.5 V/cm, they find that the recombination rate is increasingly enhanced by crossed magnetic fields up to about 20 mT. However, there is no effect of the magnetic field when it is directed parallel to the electric field vector. For the -mixing to occur the crossed and arrangement is essential. In the case of parallel and fields remains a good quantum number and no influence of the magnetic field is expected.
The aim of the present investigation with Li-like Ni25+ is to extend the previous studies to an ion with even higher nuclear charge . Because of the scaling of radiative rates it is expected that with higher less states of a given Rydberg level take part in DR and therefore the sensitivity to -mixing decreases[10]. Results of Griffin and Pindzola[22] who calculated decreasing DR rate enhancements for increasing charge states of iron ions point into the same direction. Another aspect of going to higher is that even high lying Rydberg resonances are more separated in energy and therefore easier to resolve. This has been demonstrated by Brandau et al. who resolved DR resonances up to in the recombination spectrum of Li-like Au76+ ions[23]. When choosing Ni25+ we hoped to be able to study the field enhancement effect on a single resonance. This would enable a quantitative comparison with theory which at present is limited to a single low value of [16] when explicitly treating all levels required for a realistic description of DR in crossed and fields.
In our DRF studies we have chosen Li-like ions as test systems since on the one hand their electronic structure is simple enough to be treated theoretically on a high level of sophistication and on the other hand provides strong DR channels connected to the core excitations.
II Experiment
The measurements have been performed at the heavy ion storage ring TSR[24] of the Max-Planck-Institut für Kernphysik in Heidelberg. For a general account of experimental techniques at heavy ion storage rings the reader is referred to an article by Müller and Wolf[25]. Recombination measurements at storage rings have been reviewed recently by Müller[26], Schippers[27] and Wolf et al.[28]. Detailed descriptions of the experimental procedure for field free DR measurements have been given by Kilgus et al.[29] and more recently by Lampert et al.[30]. Therefore, we here only describe more explicitly experimental aspects pertaining especially to the present investigation.
The 58Ni25+ ion beam was supplied by the MPI tandem booster facility and injected into the TSR with an energy of 343 MeV. Using multiturn injection and e-cool stacking[31] ion currents of up to 3300 A were stored in the TSR. At these high ion currents, however, intra beam scattering heated the ion beam during DR measurements resulting in a considerable loss of energy resolution. To avoid this and to limit the recombination count rate to below 1 MHz, i. e. to below a count rate where dead time effects are still negligible, we kept ion currents below 1 mA during all DR measurements. In the storage ring the circulating Ni25+ ions were merged with the magnetically guided electron beam of the electron cooler. In the present experiment the electron density was cm-3 at cooling energy. Generally the electron density varies with the cathode voltage thereby following a dependence. The distribution of collision velocities in the electron-ion center of mass frame can be described by the anisotropic Maxwellian
| (7) | |||||
characterized by the longitudinal and transverse temperatures and . In Eq. (7) is the electron mass, is the Boltzmann constant, and is the detuning of the average longitudinal electron velocity from that at cooling, which determines the relative energy between the electron and the ion beam. The longitudinal temperature, inferred from the experimental resolution for relative energies , was meV. It implies an energy resolution given by (FWHM)[29]. The longitudinal velocity spread of the stored ion beam yields a considerable contribution to this temperature, while the velocity spread of the electron beam alone, after acceleration, is estimated to be meV. In the transverse direction the electron beam was adiabatically expanded[32] from a diameter mm at the cathode to a diameter mm in the interaction region; the reduction of its transverse velocity spread by this expansion determines the low value of the transverse temperature of meV.
Before starting a measurement, the ion beam was cooled for 5 seconds until the beam profiles reached their equilibrium widths. This can be monitored online by employing beam profile monitors based on residual gas ionization[33]. The cooled ion beam had a diameter mm. During the measurement the electron cooler voltage was stepped through a preset range of values different from the cooling voltage, thus introducing non-zero mean relative velocities between ions and electrons. Recombined Ni24+ ions were counted as a function of the cooler voltage with a CsI-scintillation detector[34] located behind the first dipole magnet downstream of the electron cooler. The dipole magnet bends the circulating Ni25+ ion beam onto a closed orbit and separates the recombined Ni24+ ions from that orbit.
Two different measurement schemes were applied for the measurement of i) a high resolution ‘field-free’ DR spectrum (residual stray electric fields V/cm) and ii) DRF spectra with motional electric fields ranging up to 300 V/cm. In view of the result of Huber and Bottcher[18] who calculated that purely magnetic fields below 5 T do not influence DR, the use of the term ‘field-free’ seems justified in case i) even with the magnetic guiding field (up to 80 mT) still present in the electron cooler.
A Procedure for a field free high resolution measurement
In between two measurement steps for different values of the cooler voltage was first set back to the cooling value in order to maintain the ion beam quality and then set to a reference value which is chosen to lead to a relative velocity where the electron-ion recombination signal is very small, favourably being only due to a negligible RR contribution (reference relative energy ). Under this condition the recombination rate measured at the reference point monitors the background signal due to electron capture from residual gas molecules. Choosing short time intervals of the order of only 10 ms for dwelling on the measurement, cooling and reference voltages ensured that the experimental environment did not change significantly between the signal and the background measurements. An additional interval of 1.5 ms after each change of the cooler voltage allowed the power supplies to reach the preset values before data taking was started.
The electron-ion recombination coefficient
| (8) |
is obtained from the background corrected recombination count rate , the detection efficiency , the electron density , the number of stored ions , the nominal length m of the interaction zone and the ring circumference m using the relation
| (9) |
where is the relativistic Lorentz factor for the transformation between the c. m. and the laboratory frames where the ions of mass have the kinetic energy . The detection efficiency of the CsI-scintillation detector[34] used to detect the recombined ions is very close to unity for count rates up to 2.5 MHz. The second term in Eq. (9) is to be added in case of a non-negligible electron-ion recombination rate at the reference energy. We insert the theoretical RR rate at which we have calculated to be cm3/s using a semi-classical formula for the radiative recombination cross section[35]
| (11) | |||||
with denoting the Rydberg constant and being correction factors given by Andersen and Bolko[36]. This expression for recombination on bare nuclei is used to approximately describe RR on a lithium-like core by introducing the lowest quantum number and weight factors accounting for partial occupation of -shells. In our calculation we use and for . For the maximum (cut off) quantum number we use as explained below.
After the generation of a recombination spectrum from the experimental data via Eq. (9) a correction procedure accounting for non-perfect beam overlap in the merging sections of the cooler is applied[30] which in our case only slightly redistributes the DR resonance strengths, resulting in DR peaks narrower and taller by small amounts. The systematic uncertainty in the absolute recombination rate coefficient is due to the ion and electron current determination, the corrections accounting for the merging and demerging sections of the electron and ion beams, and the detection efficiency. It is estimated to be of the measured recombination rate coefficient[30]. The statistical uncertainty of the results presented below amounts to less than of the rate coefficient maximum.
B Procedure for DRF measurements
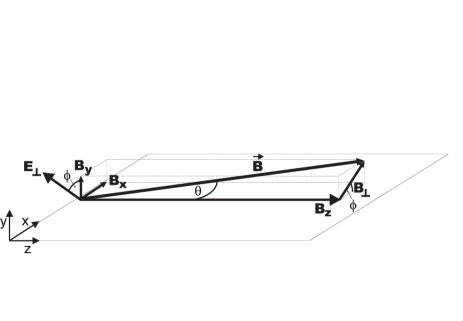
The geometry of the magnetic and electric fields present in the merging section of the electron cooler is sketched in Fig. 1. We choose the -axis to be defined by the ion beam direction. The magnetic guiding field defines the electron beam direction. The field strength is limited both towards low and high values. Only fields mT guarantee a reliable operation of the electron cooler. The maximum tolerable current through the generating coils limits to at most 80 mT. Correction coils allow the steering of the electron beam in the - plane. In the first place these are used to minimize the transverse field components and with respect to the ion beam, such that the two beams are collinear and centered to each other. The collinearity is inferred indirectly from beam profile measurements of the cooled ion beam [33] with an accuracy of mrad; i. e. the transverse magnetic field components caused by imperfections in the beam alignment amounts at most to 210. Residual fields which may vary in size and direction along the overlap length, are expected to be also of this magnitude. Since the settings of the various steering magnets result from a rather tedious beam optimization process, they are not exactly reproduced after each optimization procedure that is required e. g. after a change of the magnetic guiding field . This means that the residual transverse magnetic fields for the collinear geometry may also slightly vary from one set of cooler settings to another. All uncertainties in the transverse magnetic field translate into an uncertainty in the motional electric field of less than 10 V/cm in our present experiment.
In DRF measurements we offset the current through the correction coils to generate additional magnetic field components and . Their influence on the stored ion beam is negligible, i. e. the ion beam is still travelling with velocity in -direction. However, in the frame of the ion beam the magnetic field components and generate a motional electric field in the - plane rotated out of the direction by the azimuthal angle , i. e. for . The electrons (due to their much lower mass) follow the resulting magnetic field vector which now crosses the ion beam at the angle . Two consequences are to be dealt with: i) The ion beam now probes different portions of the space charge well of the electron beam. This reduces the energy resolution. In order to minimize this effect we used a rather small electron density of only cm-3 at cooling, i. e. one order of magnitude smaller than in the Si11+ experiment of Bartsch et al.[14]. ii) The angle between electron beam and ion beam explicitly enters the formula for the transformation from the laboratory system to the c. m. system which is easily derived from the conservation of four-momentum. It reads
| (12) |
with the mass ratio ,
| (13) |
and ; denotes the electron laboratory energy. It is obvious that the cooling condition can only be reached for and , i. e. for . In regular field-free measurements a scheme of intermittent cooling is used during data taking, i. e. after each measured energy a cooling interval () is inserted. For DRF measurements this would require rapid switching from to cooling with . It turned out that such a procedure heavily distorts the electron beam mainly because of the slow response of the power supplies controlling the steering coils. Under such conditions useful measurements could not be performed. Therefore, we omitted the intermittent cooling and reference measurement intervals, thereby losing resolution. After each injection into the ring and an appropriate cooling time the correction coils were set to produce a defined and the cathode voltage was ramped very quickly through a preset range with a dwell-time of only 1 ms per measurement point. In such a manner a spectrum for one setting was collected within only 4 s. After termination of the voltage ramp the correction coils were set back to and the whole cycle started again with the injection of ions into the ring. In subsequent cycles a range of typically 30 preset values was scanned. Each spectrum was measured as many times as needed for reaching a satisfying level of statistical errors. This whole procedure was repeated for different settings of the guiding field strength .
In order to compare only contributions from DR to the measured spectra we subtracted an empirical background function with the coefficients determined by fitting to those parts of the spectrum which do not exhibit DR resonances. One should note that a proper calculation of the RR rate coefficient is hampered by the fact that for the electron velocity distribution probed by the ion beam cannot be described by Eq. (7).
III Results and Discussion
A Recombination at zero electric field
1 DR cross section
For the DR channels of Li-like Ni25+, i. e. for DR involving excitations which do not change the main quantum number of any electron in the core, Eq. (1) reads more explicitly
| (14) | |||||
| (17) |
The lowest Rydberg states which are energetically allowed are and for and core excitations, respectively.
The Ni recombination spectrum has been measured for eV. The result is shown in Fig. 2. At a sharp rise of the recombination rate due to RR is observed. At higher energies DR resonances due to transitions occur, the lowest resonance appearing at eV. Individual resonances are resolved for . Their resonance strengths have been extracted from the measured spectrum by first subtracting the theoretical recombination rate coefficient due to RR (cf. section II A) where the c. m. velocity spread can be neglected since is very large compared to and . In principle the resulting rate coefficient should be zero at off-resonance energies. However, we find that probably due to our approximate treatment of RR (cf. Eq. (11)) small non-zero rate coefficients remain after subtraction of the calculated RR rate coefficient. These are removed by further subtracting a smooth background before the observed DR resonance structures are fitted by Gaussians. (Details of the observed smooth RR rate were not further investigated in the present work.) The resulting values for resonance positions and strengths are listed in Table I. The and resonances at about 2.5 eV and 4.5 eV, respectively, exhibit a splitting due to the interaction of the -Rydberg electron with the core. For higher resonances this splitting decreases and cannot be observed because of the finite experimental energy spread which increases as . The Rydberg series limits, , are obtained from a fit of the resonance positions with to the Rydberg formula
| (18) |
with the quantum defect as a second fit parameter. The fit results are listed in Table II, where spectroscopic values[37] for the series limits are also given. Our values agree with the spectroscopic values within , i. e. within the experimental uncertainty of the energy scale[29]. The result that the fitted quantum defects are almost zero reflects the fact that the interaction between the core electrons and the Rydberg electron is weak.
The measured DR rate decreases already below the and series limits as obtained from the fit to the peak positions. (cf. Fig. 2). This discrepancy results from field ionization of high Rydberg states with in the charge analyzing dipole magnet (see Sec. II) with magnetic field strength T where the moving ion experiences the motional electric field ( is the classical field ionization limit). A more realistic value for the cut-off has to account for Stark splitting and tunnelling effects. In Ref. [10] an approximate value was found. For the calculation of the actual cut-off quantum number relevant in this experiment one has to take into account that on the way from the cooler to the dipole magnet states with may radiatively decay to states below . An approximate calculation of this effect[38] yields for the present case.
An estimate of the DR line strength escaping detection because of field ionization can be made by extrapolating the measured DR line strength to employing the scaling of the autoionization and the type II (cf. Eq. (17)) radiative rates[39]. For autoionization rates we make the ansatz for and for . Rates for the sum of type I and type II radiative transitions we represent as . The same representations of the relevant rates have already been used by Kilgus et al.[29] in a recombination study of isoelectronic Cu26+ ions. After summation over all substates Eq. (5) simplifies to
| (19) |
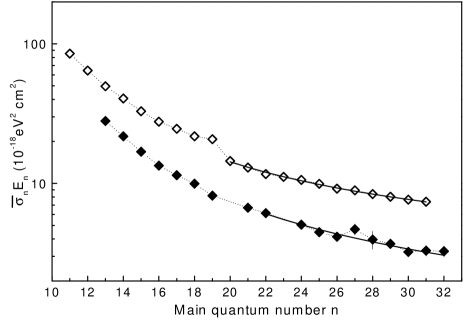
with . For the statistical weights in Eq. (5) we have used and . Here, is the total angular momentum quantum number of the core excited state i. e. and 3/2 in the present case. The first step of the extrapolation procedure consists of adjusting the model parameters such that Eq. (19) fits the measured DR line strengths. Here the values for have been taken from atomic structure calculations[40] while , and were allowed to vary during the fit. It turned out that the fit is not very sensitive to large variations of the Auger rates . In this situation we kept also the Auger rates fixed at values which have been inferred from atomic structure calculations and which are meant to be order of magnitude estimates only. In Fig. 3 we have plotted the measured and fitted resonance strengths (multiplied by the resonance energy) as a function of the main quantum number. The actual parameters used for drawing the fit curves are listed in Table II. The fit has been restricted to for both the and the series because additional Coster-Kronig decay channels open up when crosses the series limit. A corresponding discontinuous decrease of the DR resonance strength can be clearly discerned in Fig. 3. Since the additional autoionizing channels are included for the series of resonances but not for the series, for the series is more than a factor of 2 higher than for the series. A factor of 2 would just correspond to the ratio of statistical weights.
Inserting the fit parameters listed in Table II into Eqs. (18) and (19) now allows an extrapolation of the DR resonance positions and strengths, respectively, to be obtained for arbitrary high . In order to check the quality of the extrapolation we have convoluted the extrapolated DR cross section with the experimental electron energy distribution using the electron beam temperatures meV and meV. After adding the semiclassically calculated RR rate coefficient — as described above — the resulting extrapolated DR+RR recombination rate coefficient is plotted in Fig. 4 together with the experimental one. Despite the very simple model assumptions the calculated recombination rate agrees with the measured one also over the energy intervals covered by the resonances with which are not resolved individually and therefore have not been used for the fits. Deviations for the Ni resonances with stem from the fact that for these resonances the Coster-Kronig decay channels to Ni are closed whereas the fit has been made to resonances where they are open. At energies close to the series limits slight deviations from the model rate occurs even when the expected value of is inserted into the model (dashed line in Fig. 4). The origin of this discrepancy has probably to be searched for in the approximations made in both the field ionization model and in the model rate descriptions, in particluar regarding the dependence of the angular momentum which may be affected by even the small residual electric fields in the interaction region.
2 Maxwellian plasma rate coefficient
The comparison between the measured data and the calculated extrapolation to (full line in Fig. 4) suggests that only a minor part of the total Ni25+ DR resonance strength has not been measured. This enables us to derive from our measurement the Ni25+ DR rate coefficient in a plasma. To this end the experimental DR rate coefficient is substituted by the extrapolated one at energies eV below the series limits. Compared to using the experimental result without extrapolation this results in a correction of the plasma rate coefficient of at most . The experimental DR rate coefficient including the high -extrapolation is convoluted by an isotropic Maxwellian electron velocity distribution characterized by the electron temperature . The resulting DR plasma rate coefficient is displayed in Fig. 5 (thick full line). Summing experimental and extrapolation errors, the total uncertainty of the DR rate coefficient in plasmas determined in this work amounts to .
A convenient representation of the plasma DR rate coefficient is provided by the following fit formula
| (20) |
It has the same functional dependence on the plasma electron temperature as the widely used Burgess formula[41], where the coefficients and are related to oscillator strengths and excitation energies, respectively. The results for the fit to the experimental Ni25+ DR rate coefficient in a plasma (thick full line in Fig. 5) are summarized in Table III. The fitted curve cannot be distinguished from the experimental plasma rate coefficient in a plot as presented in Fig. 5.
In Fig. 5 we also compare our results with theoretical results for DR by Mewe et al.[42] (dashed line), Romanik[43] (dash-dotted line) and Teng et al.[44] (dashed-dot-dotted line) who interpolated DR calculations performed by Chen[45] for selected lithiumlike ions. At temperatures eV the rate of Mewe et al., which is based on the Burgess formula[41], overestimates our experimental result by up to a factor of . At lower temperatures the experimental result is underestimated by factors up to 10. Above an electron temperature of 30 eV Romanik’s theoretical result agrees with our DR rate coefficient to within , which is within the experimental accuracy. In this energy range the interpolation result of Teng et al. underestimates the experimental rate coefficient by 20–30. It should be noted that neither the calculation of Romanik nor that of Teng et al. covers temperatures below 10 eV. When compared with our RR calculation (thin full line in Fig. 5) our experimental result shows that in the temperature range of 1 to 10 eV, where Ni25+ ions may exist in photoionized plasmas, DR is still significant. The importance of DR in low temperature plasmas has been pointed out recently by Savin et al.[46] who measured DR of fluorine-like Fe17+ ions. At higher temperatures Romanik’s calculation[43] suggests that above 100 eV DR contributions become significant (upper dash-dotted line in Fig. 5).
B DRF measurements
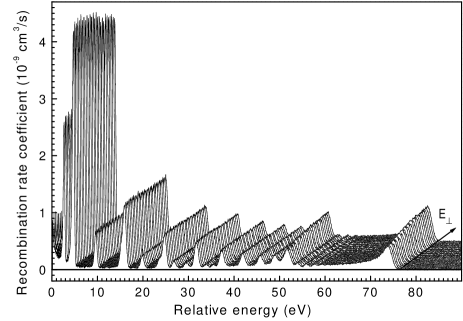
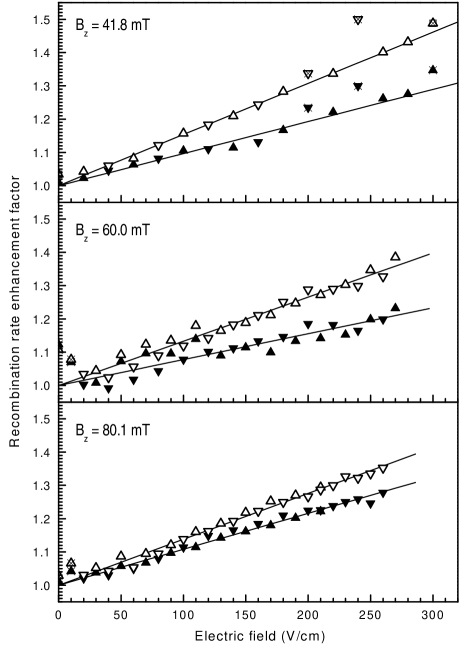
Fig. 6 shows a series of Ni25+ recombination spectra measured in the presence of external electric fields ranging from 0 to 270 V/cm. The magnetic field on the axis of the cooler has been mT. Due to the altered measurement scheme that leaves out the intermittent cooling of the ion beam, the energy resolution is reduced compared to Fig. 2. Now individual DR resonances are resolved only up to . Two features in the series of spectra are to be noted. Firstly, the strength of the DR resonances occurring below 47 eV does not depend on . Secondly, the strength of the unresolved high- DR resonances increases with increasing field strength. This can been seen more clearly from the close-up presented in Fig. 7. At energies of more than 10 eV below the series limits the different DR spectra lie perfectly on top of each other whereas at higher energies (i. e. ) an increase of the DR intensities by up to a factor of 1.5 at V/cm is observed. The degraded resolution of the DR spectrum does not allow us to resolve levels in the range of the electric field enhancement. In order to quantify this DR rate enhancement we consider integrated recombination rates with the integration intervals chosen as marked in Fig. 7.
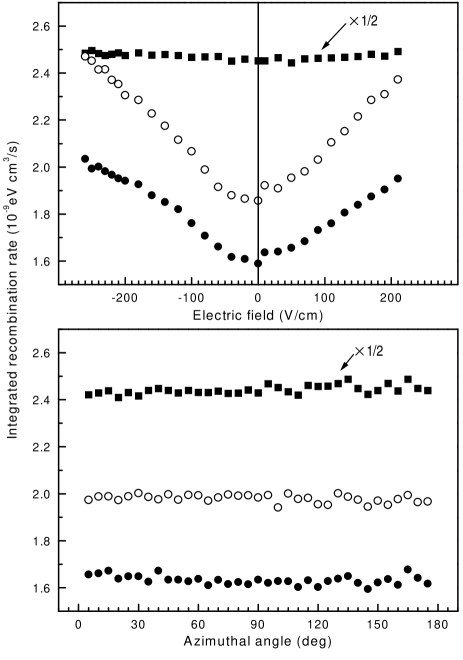
The integration intervals 44.0–53.5 eV and 66.2–76.0 eV include all resonances with for and , respectively. In the following we denote the resulting integrals by and . The energy range 44.0–53.5 eV also contains resonances with . These resonances, however, are not affected by the electric field strengths used in our experiment. Consequently, any change in the magnitude of as a function of we attribute to field effects on resonances. As a check of the proper normalization of the DR spectra we additionally monitor the integral which comprises the strengths of the , and DR resonances with . Since these low resonances are not affected by we expect to be constant. Any deviation of from a constant value would indicate a reduction of beam overlap due to too large a tilting angle of the electron beam. The maximum angle to which the overlap of the electron beam with the ion beam is ensured over the full interaction length is given by . With the geometrical values given above one obtains . Apart from the highest at and at the lowest magnetic guiding field, i. e. at mT, the condition was always met. This is exemplified in the upper panel of Fig. 8 where , and are shown for -270 V/cm 220 V/cm. There, positive (negative) field strength indicates (). While and clearly exhibit a field effect which is nearly symmetric about V/cm, is independent of .
The fact that the increase of the integrated recombination rate coefficient is independent of the sign of the electric field vector is expected from the cylindrical symmetry of the merged beams arrangement in the electron cooler. However, for the entire experimental setup this symmetry is broken by the charge analyzing dipole magnet with an electric field vector lying in the bending plane (the - plane of the coordinate frame defined in the interaction region). This, in principle, could lead to redistribution of population between different substates in the dipole magnet[47] and a resulting field ionization probability depending on the azimuthal angle of the motional electric field vector in the cooler. In order to clarify this question we took a series of DRF spectra with ranging from 5∘ to 175∘. At the same time the electric and magnetic fields were kept fixed at V/cm and mT. A scan around a full circle was prohibited by the limited output of the power supplies used for steering the electron beam in the particular arrangement of this experiment. As shown in the lower panel of Fig. 8 no significant dependence of the integrated recombination rates on the azimuthal angle was found.
As a measure for the magnitude of the field enhancement we introduce the field enhancement factor
| (21) |
for or and the constant chosen such that (see below). Plots of enhancement factors as a function of are shown in Fig. 9 for different values of . Since the field effect is independent of the orientation of the electric field in the - plane data points for and are plotted together. The enhancement factor exhibits a linear dependence on the electric field. Exceptions occur for mT and at values where becomes maximal, and around V/cm. In the former case the complete overlap of the ion beam and the electron beam over the full length of the interaction region is lost. This is indicated by a reduction of , and apparently a consistent normalization cannot be carried out. In the latter case residual electric and magnetic field components resulting e. g. from a non-perfect alignment of the beams prevent us from reaching eV. After excluding all data points with V/cm and those with , V/cm for mT, we were able to fit straight lines to the measured field enhancement factors as a function of . The constants in Eq. (21) have been chosen such that the fitted straight lines yield .
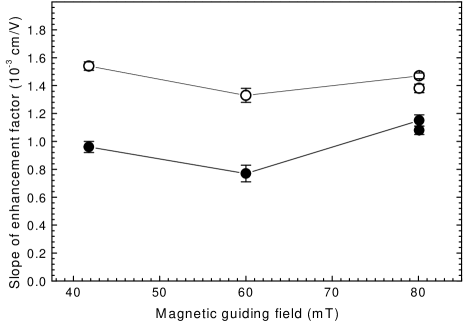
As a measure for the electric-field enhancement of the DR rate enhancement we now consider the slopes
| (22) |
of the fitted straight lines, which are displayed as a function of the magnetic field strength in Fig. 10. The error bars correspond to statistical errors only. Systematic uncertainties e. g. due to residual fields are difficult to estimate. Nevertheless, their order of magnitude can be judged from the difference between the two data points at mT which have been measured with different cooler settings.
For all magnetic fields used the electric field dependence of the rate enhancement factor is steeper for the series of Rydberg resonances than that for the series. This can be understood from the fact that the multiplicity of states and consequently the number of states which can be mixed is two times higher for than for . Following this argument one would expect a ratio of 2 for the respective incremental integrated recombination rates . From our measurements we find lower values scattering around 1.5 indicating a somewhat reduced number of states available for field mixing within the series of Ni DR resonances. In calculations for Li-like Si11+ and C3+ ions ratios, even less than 1 have been found[16, 48]. This has been attributed to the electrostatic quadrupole-quadrupole interaction between the and the Rydberg electron in the intermediate doubly excited state, which more effectively lifts the degeneracy between the than between the levels. Another reason for the reduced number of states participating in DRF might be the existence of additional Coster-Kronig decay channels for these resonances with to Ni (cf. section III A).
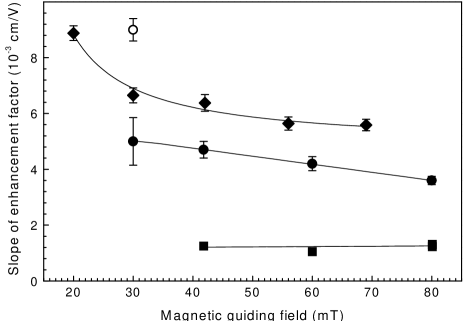
Slopes for the relative electric field enhancement according to Eq. (22) were previously determined in measurements by Bartsch and coworkers for the lighter isoelectronic ions Si11+, Cl14+ and Ti19+ [14, 19, 20]. The present results are compared with these previous data in Fig. 11. It should be noted that the comparison is only semi-quantitative, because the choice of integration ranges for the calculation of the integrated recombination coefficients is somewhat arbitrary and different cut-off quantum numbers exist for the different ions (cf. Table IV). Clearly, the relative enhancement for a given electric field strength is much lower for Ni25+ than for the lighter ions studied so far, with the reduction for the step from lithium-like titanium () to nickel () apparently much larger than the step from, e. g., chlorine () to . As a general trend with increasing , the radiative decay rates decrease for type I transitions (see Eq. (17)) and for type II transitions, while the autoionization rates are rather independent of . This shifts the range where the low- autoionization rates are larger than the radiative stabilization rates (the condition for DR enhancement by -mixing to occur [15]) down to states of lower principal quantum number for increasing . For Ni25+ the degree of mixing reached by the typical experimental field strengths appears to be much reduced as compared to lighter ions. In addition, a clear dependence of the electric field enhancement on the the magnetic field strength is no longer observed for Ni25+. To clarify the reason for the strong reduction of both the electric and the additional magnetic field effect in the heavy system studied here, detailed quantitative calculations are desirable.
External electric and magnetic fields are ubiquitous in astrophysical or fusion plasmas. Therefore, it is of interest to look into the implications of the field enhancement effect for the Ni25+ DR rate coefficient in a plasma. As an example we show in Fig. 12 the ratio of rate coefficients derived from two measurements with and without external electric field. As compared to zero electric field, the recombination coefficient at our highest experimental electric field strength ( V/cm at mT) is enhanced by up to 11. This value only represents a lower limit for the enhancement at the given field strength, as we observe DR resonances due to Ni intermediate states only up to . It should also be noted that in our experiments we did not reach the electric field strength where the DR rate enhancement saturates.
IV Summary and conclusions
The recombination of lithium-like Ni25+ ions has been experimentally studied in detail. Spectroscopic information on individual DR resonances associated with Ni intermediate states, which have been experimentally resolved up to , has been extracted and the DR plasma rate coefficient has been derived. Our experimental result is underestimated by up to a factor of 2 by semi-empirically calculated rate coefficients. At plasma temperatures above 10 eV, results of detailed theoretical calculations are available[43] which agree well with the experiment. At lower temperatures, where Ni25+ ions may exist in photoionized plasmas, no data for the DR rate coefficient have been previously available.
In the presence of external electric fields up to 300 V/cm, the measured DR resonance strength is enhanced by a factor 1.5; a rather weak effect in comparison with previous measurements at , 17 and 22. Due to the overall weakness of the field effect for Ni25+ ions, a marked dependence of the DR rate enhancement on the strength of a crossed magnetic field as observed for Cl14+ and Ti19+ ions has not been detectable in the present investigation.
Experimental limitations prevented us from obtaining an energy resolution in our DRF measurements comparable to that achieved in the field-free measurement. Consequently, we could not resolve a Ni DR resonance with high enough to exhibit a field effect. Such an observation would have facilitated a direct comparison with ab initio calculations, which due to the large number of states to be considered, presently can only treat a single manifold of Rydberg states in the presence of crossed and fields[16]. Improvements of this situation can be expected in the near future from the steady increase of computing power on the theoretical side, and on the experimental side from a dedicated electron target which is presently being installed at the TSR. With the electron target and the electron cooler operating at the same time we will be able to perform DRF measurements with continuously cooled ion beams, yielding DRF spectra with increased resolution.
Acknowledgements.
We gratefully acknowledge support by the German Federal Ministry for Education and Research (BMBF) through contracts no. 06 GI 848 and no. 06 HD 854. R. P. acknowledges support by the Division of Chemical Sciences, U.S. Department of Energy under contract DE-FG03-97ER14787 with the University of Nevada, Reno.REFERENCES
- [1] J. Dubau and S. Volonté, Rep. Prog. Phys. 43, 199 (1980).
- [2] A. Müller, in Atomic and Plasma-Material Interaction Data for Fusion, Suppl. to Nucl. Fusion, Vol. 6 (IAEA, Vienna, 1995), pp. 59–100.
- [3] B. W. Shore, Astrophys. J. 158, 1205 (1969).
- [4] A. Burgess, Astrophys. J. 139, 776 (1964).
- [5] A. Burgess, H. P. Summers, Astrophys. J. 157, 1007 (1969).
- [6] V. L. Jacobs, J. Davies, and P. C. Kepple, Phys. Rev. Lett. 37, 1390 (1976).
- [7] Y. Hahn, Rep. Prog. Phys. 60, 691 (1997).
- [8] P. F. Dittner and S. Datz, in Recombination of Atomic Ions, NATO ASI Series, Vol. 296 edited by W. G. Graham, W. Fritsch, Y. Hahn, and J. A. Tanis (Plenum Press, New York, 1992) p. 133.
- [9] L. H. Andersen, in Recombination of Atomic Ions, NATO ASI Series, Vol. 296 edited by W. G. Graham, W. Fritsch, Y. Hahn, and J. A. Tanis (Plenum Press, New York, 1992) p. 143.
- [10] A. Müller, D. S. Belić, B. D. DePaola, N. Djurić, G. H. Dunn, D. W. Mueller, and C. Timmer, Phys. Rev. Lett. 56 127 (1986); Phys. Rev. A 36, 599 (1987).
- [11] K. LaGattuta, I. Nasser, and Y. Hahn, Phys. Rev. A 33, 2782 (1986).
- [12] C. Bottcher, D. C. Griffin, and M. S. Pindzola, Phys. Rev. A 34, 860 (1986).
- [13] A. R. Young, L. D. Gardner, D. W. Savin, G. P. Lafyatis, A. Chutjian, S. Bliman, and J. L. Kohl, Phys. Rev. A 49, 357 (1994); D. W. Savin, L. D. Gardner, D. B. Reisenfeld, A. R. Young, and J. L. Kohl, Phys. Rev. A 53, 280 (1996).
- [14] T. Bartsch, A. Müller, W. Spies, J. Linkemann, H. Danared, D. R. DeWitt, H. Gao, W. Zong, R. Schuch, A. Wolf, G. H. Dunn, M. S. Pindzola, and D. C. Griffin, Phys. Rev. Lett. 79, 2233 (1997).
- [15] F. Robicheaux and M. S. Pindzola, Phys. Rev. Lett. 79, 2237 (1997).
- [16] D. C. Griffin, F. Robicheaux, and M.S. Pindzola, Phys. Rev. A 57, 2708 (1998).
- [17] F. Robicheaux, M. S. Pindzola, and D. C. Griffin, Phys. Rev. Lett. 80, 1402 (1998).
- [18] W. A. Huber and C. Bottcher, J. Phys. B 13, L399 (1980).
- [19] T. Bartsch, S. Schippers, A. Müller, C. Brandau, G. Gwinner, A. A. Saghiri, M. Beutelspacher, M. Grieser, D. Schwalm, A. Wolf, H. Danared, and G. H. Dunn, Phys. Rev. Lett. 82, 3779 (1999).
- [20] T. Bartsch et al., to be published; T. Bartsch, Dissertation, University of Giessen (1999).
- [21] V. Klimenko, L. Ko, and T. F. Gallagher, Phys. Rev. Lett. 83, 3808 (1999).
- [22] D. C. Griffin and M. S. Pindzola, Phys. Rev. A 35, 2821 (1987).
- [23] C. Brandau, F. Bosch, G. Dunn, B. Franzke, A. Hoffknecht, C. Kozhuharov, P. H. Mokler, A. Müller, F. Nolden, S. Schippers, Z. Stachura, M. Steck, T. Stöhlker, T. Winkler, and A. Wolf, Hyperf. Int. 114, 45 (1998).
- [24] E. Jaeschke, D. Krämer, W. Arnold, G. Bisoffi, M. Blum, A. Friedrich, C. Geyer, M. Grieser, D. Habs, H. W. Heyng, B. Holzer, R. Ihde, M. Jung, K. Matl, R. Neumann, A. Noda, W. Ott, B. Povh, R. Repnow, F. Schmitt, M. Steck, and E. Steffens, in Proceedings of the European Particle Accelerator Conference, Rome, 1988 ed. by S. Tazzari (World Scientific, Singapore, 1989) p. 365.
- [25] A. Müller and A. Wolf, in Accelerator-Based Atomic Physics Techniques and Applications, ed. by J. C. Austin and S. M. Shafroth (AIP Press, Woodbury, New York, 1997) p. 147.
- [26] A. Müller, Phil. Trans. R. Soc. Lond. A 357, 1279 (1999).
- [27] S. Schippers, Phys. Scr. T80, 158 (1999).
- [28] A. Wolf, G. Gwinner, J. Linkemann, A. A. Saghiri, M. Schmitt, D. Schwalm, M. Grieser, M. Beutelspacher, T. Bartsch, C. Brandau, A. Hoffknecht, A. Müller, S. Schippers, O. Uwira, and D. W. Savin, Nucl. Instrum. Meth. Phys. Res. A, in print.
- [29] G. Kilgus, D. Habs, D. Schwalm, A. Wolf, N. R. Badnell, and A. Müller, Phys. Rev. A 46, 5730 (1992).
- [30] A. Lampert, A. Wolf, D. Habs, J. Kenntner, G. Kilgus, D. Schwalm, M. S. Pindzola, and N. R. Badnell, Phys. Rev. 53, 1413 (1996).
- [31] M. Grieser, M. Blum, D. Habs, R. V. Hahn, B. Hochadel, E. Jaeschke, C. M. Kleffner, M. Stampfer, M. Steck, and A. Noda, in Cooler Rings and their Applications, ed. by T. Katayama and A. Noda (World Scientific, Singapore, 1991) p. 190.
- [32] S. Pastuszka, U. Schramm, M. Grieser, C. Broude, R. Grimm, D. Habs, J. Kenntner, H.-J. Miesner, T. Schüßler, D. Schwalm, and A. Wolf, Nucl. Instrum. Meth. A 369, 11 (1996).
- [33] B. Hochadel, F. Albrecht, M. Grieser, D. Habs, D. Schwalm, E. Szmola and A. Wolf, Nucl. Instrum. Meth. A 343, 401 (1994).
- [34] G. Miersch, D. Habs, J. Kenntner, D. Schwalm, and A. Wolf, Nucl. Instrum. Meth. A 369, 277 (1996).
- [35] H. A. Bethe and E. E. Salpeter, Quantum Mechanics of One- and Two-Electron Atoms (Springer-Verlag, Berlin, 1957).
- [36] L. H. Andersen and J. Bolko, Phys. Rev. A 42, 1184 (1990).
- [37] H. Hinnov and the TFTR Operating Team, B. Denne and the JET Operating Team, Phys. Rev. A 40, 4357 (1989).
- [38] A. Müller and A. Wolf, Hyperf. Int. 107, 233 (1997).
- [39] J.-G. Wang, T. Kato, and I. Murakami, Phys. Rev. A 60, 2104 (1999).
- [40] R. D. Cowan, Theory of Atomic Structure and Spectra (University of California Press, Berkeley, 1981).
- [41] A. Burgess, Astrophys. J. 141, 1588 (1965).
- [42] R. Mewe, J. Schrijver, and J. Sylwester, Astron. Astrophys. 87, 55 (1980).
- [43] C. J. Romanik, Astrophys. J. 330, 1022 (1988). An obvious misprint in the NiXXVI entry of Table 3 is . It should read . This value has been used to plot the curves in Fig. 5 of the present paper.
- [44] H. Teng, B. Sheng, W. Zhang, and Z. Xu, Phys. Scr. 49, 463 (1994).
- [45] M. H. Chen, Phys. Rev. A 44, 4215 (1991).
- [46] D. W. Savin, T. Bartsch, M. H. Chen, S. M. Kahn, D. A. Liedahl, J. Linkemann, A. Müller, S. Schippers, M. Schmitt, D. Schwalm, and A. Wolf, Astrophys. J. (Lett.) 489, L115 (1997).
- [47] I. Nasser and Y. Hahn, Phys. Rev. A 36, 4704 (1987).
- [48] D. C. Griffin, D. Mitnik, M. S. Pindzola, and F. Robicheaux, Phys. Rev. A 58, 4548 (1998).
| resonance position | resonance strength | designation | ||
| (eV) | (eV cm2) | |||
| ± | ± | |||
| ± | ± | |||
| ± | ± | |||
| ± | ± | |||
| ± | ± | |||
| ± | ± | |||
| ± | ± | |||
| ± | ± | |||
| ± | ± | |||
| ± | ± | |||
| ± | ± | |||
| ± | ± | |||
| ± | ± | |||
| ± | ± | |||
| ± | ± | |||
| ± | ± | |||
| ± | ± | |||
| ± | ± | |||
| ± | ± | |||
| ± | ± | |||
| ± | ± | |||
| ± | ± | |||
| ± | ± | |||
| ± | ± | |||
| ± | ± | |||
| ± | ± | |||
| ± | ± | |||
| ± | ± | |||
| ± | ± | |||
| ± | ± | |||
| ± | ± | |||
| ± | ± | |||
| ± | ± | |||
| ± | ± | |||
| ± | ± | |||
| ± | ± | |||
| ± | ± | |||
| ± | ± | |||
| ± | ± | |||
| ± | ± | |||
| ± | ± | |||
| ± | ± | |||
| ± | ± | |||
| ± | ± | |||
| series | ||||
|---|---|---|---|---|
| (eV), spectroscopic | ||||
| (eV), this experiment | ||||
| (1015 s-1) | ||||
| (109 s-1) | ||||
| (1013 s-1) | ||||
| (10-27 eV2 cm2 s) | ||||
| 1 | ||
|---|---|---|
| 2 | ||
| 3 | ||
| 4 | ||
| 5 |
| Ion | Reference | ||||
|---|---|---|---|---|---|
| Cl14+ | [19] | 23 | 18 | 79 | |
| Ti19+ | [20] | 27 | 27 | 115 | |
| Ni25+ | [this work] | 31 | 31 | 150 | |