Pattern formation in inclined layer convection
Abstract
We report experiments on thermally driven convection in an inclined layer of large aspect ratio in a fluid of Prandtl number . We observed a number of new nonlinear, mostly spatio-temporally chaotic, states. At small angles of inclination we found longitudinal rolls, subharmonic oscillations, Busse oscillations, undulation chaos, and crawling rolls. At larger angles, in the vicinity of the transition from buoyancy- to shear-driven instability, we observed drifting transverse rolls, localized bursts, and drifting bimodals. For angles past vertical, when heated from above, we found drifting transverse rolls and switching diamond panes.
pacs:
47.54.+r, 47.27.Te, 47.20.Bp, 47.20.Ft, 47.20.-k, 05.45.JnRayleigh-Bénard convection (RBC) of a vertical fluid layer heated from below has long served as a paradigm for pattern forming systems [3, 4]. Variations that alter the symmetries, such as rotation around a vertical axis [5, 6] and vertical vibrations [7] continue to lead to important insights. Another case, of particular meteorological and oceanographic interest, is RBC of a fluid layer inclined with respect to gravity. This system is not only well suited for the study of buoyancy and shear flow driven instabilities, but may also serve, along with liquid crystal convection [8], as a paradigm for anisotropic pattern forming systems.
As with RBC, the onset of inclined layer convection (ILC) occurs when the temperature difference, , across the layer is sufficient for convection rolls to form. The main difference from RBC is that, in ILC, the patternless base state is characterized not only by a linear temperature gradient but also by a symmetry-breaking shear flow. As shown in Fig. 1, the component of gravity tangential to the fluid layer, , causes buoyant fluid to flow up along the warm plate and down along the cold plate. For small angles of inclination , buoyancy dominates over shear flow ( large, small), and the primary instability is to longitudinal rolls (LR) whose axes are aligned with the shear flow direction [9]. With increasing , buoyancy effects decrease and for buoyancy is stabilizing. Above a critical angle () the shear flow causes a primary instability to transverse rolls (TR) with roll-axes perpendicular to the shear flow [9]. The few prior experiments [10, 11, 12] on ILC showed reasonable agreement with the linear theory [9, 13, 14, 15]. These experiments also demonstrated that LR are unstable to some form of undulations [10, 11, 12], in qualitative agreement with theory [14, 15], but the quantitative details of the state were inaccessible due to experimental limitations.
Here we report the first experimental results on pattern formation in ILC for large aspect-ratio systems in a range of inclination angles , i.e., from horizontal (heated from below) to past vertical (heated from above). We found many unpredicted states when increasing above the critical temperature difference. For we observed longitudinal rolls, subharmonic oscillations, Busse oscillations, undulation chaos, and crawling rolls. In the neighborhood of the codimension two point [13] for thermal and shear driven instability (), we observed drifting bimodals, drifting transverse rolls, and localized longitudinal and transverse bursts. For inclinations we found drifting transverse rolls, switching diamond-panes, and longitudinal bursts. Most of these novel states were spatio-temporally chaotic and were found very close to onset, where theoretical progress should be possible.
Experiment: Our experimental apparatus consisted of a water-cooled pressure chamber containing a convection cell of diameter 10 cm, subdivided into two large aspect ratio rectangular cells. The experimental design was similar to the one described in [16]. The optically flat upper and lower plate of the convection cell consisted of cm thick single crystal sapphire and single crystal silicon, respectively. The sapphire plate was cooled by a water bath, while the silicon plate was heated by an electric film heater. The convection patterns were visualized by the usual shadowgraph technique [16]. The sidewalls were constructed of 9 layers of notebook paper, providing the best possible thermal matching between cell boundaries and the fluid. As measured interferometrically, the plates were parallel to m. The convection cell was housed in a pressure chamber, which held both the cooling water and the convecting gas to () bar, regulated to bar. The temperatures of the two plates were regulated to C. Throughout the experiment the mean temperature was kept constant at C. We determined the cell height by measuring the pattern wavenumber at onset for and comparing it with the theoretical value of . We found m and = m for two sets of experiments. The two convection cells had a size and . For all data, the Prandtl number was as determined from [16], with the kinematic viscosity and thermal diffusivity . The vertical thermal diffusion time was s. Inclines from (horizontal) to ( past vertical) were possible, with an accuracy of . Following [4] we calculated the Boussinesq number for the corresponding horizontal layer to estimate non-Boussinesq effects. At for we found , putting the flow into the Boussinesq regime. For larger angles increased linearly to 3.0 for the largest temperature differences investigated. We observed the same convective patterns in both convection cells.
Onset of convection: In ILC, the forward bifurcation to LR is predicted to occur at the critical Rayleigh number where ( is the thermal expansion coefficient and is the critical temperature difference). The threshold for the forward bifurcation to shear driven TR at large inclination angle is more complicated, and can only be determined numerically [14, 15, 17].
We determined for convection by quasi-statically increasing in steps of 1 mK every minutes past the point where convection was observable and then decreasing the temperature difference similarly. For all angles we observed forward bifurcations. Figure 2 shows the measured , as well as the theoretically predicted onsets for both the buoyancy-driven (longitudinal) and the shear-driven (transverse) instabilities [17]. We found agreement with theory for the onset of LR: the experimentally observed value was with . We did not, however, observe the theoretically predicted stationary TR, but instead drifting TR (DTR) at a slightly larger critical Rayleigh number. The drift down the incline may be attributed to the broken symmetry across the layer which is caused by the temperature dependence of the fluid parameters (non-Boussinesq effects). Very interesting is the vicinity of the theoretically predicted codimension two point at [17], where LR and TR have the same onset value. Experimentally, we found a forward bifurcation to DTR above , and in the range DTR lost stability to drifting bimodals (DB) above . As shown in Fig. 3, DB consist of a superposition of LR and DTR. Here is the reduced control parameter. Theoretically, Fujimura and Kelly [13] predicted a forward bifurcation to transverse rolls, which lose stability to bimodals at in a narrow angular region. We find good agreement with these predictions, but with the difference that the experimentally observed patterns are drifting.
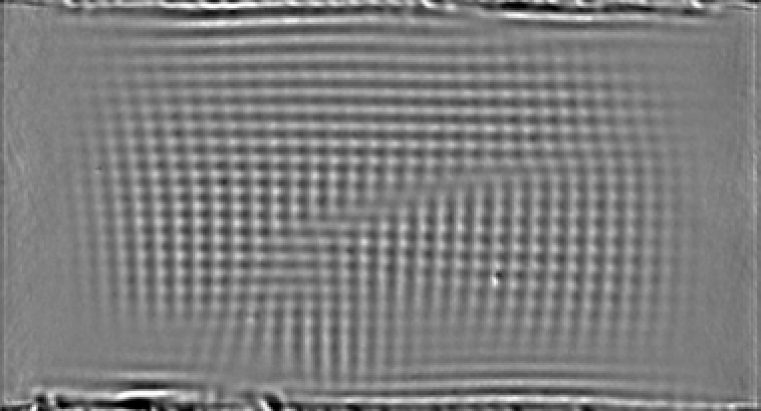
Nonlinear states: Figure 4 shows the measured phase boundaries for the ten observed nonlinear convective states. At low angles (), LR are stable up to above which the novel state of subharmonic oscillations (SO) sets in. These oscillations are characterized by a pearl-necklace-like pattern of bright (cold) spots that travel along a standing wave pattern of wavy rolls. As shown in Fig. 5, these oscillations appear in patches whose location changes in time. Typical frequencies of the oscillations were measured to be 1 to 3 cycles per . A recent theoretical analysis has shown agreement with this value [20]. With further increase in , localized patches of traveling oscillations burst intermittently. Within the amplitude of the rolls’ waviness increases, the pattern tears transverse to the rolls as shown in the upper left corner of Fig. 5, and fades away leaving an almost parallel roll state.
For and , we observed patches of the well-known Busse oscillations (BO) coexisting with patches of the SO. As shown by the dotted line in Fig. 4, our data for the onset of the BO agrees well with the theoretical prediction calculated for [14]. It is surprising, however, that both oscillations (SO and BO) coexist as localized patches in the same cell.
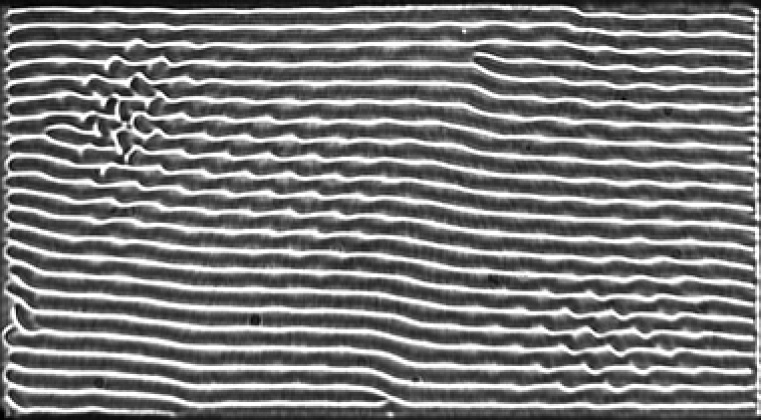
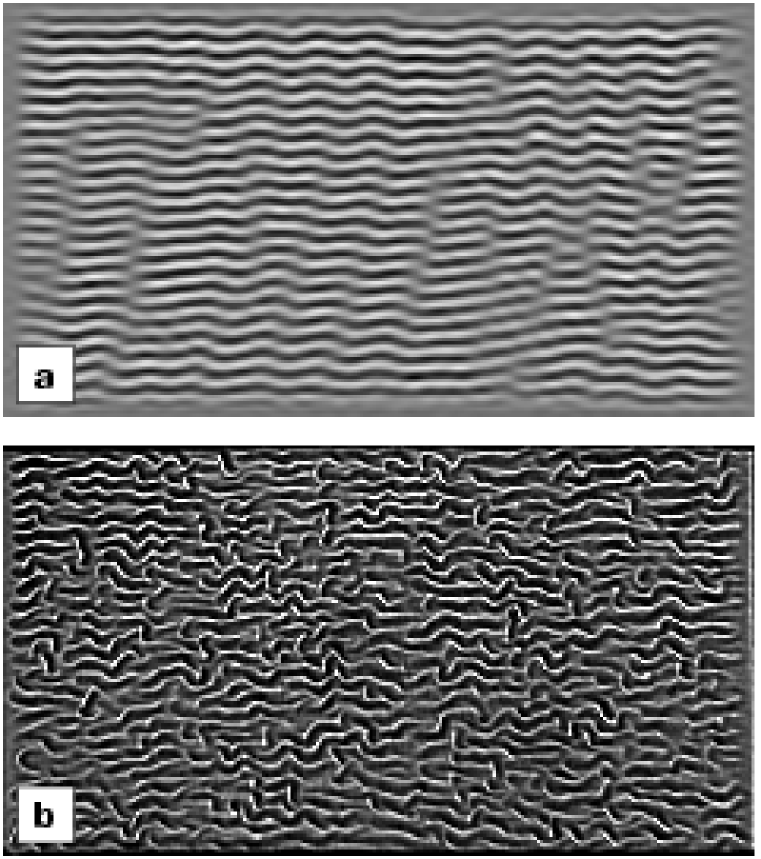
At intermediate angles (), where the initial instability is to LR we found with increasing that LR were unstable to undulations. Although the experimentally determined value for the instability agrees well with the theoretical prediction (see Fig. 4) [14, 15, 17], we did not observe a stationary pattern of undulations, but a defect-turbulent state of undulation chaos (UC). A snapshot of UC is shown in Fig. 6a. At , the UC begins to “twitch” in the direction transverse to the rolls on time scales . With increasing , the amplitude of the twitching increases and the rolls eventually tear, with the ends “crawling” in the direction transverse to the original rolls. A snapshot of crawling rolls (CR) is shown in Fig. 6b.
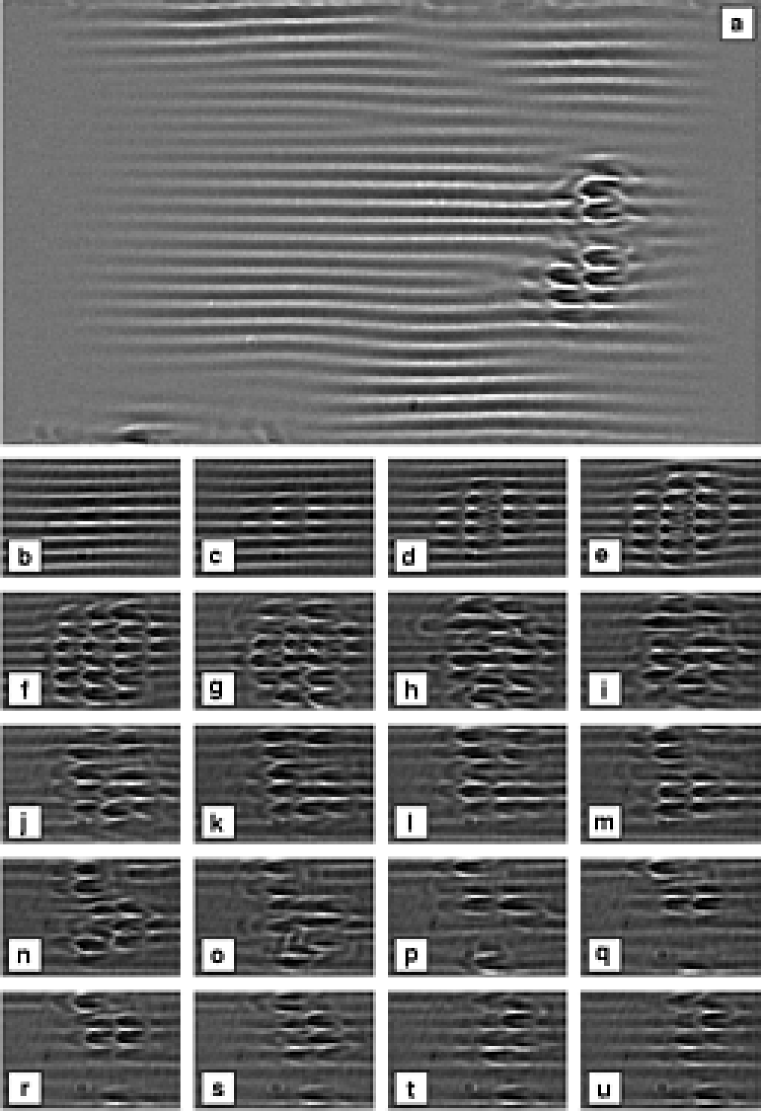
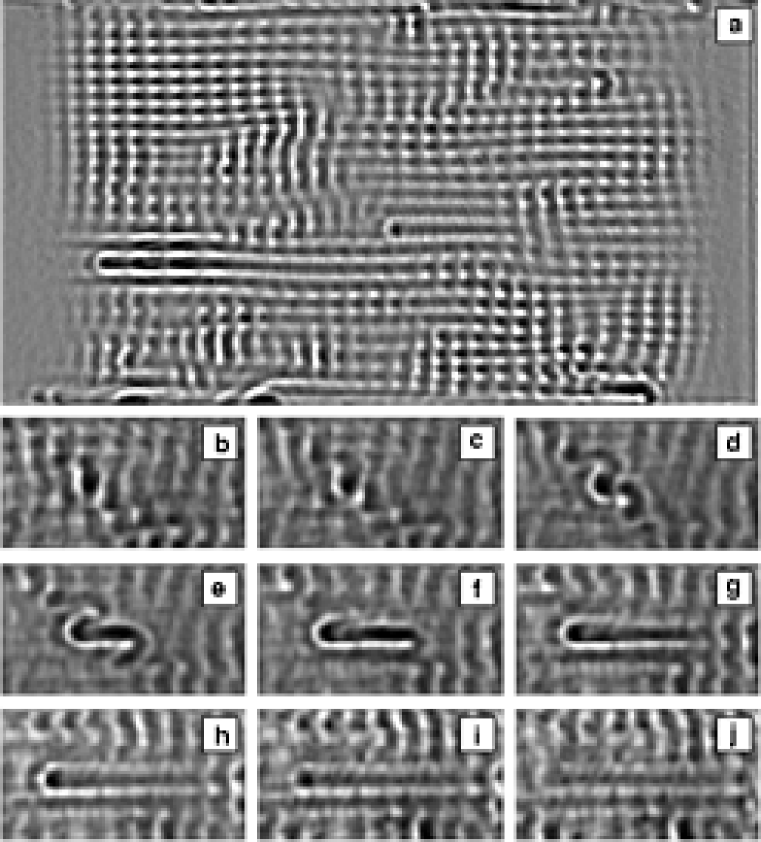
In the vicinity of the codimension-two point, at , we observed drifting bimodals quite close to onset. As shown in Fig. 4, for small angles the existence region of the pure DB is limited by localized transverse bursts (TB), while for large angles by DTR. A snapshot of transverse bursts and the evolution of a single burst is shown in Fig. 7. In this region of phase space the LR occur in patches that grow and decay intermittently while TB nucleate in high amplitude LR-regions. As shown in the time series in Fig. 7, TB grow over the period of a few and then decay rapidly. Above the DB are unstable to localized longitudinal bursts (LB) as shown in Fig. 8a. As shown in Fig. 8b–j, a few longitudinal rolls grow locally to large amplitude and then quickly fade. With both types of bursts, the bursts increase both in density and frequency when is increased, eventually developing into a turbulent state at .
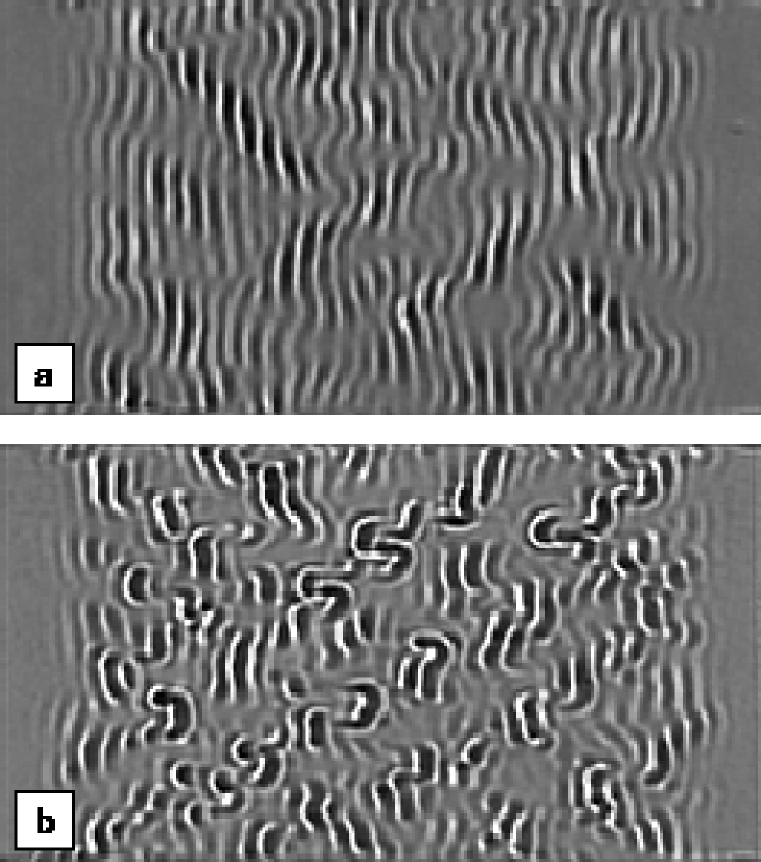
Past , we continued to observe shear driven convection patterns. DTR are the primary instability; however, they are unstable to switching diamond panes (SDP) at . The state is characterized by spatio-temporally chaotic switching on time-scales of from to of large amplitude regions of DTR, as seen in Fig. 9a. At SDP are unstable to LB, which in this region of phase space are denser but travel less distance than in TR, as shown in Fig. 9b.
Conclusion: Inclined layer convection in the weakly nonlinear regime displays a rich phase diagram, with ten different states accessible over the range of parameters investigated. The phase space naturally divides into several regions of characteristic behavior which have so far been characterized semi-quantitatively. All states but longitudinal and transverse rolls are spatio-temporally chaotic. Most instabilities occurred very close to onset and further theoretical description should be possible. Especially interesting is the bursting behavior, which may be related to turbulent bursts in other shear flows [21].
We thank F. H. Busse and W. Pesch for important discussions on the stability curves and theoretical descriptions of various states. E.B. acknowledges the kind hospitality of Prof H. Levine at the University of California at San Diego where part of this manuscript was prepared. We gratefully acknowledge support from the NSF under grant DMR-9705410.
REFERENCES
- [1] Presently at Center for Nonlinear Dynamics, University of Texas at Austin
- [2] Email: eb22@cornell.edu
- [3] M. C. Cross and P. C. Hohenberg, Rev. Mod. Phys. 65, 851 (1993).
- [4] E. Bodenschatz, W. Pesch, and G. Ahlers, Annu. Rev. Fluid Mech. 32, 709 (2000).
- [5] K. M. S. Bajaj, J. Liu, B. Naberhuis, and G. Ahlers, Phys. Rev. Lett. 81, 806 (1998).
- [6] Y. Hu, W. Pesch, G. Ahlers, and R. E. Ecke, Phys. Rev. E 58, 5821 (1998).
- [7] J. L. Rogers, M. F. Schatz, J. L. Bougie, and J. B. Swift, Phys. Rev. Lett. (to be published).
- [8] L. Kramer and W. Pesch, Annu. Rev. Fluid Mech. 27, 515 (1995).
- [9] Y. Chen and A. J. Pearlstein, J. Fluid Mech. 198, 513 (1989) and references therein.
- [10] J. E. Hart, J. Fluid Mech. 47, 547 (1971).
- [11] D. W. Ruth, G. D. Raithby, and K. G. T. Hollands, J. Fluid Mech. 96, 481 (1980).
- [12] J. N. Shadid and R. J. Goldstein, J. Fluid Mech. 215, 61 (1990) and references therein.
- [13] K. Fujimura and R. E. Kelly, J. Fluid Mech. 246, 545 (1993); in Bifurcation Phenomena and Chaos in Thermal Convection, edited by H. H. Bau, L. A. Bertram, and S. A. Korpela, ASME: HTD, 214, 73, (1992).
- [14] R. M. Clever and F. H. Busse, J. Fluid Mech. 81, 107 (1977).
- [15] F. H. Busse and R. M. Clever, J. Eng. Math. 26, 1 (1992).
- [16] J. R. de Bruyn, et al., Rev. Sci. Instrum. 67, 2043 (1996).
- [17] W. Pesch (private communication).
- [18] MPEG movies of spatio-temporally chaotic states are available at http://milou.msc.cornell.edu/ILCmovies.
- [19] K. E. Daniels and E. Bodenschatz (unpublished).
- [20] F. H. Busse and R. M. Clever (private communication).
- [21] E. Knobloch and J. Moehlis, in Pattern formation in continuous and coupled systems, edited by M. Golubitzki, D. Luss, and S. H. Strogatz (Springer-Verlag, Berlin, 1999).