Abnormal Rolls and Regular Arrays of Disclinations in Homeotropic Electroconvection
Abstract
We present the first quantitative verification of an amplitude description for systems with (nearly) spontaneously broken isotropy, in particular for the recently discovered abnormal-roll states. We also obtain a conclusive picture of the 3d director configuration in a spatial period doubling phenomenon involving disclination loops (CRAZY rolls). The first observation of two Lifshitz frequencies in electroconvection is reported.
pacs:
47.54.+r, 61.30.Gd, 47.20.Ky, 47.20.LzElectroconvection (EC) in thin () layers of nematic liquid crystals (LC) is an important model system for developing and experimentally testing tools for the description of complex, extended pattern-forming systems [1]. In particular, reductive perturbation methods like the weakly nonlinear amplitude formalism are often employed to describe the behavior slightly above the primary threshold.
EC offers the unique chance to extend the method such that it also captures the secondary instabilities and even the behavior further on, including complex spatio-temporal states. Then, however, not only the (complex) amplitude of the convective mode has to be taken into account explicitly, but also the slowly varying in-plane orientation of the nematic director at mid plane (, axis normal to the LC layer) [2, 3, 4].
We consider the common situation where below the threshold of convection is homogeneously oriented along by some external force. This is done either by planar surface anchoring [5, 6] or, in our case of homeotropic anchoring [7, 8], by a magnetic field . As the ac voltage applied across the layer is carried through the threshold of normal roll (NR) convection, determines the orientation of the wave vector of the pattern. At a finite distance above threshold, is destabilized by hydrodynamic forces [9, 3] exerted by the convection rolls. While the wave vector and the optical appearance of the resulting abnormal rolls (ARs) may remain similar to that of NRs, has now a nonzero angle with respect to the axis.
This phenomenon is general: it occurs not only in the conduction regime investigated here, but also in the higher-frequency dielectric range [10], as well as for heat induced (Rayleigh-Bénard) convection [5].
The idea of the present work is to keep the AR threshold small, in order to verify quantitatively a recently proposed weakly nonlinear model [2, 4]. This is possible in the homeotropic geometry, where, in the limit , the nematic director acquires its in-plane component () by spontaneously breaking isotropy in a Freedericksz transition at a finite voltage [7]. Then, for small , is small, too.
We describe below a newly designed experimental setup for determining the angle between and , discuss the experimental results and their interpretation in terms of the nonlinear model and conclude with a brief characterization of the complicated structure we call CRAZY rolls (convection in a regular array of - disclination loops), a spatial period doubling phenomenon.
The polarizers in the optical setup [source of parallel white light – polarizer – sample (thermostated at ) – analyzer (removable) – long range microscope – CCD camera – frame grabber (256 graylevels) – PC] could be independently rotated by step motors in steps of . Stepping was synchronized to the video frequency, which limited the rotation rate (and the temporal resolution) to . The nematic LC Phase 5A (Merck) was used, which contains a dissolved surfactant to ensure the homeotropic alignment. We measure the applied magnetic field directly in units of the bend Freedericksz threshold . Thus the small uncertainty in the (directly measured) cell thickness is eliminated.
Surprisingly, though in agreement with a numerical stability analysis of the full hydrodynamic equations [9] redone for Phase 5 material parameters (listed in [11]), we find NRs for low frequencies and high frequencies , while between the two Lifshitz points rolls at the convection threshold are degenerate to two oblique modes (wave vectors ). In all previously investigated EC systems, at most one Lifshitz point () was found. The dielectric regime, for technical reasons, was not accessible in the present experiment.
The only fitting parameter, the conductivity was adjusted to match with theory, keeping [12] fixed as usual. Absolute values and frequency dependences of experimental threshold voltages and wavenumbers agreed with the theory. At low frequencies the observed obliqueness was larger than predicted (numerically ), which is probably an effect of the vicinity of and in this range.
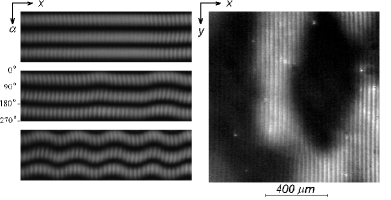
Due to the homeotropic anchoring, deviation of from implies a net rotation of the optical axis (no twist, contrary to the planar case). Thus two optical effects are superimposed in the recorded images. The focusing/defocusing of the extraordinary beam (i.e. polarizer orientation ) by the periodic tilt modulations of in the roll pattern yields the characteristic stripe pattern (shadow graph, at the selected focus plane the spatial harmonics with wavenumbers dominate over higher harmonics), while, with crossed polarizers only, there is an extinction of all incident light at or (dark patches in Fig 1, right). Although both effects are sensitive to , the second one leads to its more accurate determination, while the first effect with parallel polars gave better results for the contrast connected with the pattern amplitude .
For a systematic analysis of the state at a given and , a single line () of the video image was recorded as a function of , with parallel as well as with crossed polars. The resulting maps allow direct visualization of spatial modulations of . Figure 1 (left) demonstrates the transition from NRs (straight extinction lines, top left) to ARs with increasing . Near the AR domains possess an irregular ”patchy” distribution (middle left and right side of Fig. 1) with slow, persistent dynamics, while at higher an almost periodic AR domain structure is preferred (bottom left).
Around each point on the line, intervals of a fixed width larger than the pattern wavelength were selected to calculate the average graylevel for crossed, and the difference between the maximum and the minimum graylevel (the variation) for parallel polars. As functions of an LMS fit to for the average graylevel yields the director orientation (and also ), while from the fit of the variation to we obtained the quantity connected with the pattern amplitude, i.e. with the periodic variations of the tilt angle. This scheme allows absolute measurements of with an accuracy of .
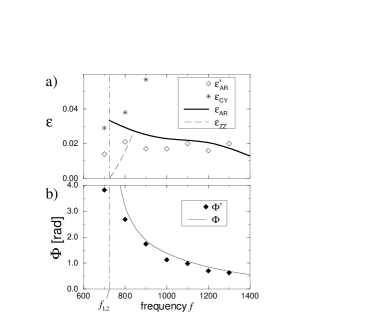
A typical result for the average of over as a function of is shown in Fig. 2a. Three ranges can be distinguished. The subcritical range (), where is dominated by noise, then a relatively fast increase of with , up to a voltage that corresponds to (see below), and a slow decrease for higher voltages. The transition between the subcritical and the increasing range was used to determine the threshold (). The uncertainty in due to small imperfections of the sample is a major source of experimental error.

The measured values for the maximum and minimum of the director deflection (see Fig. 2b) clearly expose a supercritical pitchfork bifurcation at some finite distance from threshold. The scatter in the data is mainly due to migration of defects and of domain boundaries. The bifurcation was characterized by fitting (LMS) the function
| (1) |
to the data. The frequency dependence of the fitting parameters and is shown in Figs. 3a,b.
We now compare with the relevant predictions of the above mentioned weakly nonlinear description valid for small and
| (3) | |||||
| (5) | |||||
(all coefficients are real and, except for and , positive; they have been calculated for our material, see [2] for details). For the amplitude of rolls with wave vector one has . Since turns out to be negative for all materials explored so far, is uniquely determined only for small . For , there is at a transition (supercritical pitchfork) from NRs with to ARs with , i.e. Eq. (1) with , . Remarkably, though ARs are an essentially nonlinear effect, depends only on coefficients relating to the convection threshold. This is a consequence of the rotational symmetry underlying the theory (for ). The strong increase of for lower frequencies (see Fig. 3b) is due to a decrease of ( for ). The amplitude of abnormal patterns with is independent of in the model, which corresponds to the slow decrease of in Fig. 2a. For the pitchfork becomes imperfect and a saddle-node at remains. For the new stable branch arising in this bifurcation (for modulation instabilities see below) one has , which we then consider the defining property of ARs. For the continuous (“normal”) branch always .
There are two kinds of long-wavelength modulation instabilities [4, 2]. Firstly, an Eckhaus-type instability which is presumably not relevant for the present experiments, and secondly a zig-zag (or undulatory) instability, which destabilizes NRs only if and , where . As in planar systems [5, 3, 6], as . If , NRs or ARs with not too large should be stable. Although from the hydrodynamic equations we do find (numerically) for frequencies , in the experiments some defects were usually present at all frequencies and voltages. In the stable region they are probably generated at unavoidable inhomogeneities in the sample and not by an intrinsic instability. Effects from the zig-zag instability can be excluded for because in that regime the rolls remain perfectly straight when passing through the transition. For lower frequencies some phase modulations were observable which may, however, be connected with the fact that is rather small in that range.
The rather large discrepancy between and in Fig. 3a near is still within the experimental uncertainties. The good match between and could be slightly fortuitous in view of the fact that relates to regular ARs (at ), while the experimental AR domains were of finite size and contained defects. Relaxation of towards large domains (coarsening) is prevented by the coupling to the phase of the pattern.
When exceeds , which we observed only for , there is a further transition at (see Fig. 3a), which extends also into the oblique-roll range. Disclination loops in the plane (CRAZY rolls), appearing as dark lines stretched in direction, propagate into the image (Fig. 4a). Each of them replaces one pair of convection rolls. They may form a periodic structure leaving gaps of width between them, but sometimes some loops are left out. Then, either usual convection rolls fill the space, or there is an additional modulation in with a period of (Fig. 4a).
Using the rotating-polarizer setup we see that rotates by about (from to , or vice versa) at each loop. In neighboring loops the rotation direction alternates. This doubles the period of the structure () compared to usual convection rolls (a recent, similar observation was interpreted very differently [13]). Since the threshold for the creation of CRAZY rolls is above the EC threshold (Fig. 3a) and they disappear for , we conclude that the conductive Carr-Helfrich convection mechanism is essential for these structures. This is why we call them CRAZY rolls, in distinction to arrays of disclinations of (presumably) flexoelectric origin [14].
The structure of CRAZY rolls is most easily understood by studying first the slowly relaxing state obtained after the voltage is reduced below the EC threshold, see Fig. 4b. There are two domains of oppositely tilted Freedericksz deformed states ( parallel and antiparallel to ) separated by different kinds of walls. In the lower part, there is a regular Bloch wall, where rotates around the axis from one orientation to the other (note the umbilic that separates two symmetry-equivalent variants). In the upper part there is an Ising type wall (mostly twist), where remains along the axis of . for all in the wall center, which requires disclination lines to run along the top and bottom boundary of the sample (which is favored for a weak director anchoring [15] as is probably the case in our sample).
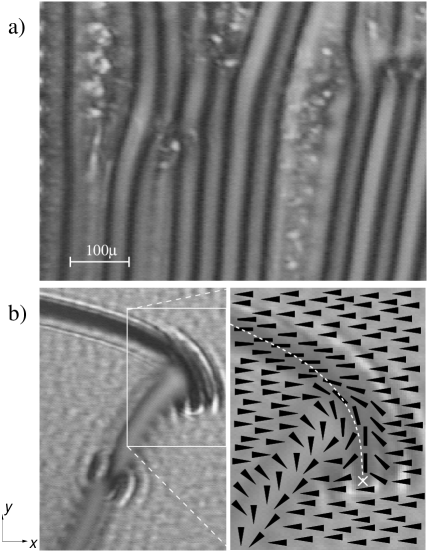
The tip of the disclination loop, which extends slightly beyond the Ising wall (up to the white cross in Fig. 4b), has the topology of the essential building block of a CRAZY roll. For higher voltages it evolves continuously towards one of the black lines of CRAZY rolls. It contains both, the rotation of from the Bloch wall (though in periodic CRAZY rolls does not rotate all the way to the axis) and the twist from the Ising wall, and is thus topologically neutral with respect to the field. The complete variation of in midplane when passing through a CRAZY loop is approximately given by a rotation of in some plane parallel to the axis.
At higher frequencies and with increasing , chevron-like patterns arise (rather than CRAZY rolls). At small (vanishing) magnetic fields such chevrons can be observed near (at) threshold [16].
In summary: using the rotating polarizer setup we could solve two problems of very different nature: a quantitative test of a highly nontrivial model for pattern formation in anisotropic systems and a clarification of the 3d structure of CRAZY rolls.
We wish to thank W. Pesch for support and discussions. Financial support by the Japan Society for the Promotion of Science (P98285), the Hungarian Research Grants No. OTKA-T014957, OTKA-T022772, and the EU TMR Research Network ”Patterns, Noise and Chaos” is gratefully acknowledged.
REFERENCES
- [1] L. Kramer and W. Pesch, in Pattern Formation in Liquid Crystals, edited by Á. Buka and L. Kramer (Springer-Verlag, New York, 1996).
- [2] A. G. Rossberg, A. Hertrich, L. Kramer, and W. Pesch, Phys. Rev. Lett. 76, 4729 (1996).
- [3] E. Plaut and W. Pesch, Phys. Rev. E 59, 1747 (1999).
- [4] A. G. Rossberg, Dissertation, Univ. Bayreuth, 1997.
- [5] E. Plaut et al., Phys. Rev. Lett 79, 2367 (1997).
- [6] S. Rudroff, H. Zhao, L. Kramer, and I. Rehberg, Phys. Rev. Lett. 81, 4144 (1998).
- [7] H. Richter, Á. Buka, and I. Rehberg, Mol. Cryst. Liq. Cryst. 251, 181 (1994).
- [8] J.-H. Huh, Y. Hidaka, and S. Kai, Phys. Rev. E 58, 7355 (1998).
- [9] A. Hertrich, W. Decker, W. Pesch, and L. Kramer, J. Phys. France II 2, 1915 (1992).
- [10] H. Amm, R. Stannarius, and A. G. Rossberg, Physica D (1998), in press.
- [11] M. Treiber, N. Éber, Á. Buka, and L. Kramer, J. Phys. II France 7, 649 (1997).
- [12] In nematics, second rank material tensors have the form ; .
- [13] C. Fradin, P. L. Finn, H. R. Brand and P. E. Cladis, Phys. Rev. Lett. 81, 2902 (1998).
- [14] H. Hinov and L. Vistin, J. Phys. (Paris) 40, 269 (1979).
- [15] R. B. Meyer, Solid State Comm. 12, 585 (1973).
- [16] A. G. Rossberg and L. Kramer, Physica D 115, 19 (1998); P. Toth, Á. Buka, J. Peinke und L. Kramer, Phys. Rev. E58, 1983 (1998).