A next-to-next-to-leading-order transition operator in chiral perturbation theory
Abstract
We discuss the results of a systematic calculation of the next-to-next-to-leading-order amplitude for the S-wave production at the threshold in heavy-baryon chiral perturbation theory. We find six new diagrams, two of which can be viewed as vertex corrections, of 15 - 20 %, to the -exchange graph, whereas the rest are much larger, one exceeding 900 %. We discuss the reasons for this enhancement, as well as the steps necessary to be taken before the final comparison with experiment.
1 Introduction
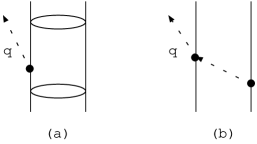
Neutral pion production in proton-proton collisions near threshold needs no special introduction in the present section of these proceedings. The fact that the two dominant terms in the hamiltonian, the P-wave emission from a nucleon and the Weinberg-Tomozawa term are forbidden by the selection rules demands an exploration of the less-well-known subdominant terms in the hamiltonian. One of these terms goes by the name of the Galilean term for an S-wave pion emission operator, Fig. 1(a) and is common to all nonrelativistic theories, as is the isospin-symmetric part of the elastic scattering amplitude, Fig. 1(b). Since the exchanged in Fig. 1(b) is off-shell, this graph is sensitive to the off-shell extrapolation of the amplitude, which is not unique, however. All terms subdominant to the ones above are model-dependent. Precise cross section data measured in Bloomington [1] and Uppsala [2] are roughly five times larger [3] than the simplest widely agreed-on prediction of the two diagrams in Fig. 1.
One systematic proposal for corrections to graphs in Fig. 1 is based on the underlying chiral symmetry of the strong interactions and goes by the name of heavy-baryon chiral perturbation theory [HBPT]. HBPT generates additional subdominant terms in the hamiltonian that are clearly ordered by means of so-called chiral counting.
This work is subject to the following assumptions: 1. Heavy-baryon chiral perturbation theory This means that we include: (i) only pion and nucleon degrees of freedom, i.e., no mesons heavier than the pion and no nucleon resonances; (ii) static nucleons in loop integrals and non-relativistic external nucleons, i.e., one can use the theory only near the threshold; (iii) well defined chiral order counting; this theory ought to provide smaller and smaller corrections to the leading-order result; (iv) perturbation theory, i.e., a finite number of graphs and counterterms, hence no dynamically created resonances or bound states. 2. Plane-wave initial and final states This means that we do not include the distortions of the initial and final waves, but give a brief discussion of the problems involved and of our present efforts to calculate the distorted wave effects.
2 Results
We present the results of a systematic analysis of next-to-next-to-leading-order amplitude for the production at the threshold in heavy-baryon chiral perturbation theory. We found 19 topologically distinct new types of one-loop diagrams and one rescattering correction, that can potentially contribute to this reaction. The isospin selection rules and the S-wave character of the outgoing pion reduce the number of graphs from 19 to 6 (shown in Fig. 2).
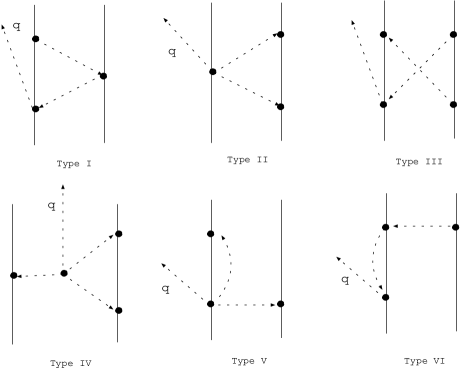
Analytic expressions for these effective transition operators are given in Ref. [4]. In Table I we present our results on the relative importance of the six new types of diagrams, as well as the pion rescattering correction (type VII) that is topologically equivalent to the graph in Fig 1(b), as compared with the one-pion exchange rescattering graph in the plane-wave approximation for the initial and final states.
| I | II | III | IV | V | VI | VII | |
|---|---|---|---|---|---|---|---|
The vertex-correction types of graphs, V and VI, are found to give only small corrections to the lower order result of Fig. 1(b), in conformity with expectations from general tenets of chiral perturbation theory. By contrast, we find very large contributions from the two-pion exchange graphs I - IV. Two of these types of graphs, II and III, cancel to within 1 % at the threshold, though they have very different energy- and momentum transfer dependencies at other kinematics, a point of some importance in distorted wave calculations. These “genuine” one-loop graphs can perhaps be interpreted as a part of an “effective -meson exchange” that is a significant part of an alternative theory based on the suggestion that the subdominant terms are induced by heavier-meson exchanges [3]. The rescattering correction, type VII, is also large.
3 Discussion
Appearance of large individual contributions calls for an explanation. Enhancement of the rescattering diagram VII over the leading-order graph Fig.1.b is perhaps the easiest to understand: The latter is proportional to the energy transfer between the protons which equals at the threshold, whereas the former is proportional to the three-momentum transfer , which is determined by the kinematics of this reaction as .
The one-loop two-pion-exchange diagrams types I - IV, on the other hand, all involve one-loop integrals with two pion (and one nucleon) propagators
| (1) |
In these loop integrals typically corresponds to the four-momentum transfer between the protons, which brings a factor into the numerator accompanied by coming from the vertices, thus resulting in a large enhancement factor, . This explains the large size of the two-pion exchange diagrams, although their precise size is, of course, specific to the diagram.
The deeper reason for the enhancement of both the loop graphs I - IV, and the rescattering graph VII lies in the derivative nature of the pion-nucleon couplings in PT: it is the derivative coupling that puts the loop momentum into the numerator of the integral (1) and, as shown above, and it is the derivative coupling that makes the graph VII grow with the increasing three-momentum exchange .
4 Status of the distorted wave calculation
It is known [5] that the rescattering diagram Fig. 1(b) is sufficiently large to describe the data by itself, but it also interferes with the leading Born diagram Fig. 1(a). The latter gives a non-zero contribution only when evaluated between distorted waves, as four-momentum conservation prevents spontaneous pion emission. Consequently initial and final wave distortions are crucial to any numerical predictions of this reaction’s cross section.
Preliminary work on the distorted-wave amplitude has led us to the following conclusions: (1) the production operator is not square integrable: there are contact terms proportional to Dirac delta functions in configuration space. Consequently, the Fourier transforms from configuration to momentum space and vice versa are ill-defined; (2) the momentum space distorted wave integrals of the production operator receive significant contributions from momenta up to 2 GeV, far beyond the region of applicability of HBPT; (3) combined use of a production operator that requires both energy and momentum transfer and two-proton Schrödinger wave functions that allow only three-momentum transfer can lead to inconsistencies.
We wish to thank Shung-ichi Ando for pointing out an error in our calculation of the rescattering diagram, type VII.
References
- [1] H. O. Meyer et al., Phys. Rev. Lett. 65 (1990) 2846; Nucl. Phys. A539 (1992) 633.
- [2] A. Bondar et al., Phys. Lett. B 356 (1995) 8.
- [3] see C. Hanhart, and K. Tamura, these proceedings; for older literature see T.-S. H. Lee and D. O. Riska, Phys. Rev. Lett. 70 (1993) 2237.
- [4] V. Dmitrašinović, K. Kubodera, F. Myhrer and T. Sato, LANL bulletin board e-print nucl-th/9902048.
- [5] T. Sato, T.-S. Lee, F. Myhrer and K. Kubodera, Phys. Rev. C 56, 1246 (1997).