Microscopic study of freeze-out in relativistic heavy ion collisions at SPS energies
Abstract
The freeze-out conditions in the light (S+S) and heavy (Pb+Pb) colliding systems of heavy nuclei at 160 AGeV/ are analyzed within the microscopic Quark Gluon String Model (QGSM). We found that even for the most heavy systems particle emission takes place from the whole space-time domain available for the system evolution, but not from the thin ”freeze-out hypersurface”, adopted in fluid dynamical models. Pions are continuously emitted from the whole volume of the reaction and reflect the main trends of the system evolution. Nucleons in Pb+Pb collisions initially come from the surface region. For both systems there is a separation of the elastic and inelastic freeze-out. The mesons with large transverse momenta, , are predominantly produced at the early stages of the reaction. The low -component is populated by mesons coming mainly from the decay of resonances. This explains naturally the decreasing source sizes with increasing , observed in HBT interferometry. Comparison with S+S and Au+Au systems at 11.6 AGeV/ is also presented.
pacs:
PACS numbers: 24.10.Lx, 25.75.-q, 25.75.Gz, 25.75.DwI Introduction
The main goal of the high energy heavy-ion experiments at Brookhaven and CERN is to study properties of hot and dense hadronic matter produced in the course of the nuclear collisions. Using the measured final state distributions one tries to reconstruct the dynamical picture of the nuclear reaction and recognize the new phenomena associated with possible quark-hadron phase transition, like Quark-Gluon Plasma (QGP) formation. This can be done by comparison of the experimental data with the predictions of different models. The reaction dynamics and experimental constraints are so complicated at high energies that any single model cannot succeed to reproduce the whole set of data. But the discrepancies between the standard models and the data may help to reveal new phenomena. The recent Pb+Pb experiments at 160 AGeV/ at CERN try to understand whether there is new physics at these high energies in such heavy colliding systems.
There are several groups of models aiming to describe heavy ion collisions at relativistic energies - microscopic string models [1, 2, 3, 4, 5, 6], macroscopic fluid dynamical- [7, 8] and thermal models [9, 10, 11]. The macroscopic models use different ad hoc assumptions concerning the freeze-out stage when particle spectra are calculated for completing for example the fluid dynamical equations, while in microscopic models the freeze-out conditions are obtained automatically without special efforts. A direct comparison of microscopic models with hydrodynamical models is done, e.g., in [12, 13, 14].
In present paper we continue to study the freeze-out conditions in relativistic heavy ion collisions which were initiated earlier [12, 15, 16]. The calculations are carried out within the Quark-Gluon String Model (QGSM) [1, 2] for light (S+S) and heavy (Pb+Pb) systems at 160 AGeV. Below we present the distributions of coordinates and momenta of final state hadrons averaged over the whole ensemble of events. Therefore, we study the one-body characteristics of the reactions disregarding the fluctuations on the level of single events. One should keep this in mind when comparing results with emitting source parameters extracted from the two-body correlation functions in Hanbury-Brown-Twiss (HBT) interferometric measurements [17]. The similar analysis has been done also within the RQMD [18, 19] and the UrQMD [20] models.
II Quark-Gluon String Model
A The main features of the model
The QGSM is based on the Regge- and string phenomenology of particle production in inelastic hadron-hadron collisions at high energies [21, 22]. In application to hadron-nucleus and nucleus-nucleus collisions this picture was supplemented by a proper treatment of the multiple secondary interactions of hadrons (cascades) [23]. The model incorporates the string fragmentation, resonance formation and hadron rescatterings. To keep the model simple we did not consider here any modifications like color fluctuations, mean fields, enhanced cross sections or string fusion. Even without these modifications QGSM reproduces the main features of hadronic and nuclear collisions rather good.
In addition to pions, , and nucleons, , QGSM takes into account vector mesons and low-lying baryon resonances, mostly . Strange particles (K, , ) are also included in the model. Within the QGSM the pion absorption is described by a two-step mechanism, including and reactions. The model describes particle spectra in hadron-hadron (hh) [1, 24], hadron-nucleus (hA) and nucleus-nucleus (AA) collisions [25] quite well but underestimates by a factor of 2-4 the production of strange particles in the case of S+S collisions at SPS energies [2]. The model can be improved by decreasing the formation time of the produced hadrons, by including higher mass baryon resonances and the 3-body channel of pion absorption, , and by increasing the pion absorption cross section, , in dense baryon medium.
The positions and momenta of nucleons inside the nuclei are generated according to the Woods-Saxon density distribution and the Fermi momentum distribution, respectively. Two nucleons with four-momenta and and total center-of-mass (CM) energy squared, , can interact inelastically with the cross section , or elastically with the cross section , when they approach each other closer than . Here is the total cross section (the so-called “black disk” approximation). Pauli blocking is taken into account by excluding of the already occupied final states from the available phase space.
The primary and subsequent interactions of hadrons are simulated by the Monte-Carlo method according to their momenta and positions. In primary inelastic collisions the particles appear mainly through the formation and fragmentation of strings. Due to the uncertainty principle hadrons are formed and can interact further only after some formation time. Those hadrons which contain the valence quarks of the colliding hadrons can interact immediately with the cross section , taken from the additive quark model [26]. Angular and momentum distributions of secondary particles produced in elementary hh collisions are adjusted to available experimental data [27, 28]. In case of lack of the experimental cross sections the one-pion exchange model, detailed balance considerations and isospin symmetry arguments are used. Since the particles loose energy in the course of their rescatterings, after some time they can either interact only elastically or be produced via the resonance decays. Finally, all interactions and decays cease. This stage corresponds to the experimental freeze-out conditions.
In the present paper we compare S+S and Pb+Pb collisions at SPS bombarding momentum, GeV/ per nucleon. This corresponds to GeV, , and CM rapidity . The central AA collisions are traced in the CM frame beginning from the sufficiently early time which has been chosen at the moment when the nuclear centers are separated by two nuclear radii, . The projectile and target nuclei, initially Lorentz contracted by , are propagating with velocities . Due to the Lorentz contraction of nuclei, the first nucleon-nucleon collision occurs at time fm/ in S+S collisions ( fm) and fm/ in Pb+Pb collisions ( fm). Our analysis is based on the statistics of 1000 S+S and 50 Pb+Pb very central events ( fm). The calculations are stopped at fm/ when most of the particles are already in their final states.
B Global kinetic characteristics
It is interesting to see the model predictions for different channels of elementary interactions listed in Table I. According to QGSM the number of elementary interactions in Pb+Pb (S+S) collisions is about 18 500 (410), which is two times larger than that in Au+Au (S+S) collisions at AGeV/. Among them there are 6500 (200) inelastic and 11500 (200) elastic collisions plus 2000 (116) decays of resonances. In Pb+Pb (S+S) central collisions 416 (58) baryons (including the initial ones) and 3830 (340) mesons are produced. Combining these numbers one can estimate the mean number of collisions per hadron for Pb+Pb collisions: 18500/(4200/2)=9 and for S+S collisions: 410/(400/2)=2. Similar results were obtained within RQMD for Pb+Pb and S+S collisions at 200 AGeV [29]. Certainly, just a couple of collisions per hadron, such as in the case of S+S interactions, is not large enough to reach the stage of local thermal and chemical equilibration. The situation for Pb+Pb looks more promising. The detailed analysis of particle energy spectra and abundances has been done in UrQMD [30, 31, 32] for the central cell of heavy ion collisions at energies spanning from AGS up to SPS. It was found that despite reaching local kinetic equilibrium the hadronic matter even in the central cell is still far from the stage of thermal and chemical equilibrium at SPS energies. However, the study of the relaxation of hot hadronic matter to full equilibrium in the QGSM model lies out of scope of the present paper and will be done in forthcoming publications [33].
III Space-time freeze-out picture
Here we study separately the last interaction points of the nucleons and pions produced in inelastic and in elastic collisions, as well as in resonance decays. It is worth noting that inelastic collisions are responsible for chemical equilibration of the system, while elastic collisions drive the system towards the thermal equilibration. The resonance decays characterize mostly the individual properties of the emitted particles. The long-living resonances carry little information about the reaction zone.
The phase-space distribution for the particles on the mass shell is a function of seven independent variables: , , . It is quite difficult to imagine this manyfold in eight-dimensional space. For the sake of simplicity we integrate it over some variables and study separately different space-time and phase-space three dimensional distributions. In the case of the collision of symmetric nuclei, where two coordinates in the transverse plane as well as are equivalent, there are only 10 different coordinate pairs: , , , , , , , , , and . Below we show almost all distributions in these planes, namely , , , and their projections on the -, -, -, - and -axes.
A Longitudinal and transverse directions
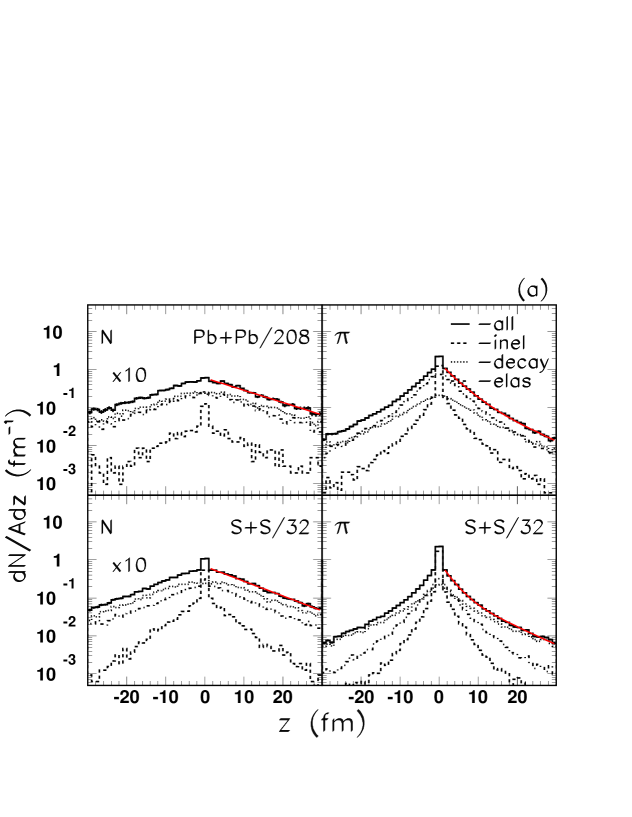
Figure 1(a) depicts the distribution of the emitted nucleons and pions over longitudinal coordinate and time. Both for light (S+S) and for heavy (Pb+Pb) colliding systems the distribution of the final state hadrons, , over the -coordinates of their last interactions shows that the particles are emitted from the whole available space-time region. In this respect the freeze-out picture obtained in QGSM is different from that of the Landau’s or Bjorken’s models [34, 35, 36], based on sharp freeze-out. Nevertheless, the shape of the contours is concave and similar to the Bjorken proper-time surface. This is partially due to the fact that the transverse spacial coordinates () are integrated over.
For all cases the QGSM predicts a high narrow peak coming from the beginning of the reaction (early emitted particles). However, the integrated number of particles coming from the peak is not so high: there are about 200 pions and 40 nucleons for the heavy Pb+Pb system.
Later on the emissivity drops gradually with increasing and . The emission region spreads throughout the whole region inside the lightcone. The picture is very different for nucleons and pions in Pb+Pb collisions. In addition to the narrow high peak at small values for nucleons, there appears a broad and flat maximum at and fm/. This plateau corresponds to the ”thermal” component of the nucleon distribution due to many elastic and inelastic collisions.
In contrast to S+S collisions, much stronger nucleon stopping is observed in Pb+Pb reactions. For nucleons in Pb+Pb collisions the distribution deviates significantly from the lightcone, which would result from the full transparency. Still, the longitudinal expansion for both nucleons and pions is considerable. The emission zone is much wider than the initial longitudinal size of Lorentz contracted nuclei. Using the distributions in -plane one can estimate the longitudinal expansion velocity. In Pb+Pb the distribution is narrower compared to that of S+S reflecting again the larger transparency and stronger longitudinal motion in latter case. In Pb+Pb the concept of collective flow is more justified due to the higher degree of equilibration. Here the matter expands with the collective longitudinal velocity , corresponding to the space-time pseudorapidity . It is much smaller than the initial CM rapidity of projectile and target, . The particles from the initial high peak in -distribution are emitted mostly from the outer edge surface of the colliding nuclei.
This picture is supported by the -distribution of pions over the variables (,) shown in Fig. 1(b), where is the pseudorapidity and is a proper time. In these variables the sharp Bjorken freeze-out would look like hypersurface . Only in S+S collisions it has some similarity with that picture, but anyway the region of emission is wide in -direction. In contrast to simple picture the emission proceeds during the whole period fm. In the case of the heavy system (Pb+Pb) the picture is very different and collective coordinates () have no preference compared to (). The resonances produce the long tail in the ()-plot which is strongest pronounced in the case of the S+S collision.
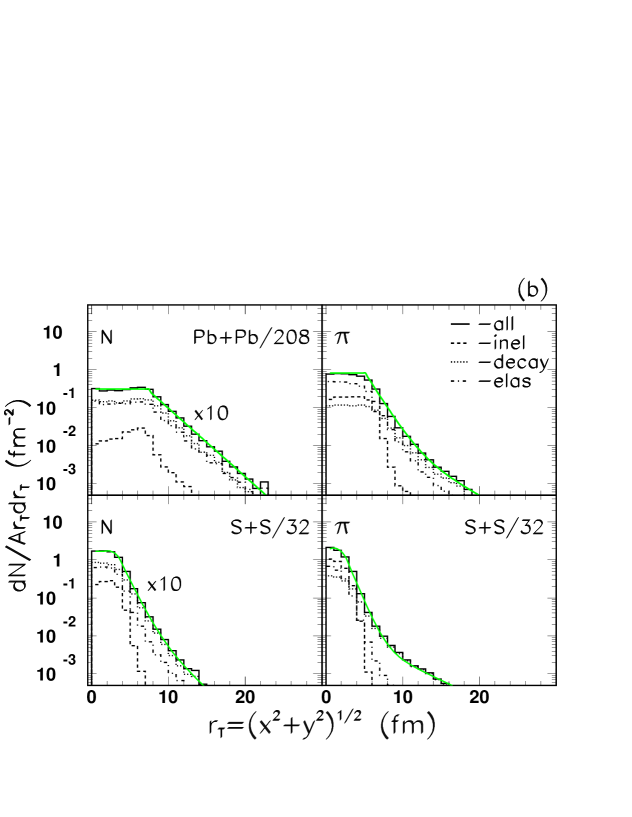
Figure 2 shows the distribution of the emitted nucleons and pions over time, , and transverse radius, . It is evidently different for nucleons and pions. Pions are emitted evenly from the whole volume of the reaction. As one can see in Fig. 2 the emission from the inner part of the Pb+Pb nucleon system is strongly suppressed at times fm/. This is due to the formation time effect at the initial stage of the reaction and longer mean free path of pions (note that mb, while mb).
Nucleons, because of the small formation time and shorter mean free path leave the system initially from the surface region only, . Due to the transverse flow the maximum of the distribution is moving to the larger at later times. For S+S this effect is less pronounced. Only in the case of nucleons the picture is closer to the conventional picture of the freeze-out with a relatively narrow emission region. In comparison with Au+Au and S+S collisions at AGS energies a strong collective transverse expansion of hadronic matter is observed, particularly for nucleons in Pb+Pb collisions.
In the projection one can see the cross section of the freeze-out hypersurface. For nucleons in Pb+Pb reaction the surface around initially is only 1 - 2 fm thin, later it becomes timelike and widens to fm. If we take a narrow - interval instead of integrating over the whole -axis, the timelike thickness of the front would be even smaller. It means that the assumption of a freeze-out surface in this case is not unreasonable.
Correlations between transverse and longitudinal coordinates , of last collision points, , are shown in Fig. 3 for hadrons produced separately in elastic and inelastic interactions and in decays of resonances in S+S collisions. It is easy to see that pions are emitted from the central zone: . For nucleons the maximum of the -distribution is shifted to the surface of the nucleus: . This confirms the fact that nucleons at the beginning of the reaction are coming from the nuclear surface. Note also, that for all species longitudinal expansion is stronger than the transverse one, which spreads up to fm.
B Distributions of the emitting sources
Sometimes it is useful to consider one-dimensional distributions , and instead of and .
Figure 4(a)-(b) shows the time integrated distributions of emitted nucleons and pions over their longitudinal, , and transverse, , coordinates. The striking feature of these distributions is their nontrivial shape, which is neither Gaussian nor exponential.
This is particularly clear for pions which show a sharp peak in distributions at in both systems. The pion distributions in Pb+Pb (S+S) reactions can be fitted to the sum of two exponentials, . The -distribution of nucleons in both reactions is close to the exponential. The parameters of the fits are listed in Table II.
For all reactions the distributions are flat within the radius of the colliding nuclei. In Pb+Pb the nucleon emission is even slightly peaked at , as seen in Fig. 4(b). At larger transverse radii distributions for pions in Pb+Pb (S+S) collisions and for nucleons in S+S collisions are nicely fitted by the sum of two exponentials . The long tail in the distributions is due to the decays of long-lived resonances, which become significant at (11) fm for Pb+Pb (S+S) collisions. For nucleons in Pb+Pb the distribution is very close to the single exponential, (see Table II). This is because of narrower emission region for nucleons in Pb+Pb collisions (see Fig. 2).
Even for small intervals the -distributions over are not similar to Gaussians. They become broader with growing time due to the transverse expansion. At later times their shape changes drastically because of the dominant contribution of the resonance decays.
Figures 4 and 5 show separately the contributions of the hadrons which go to the detector after their last inelastic and elastic collision or a resonance decay. The inelastic collision points are located in a narrow space-time region, close to the beginning of the reaction. These particles leave the contact zone before the nuclei overlap strongly. The last elastic collisions are spread in much wider space-time domain, particularly, in Pb+Pb collisions. These particles reflect the expansion of the hadronic matter produced in the reaction. Most of the inelastically produced particles do not leave the system but suffer subsequent elastic collisions. Elastic and inelastic freeze-outs are well separated. The time interval where inelastic collisions are frequent enough is probably too short to speak about chemical equilibrium.
A large group of particles reaches detectors after the resonance decays, e.g., , , . These particles become dominant at (7.5) fm/ after the first collision in the Pb+Pb (S+S) reactions. The maximum of the distribution for resonance decays is shifted to the later times compared to the distribution of the particles decoupled after the last elastic or inelastic collisions. The distribution for resonance decays is much broader than that for inelastic collisions, but much narrower than the one for elastic collisions both in Pb+Pb and in S+S reactions.
In S+S and Pb+Pb collisions the distributions presented in Fig. 5 have a sharp peak corresponding to the first (which is also the last) inelastic collision. Subsequent elastic rescatterings or decays spread out the distribution to the later times. In Pb+Pb collisions the contribution of initial interactions is almost entirely washed out for nucleons, because of the large number of rescatterings. But even in this case the distributions are wide with maxima shifted to later times.
C Sequential freeze-out
Let us now consider in more details the time distributions for the different hadron species shown in Fig. 5. In both systems there is a noticeable difference between the meson and baryon groups of particles. The QGSM predicts that kaons and pions decouple earlier than nucleons and lambdas and approximately at the same times (10) fm/ and (17.5) fm/ for the Pb+Pb (S+S) reaction. The width of - distributions for mesons are narrower than that for baryons: (6.5) fm/ and (9.0) fm/ in Pb+Pb (S+S) case. For ’s and ’s the width is slightly smaller than the width for pions and nucleons, respectively. At the last stages of the reaction the distributions for nucleons and pions are determined mainly by the resonance decays , while the width of the distributions of kaons and lambdas is determined by the elastic collisions. At this stage pions and nucleons (as well as kaons and lambdas) have the same decoupling times and the slopes of -distributions.
Therefore, our microscopic model clearly shows that there is no unique freeze-out time for different hadrons at SPS energies. In fact, the particles are emitted continuously. The mesons are emitted by about 10(6) fm/ earlier than baryons in Pb+Pb (S+S) collisions at 160 AGeV/c. This conclusion is valid also for the particles emitted in a certain rapidity interval, particularly at central rapidities, .
IV Phase-space correlations
In contrast to experiment, which is dealing only with the momenta of the final state particles, the microscopic model provides the full information about the produced particles, such as coordinates, times and momenta. Below we study the global correlations between the momentum distributions of hadrons and the space and time characteristics of the emission source, such as the rapidity-time and transverse momentum-time distributions. This information is especially important for the theoretical interpretation of interferometric measurements.
A Transverse mass and time
Figure 6 shows the contours of the distribution of the final state hadrons in the plane. Here is the transverse mass of a particle with rest mass, . One can see the difference between pion and nucleon emission in the case of heavy nuclei. The pions with large transverse momenta are emitted only at the initial stages of the S+S and Pb+Pb reactions. They are produced in inelastic primary collisions. In contrast to pions the nucleons with maximal transverse momenta in Pb+Pb collisions are coming from the intermediate times fm/. Soft hadrons are emitted during the whole evolution time. The maximum of the emission rate in S+S corresponds to the initial time of the reaction, while in Pb+Pb it is shifted to about fm/ because of many rescatterings. With growing time the -spectra become gradually softer, that can be interpreted as the cooling of the expanding hadronic matter.
We see that in the case of nucleons in Pb+Pb collisions the contribution of the particles emitted after the first interaction is completely washed out. The transverse momenta are generated to large extend by multiple rescatterings. It is very likely, therefore, that in Pb+Pb collisions we indeed are dealing with more or less thermalized source.
The time evolution of the spectra is presented in Fig. 7(a). The spectra of pions are the widest at the beginning of the reaction (small ) and become steeper at large . The particles with different transverse momenta are emitted from regions with different characteristic size. Since the system is expanding and, therefore, it is smaller at early times, it is tempting to conjecture that particles with large come from a region with relatively small longitudinal and transverse size.
The final -spectra, shown in Fig. 7(b), are composed of hadrons, produced in inelastic and elastic collisions, and resonance decays. Elastic rescatterings make the particle spectra softer. The products of resonance decays populate the soft parts of the spectra while the collective flow, caused mostly by elastic collisions, leads to the broadening of the spectra. The shoulder-like structure appears in the spectra at large transverse momenta. The final transverse momentum distributions are rather complex and cannot be reproduced by a single thermal source model.
B Rapidity and time
Figure 8 shows the contours of the distribution in the plane. The maximum of the distribution in Pb+Pb collisions is shifted to the same times fm/ after the beginning of the reaction as in the -distribution. In S+S the nucleons with large rapidities are produced at initial times, as well as particles with large . This effect is less pronounced for Pb+Pb. At the latest times one can see a significant difference between the two reactions considered. In the Pb+Pb collision the rapidity spectra are more equilibrated as in the S+S system. At the initial stage of both reactions the nucleon rapidity spectra have a characteristic two-hump structure like in interactions. The initial Fermi motion makes the rapidity spectra of the nucleons wider. At intermediate times the central part of the distribution is growing gradually with time and reaches the maximum at 12(6) fm/ after the beginning of the Pb+Pb (S+S) reaction. As one can see from Fig. 8 most nucleons are emitted in the central rapidity window . In Pb+Pb collisions this part becomes dominant at times of about 14 fm/ after the beginning of the reaction, while in S+S its contribution remains small. The evolution of the spectra reflects clearly the different degree of stopping reached in the two reactions. The rapidity spectra in Pb+Pb collisions look like emission from a thermal source for fm/. At SPS energies in both reactions one can see higher transparency of the nuclear matter as compared with AGS energies [15, 16].
The decreasing width of the rapidity spectra with growing time is in agreement with our previous conclusion on the cooling of the system. In both reactions the two-hump structure of the spectra survives even at latest times reflecting the residual longitudinal motion of the baryons. These trends are clearly seen also in Fig. 9(a), where the rapidity spectra integrated over are shown for different times. In contrast to AGS energies the significant changes in nucleon spectra are seen even at the latest stages of the reaction, when the longitudinal expansion makes it broader in the Pb+Pb case and creates a dip at midrapidity in S+S collisions.
The final rapidity spectrum of nucleons has a bell-like shape in Pb+Pb collisions and two-hump shape in S+S collisions. As expected, there is a large difference in the behavior of the rapidity spectra of pions and nucleons. For pions the variation with time of the spectra is less pronounced because even in collisions they have the bell-like shape, similar to thermal spectra. The final spectra for pions and nucleons are close to each other.
The contributions of different reaction channels (elastic, inelastic, decays) are shown in Fig. 9(b). As was mentioned before, in both reactions the decays give the most significant contribution at the latest times. In both reactions half of the nucleons are coming from the resonance decays, 40% from the elastic collisions and about 10% from inelastic collisions. Third of the pions are coming from the resonance decays, 23% (40%) from the inelastic collisions and 52% (23%) from elastic collisions in Pb+Pb (S+S) reactions at SPS.
The observed picture has an important implication for particle interferometry [37, 38, 39, 40, 41, 42]. According to QGSM, nucleons with large show small longitudinal size of the emitting source while particles from the midrapidity region indicate a large longitudinal size and life time of the source.
V Conclusions
From the analysis of various space-time and phase space particle distributions, obtained within the QGSM model for light (S+S) and heavy (Pb+Pb) systems of colliding nuclei at SPS energies, the following conclusions may be drawn. The system of final particles in heavy ion collision can be represented as a core and a halo. The core contains the particles which are still in evolution through the inelastic and elastic collisions. The halo is represented by particles which are already decoupled from the system and move to the detectors.
Microscopic models like QGSM or UrQMD cannot in principle give a sharp freeze-out due to the lack of attractive forces which keep the particles together. To get a sharp freeze-out it is necessary to have some glue mechanism, like attractive mean fields, enhanced cross sections or rapidly hadronizing Quark Gluon Plasma.
The shapes of the emitting sources are far from Gaussians. In addition, the - scaling, which is often used in the parameterizations, is not confirmed by the model calculations for heavy systems like Pb+Pb. More realistic source shapes and freeze-out criteria should be used in the analysis of HBT interferometric data.
These results are supported by the results of recent paper [43], in which the importance of freeze-out models for the HBT analysis has been investigated. In this article the HBT correlators of both identical and non-identical pions are shown to depend strongly on the pion production scenario. Also, a more realistic model of freeze-out, in which the dynamics of the system is driven by binary collisions, has been elaborated. Note, that the case of heavy ion collisions at relativistic energies simulated by QGSM, with the pions (as well as other particles) coming both from elastic and inelastic collisions and from decays of resonances, is much more complex compared to the elastic freeze-out scenario and requires further theoretical analysis.
Our main conclusion is that the Quark Gluon String Model predicts a continuous emission of particles, starting almost from the beginning of the reaction. One can consider this picture as a limiting case of the dynamics of relativistic heavy ion collisions. The hydrodynamical sharp freeze-out presents another idealized limit (for recent review see [44, 45, 46] and references therein). We believe that the truth is somewhere between. Certainly, the rich experience of microscopic calculations should be employed for constructing more sophisticated macroscopic models.
VI Acknowledgments
We are grateful to H. Heiselberg and H. Stöcker for fruitful discussions. This work is supported in part by Danish Natural Science Research Council, A.v.Humboldt Stiftung, the EU-INTAS-grant 94-3405, and the Bundesministerium für Bildung and Forschung (BMBF). L.B. thanks the Niels Bohr Institute and NORDITA for kind hospitality and financial support. I.N.M. thanks the Carlsberg Foundation for the financial support.
REFERENCES
- [1] N.S. Amelin and L.V. Bravina, Sov. J. Nucl. Phys. 51, 133 (1990).
- [2] N.S. Amelin, L.V. Bravina, L.P. Csernai, V.D. Toneev, K.K. Gudima, and S.Yu. Sivoklokov, Phys. Rev. C 47, 2299 (1993).
-
[3]
S.A. Bass, M. Belkacem, M. Bleicher,
M. Brandstetter, L. Bravina, C. Ernst, L. Gerland, M. Hofmann,
S. Hofmann, J. Konopka, G. Mao, L. Neise, S. Soff, C. Spieles,
H. Weber, L.A. Winckelmann, H. Stöcker, W. Greiner,
Ch. Hartnack, J. Aichelin, N. Amelin,
Prog. Part. Nucl. Phys. 41, 255 (1998);
M. Bleicher, E. Zabrodin, C. Spieles, S.A. Bass, C. Ernst, S. Soff, L. Bravina, H. Weber, H. Stöcker, and W. Greiner, J. Phys. G 25 (1999) (in press). - [4] H. Sorge, H. Stöcker, and W. Greiner, Ann. of Phys. 192, 266 (1989).
- [5] Y. Pang, T.J. Schtagel, and S.H. Kahana, Phys. Rev. Lett. 68, 2743 (1992).
- [6] Bao-An Li and Che Ming Ko, Phys. Rev. C 52, 2037 (1995); ibid. 53, 22 (1996).
- [7] S. Bernard, J.A. Maruhn, W. Greiner, D.H. Rischke, Nucl.Phys. A605, 566 (1996).
-
[8]
B.R. Schlei, U. Ornik, M. Plümer, D. Strottman,
R.M. Weiner,
Phys. Lett. B 376, 212 (1996);
U. Ornik, F. Pottag, R.M. Weiner, Phys. Rev. Lett. 63, 2641 (1989). -
[9]
U. Heinz, Nucl.Phys. A610, 264c (1996) and
references in it;
E. Schnedermann, J. Sollfrank, and U. Heinz, Phys. Rev. C 48, 2462 (1993). - [10] P. Braun-Munzinger, J. Stachel, J.P. Wessel, and N. Xu, Phys. Lett. B 344, 43 (1995).
- [11] G.D. Yen, M.I. Gorenstein, W. Greiner, S.N. Yang, Phys. Rev. C 56, 2210 (1997).
- [12] L.V. Bravina, L.P. Csernai, P. Levai, D. Strottman, Phys. Rev. C 50, 2161 (1994).
- [13] L.V. Bravina, N.S. Amelin, L.P. Csernai, P. Levai, and D. Strottman, Nucl. Phys. A566, 461c (1994).
- [14] E.V. Shuryak, Heavy Ion Physics 5, 395 (1997).
- [15] L.V. Bravina, I.N. Mishustin, J.P. Bondorf, N.S. Amelin, and L.P. Csernai, Phys. Lett. B 354, 196 (1995).
- [16] L.V. Bravina, I.N. Mishustin and J.P. Bondorf, Nucl. Phys. A594, 425 (1995).
- [17] R.M. Weiner, Bose-Einstein correlations and subatomic interferometry, (John Wiley & Sons, Chichester, 1999).
- [18] H. Sorge, Phys. Lett B 373, 16 (1996); ibid. 402, 251 (1997).
-
[19]
R. Mattiello, A. Jahns, H. Sorge, H. Stöcker and W. Greiner,
Phys. Rev. Lett. 74, 2180 (1995);
R. Mattiello, H. Sorge, H. Stöcker and W. Greiner, Phys. Rev. C 55, 1443 (1997). - [20] S.A. Bass, C. Hartnack, H. Stöcker, and W. Greiner, Phys. Rev. C 50, 2167 (1994).
-
[21]
A.B. Kaidalov and K.A. Ter-Martirosyan, Phys. Lett. B 117, 247
(1982); Sov. J. Nucl. Phys. 39, 979 (1984); ibid.
40, 135 (1984);
A.B. Kaidalov, Sov. J. Nucl. Phys. 45, 902 (1987); Nucl. Phys. A525, 39c (1991). -
[22]
N.S. Amelin, L.V. Bravina, and L.N. Smirnova,
Sov. J. Nucl. Phys. 52, 362 (1990);
N.S. Amelin, L.V. Bravina, L.N. Smirnova, and L.I. Sarycheva, Sov. J. Nucl. Phys. 50, 1705 (1989); ibid. 51, 841 (1990); ibid. 52, 567 (1990). -
[23]
N.S. Amelin, K.K. Gudima, and V.D. Toneev,
Sov. J. Nucl. Phys. 51, 1093 (1990);
N.S. Amelin, K.K. Gudima, S.Yu. Sivoklokov, and V.D. Toneev, Sov. J. Nucl. Phys. 52, 172 (1990). -
[24]
N.S. Amelin, E.F. Staubo, L.P. Csernai, V.D. Toneev, K.K. Gudima,
Phys. Rev. C 44, 1541 (1991);
N.S. Amelin, E.F. Staubo, L.P. Csernai, V.D. Toneev, K.K. Gudima, and D. Strottman, Phys. Rev. Lett. 67, 1523 (1991). - [25] Th. Albor et al. (NA35 coll.), Phys. Rev. Lett. 74, 1303 (1995).
-
[26]
F.E. Close, Introduction to Quarks and Partons, (Academic
Press, London, 1979);
D.H. Perkins, Introduction to High Energy Physics, (Addison-Wesley, 1987), 3rd edition. - [27] V. Blobel, et al., Nucl. Phys. B69, 454 (1974).
- [28] M. Adamus et al. (NA22 coll.), Z. Phys. C 39, 311 (1988).
- [29] A. von Keitz, L. Winckelmann, A. Jahns, H. Sorge, H. Stöcker, W. Greiner, Phys. Lett. B 263, 353 (1991).
- [30] L.V. Bravina, M.I. Gorenstein, M. Belkacem, S.A. Bass, M. Bleicher, M. Brandstetter, M. Hofmann, S. Soff, C. Spieles, H. Weber, H. Stöcker, and W. Greiner, Phys. Lett. B 434, 379 (1998).
- [31] L.V. Bravina, M. Brandstetter, M.I. Gorenstein, E.E. Zabrodin, M. Belkacem, M. Bleicher, S.A. Bass, C. Ernst, M. Hofmann, S. Soff, H. Stöcker, and W. Greiner, J. Phys. G 25, 351 (1999).
- [32] L.V. Bravina, E.E. Zabrodin, M.I. Gorenstein, S.A. Bass, M. Belkacem, M. Bleicher, M. Brandstetter, C. Ernst, M. Hofmann, L. Neise, S. Soff, H. Weber, H. Stöcker, and W. Greiner, Phys. Rev. C (1999) (in press).
- [33] L.V. Bravina et al., (in preparation).
- [34] L.D. Landau, Izv. Akad. Nauk SSSR 17, 51 (1953).
- [35] F. Cooper and G. Frye, Phys. Rev. D 10, 186 (1974).
- [36] J.D. Bjorken, Phys. Rev. D 27, 140 (1983).
- [37] G.I. Kopylov and M.J. Podgoretskii, Sov. J. Nucl. Phys. 18, 336 (1974).
- [38] A.N. Makhlin and Y.M. Sinyukov, Z. Phys. C 39, 69 (1988).
- [39] K. Kohlemainen and M. Gyulassy, Phys. Lett. B 180, 203 (1986).
- [40] S. Chapman, P. Scotto, and U. Heinz, Phys. Rev. Lett. 74, 4400 (1995).
- [41] S.V. Akkelin and Y.M. Sinyukov, Z. Phys. C 72, 501 (1996).
- [42] T. Csörgő and B. Lörstad, Phys. Rev. C 54, 1390 (1996).
- [43] A. Makhlin and E. Surdutovich, Phys. Rev. C 59, 2761 (1999).
- [44] U. Heinz and B.V. Jacak, Ann. Rev. Nucl. Part. Sci., 49 (1999) (in press) (nucl-th/9902020).
- [45] K.A. Bugaev and M.I. Gorenstein, nucl-th/9903072.
- [46] Cs. Anderlik, Zs.I. Lazar, V.K. Magas, L.P. Csernai, H. Stöcker, W. Greiner, Phys. Rev. C 59, 388 (1999).

(b): - distribution of the final state pions over - coordinates of their last collision points. The sequence of the contour plots is the same as in (a).


(b): distributions of the final state pions (right panels) and nucleons (left panels) over their transverse mass, , produced in inelastic collisions (dashed curves), in resonance decays (dotted curves) or elastic collisions (dash-dotted curves), and for sum of them (solid curve).


(b): The same as Fig. 7(b) but for distributions of the final state pions (right panels) and nucleons (left panels) over their rapidities, .

| Pb+Pb | Au+Au | S+S | S+S | |
|---|---|---|---|---|
| 160 AGeV/ | 11.6 AGeV/ | 160 AGeV/ | 11.6 AGeV/ | |
| 18595 | 8972 | 410 | 242 | |
| 6784 | 4096 | 206 | 129 | |
| 11811 | 4876 | 204 | 113 | |
| 1960 | 1207 | 116 | 58 | |
| 417 | 384 | 58 | 55 | |
| 3830 | 973 | 342 | 97 |
| (S+S) | 0.722 | 2.65 | 0.14 | 9.35 | 18.89 | 0.91 | 0.0183 | 4.56 |
| (Pb+Pb) | 1.25 | 3.81 | 3.74 | 3.81 | 33.62 | 1.33 | 0.083 | 3.86 |
| (S+S) | 0.067 | 11.1 | 3.37 | 1.03 | 0.020 | 2.40 | ||
| (Pb+Pb) | 0.060 | 13.5 | 0.77 | 2.30 | ||||