Shell model calculations of stellar weak interaction rates:
I. Gamow-Teller distributions and spectra of nuclei in the mass range
Abstract
Electron capture and beta-decay rates on nuclei in the mass range play an important role in many astrophysical environments. The determination of these rates by large-scale shell model calculations is desirable, but it requires to reproduce the Gamow-Teller strength distributions and spectra of the shell nuclei. We show in this paper that large-scale shell model calculations, employing a slightly monopole-corrected version of the wellknown KB3 interaction, fulfill these necessary requirements. In particular, our calculations reproduce the experimentally available GT+ and GT- strength distributions and the nuclear halflives, and describe the nuclear spectra appropriately.
PACS numbers: 26.50.+x, 23.40.-s, 21.60Cs, 21.60Ka
For many years it has been recognized that nuclear beta-decay and electron capture are important during the late stages of stellar evolution. Shortly after the discovery of the Gamow-Teller (GT) resonance, Bethe et al. [1] recognized the importance of this collective nuclear excitation for stellar electron capture. In the seminal work by Fuller, Fowler and Newman (usually abbreviated as FFN, [2]) stellar electron capture and beta-decay rates have been systematically estimated for nuclei in the mass range considering two distinct contributions. At first, these authors estimated the GT contributions to the rates by a parametrization based on the independent particle model. The rate estimate has then been completed by experimental data for discrete transitions, whenever available. Unmeasured allowed GT transitions have been assigned an empirical value (log ft=5). One of the important ideas in FFN was to recognize the role played by the Gamow-Teller resonance in decay. Other than in the laboratory, decay rates under stellar conditions are significantly increased due to thermal population of the Gamow-Teller back resonance in the parent nucleus (the GT back resonance are the states reached by the strong GT transitions in the inverse process (electron capture) built on the ground and excited states, see [2]) allowing for a transition with a large nuclear matrix element and increased phase space. Thus it follows that both, stellar electron capture and beta decay, are very sensitive to the distribution of the GT+ strength (in this direction a proton is changed into a neutron). In the last decade, GT+ strength distributions on nuclei in the mass range have been studied experimentally via (n,p) charge-exchange reactions at forward angles and the experimental data [3, 4, 5, 6, 7] show that, in contrast to the independent particle model, the total GT+ strength is quenched and fragmented over many final states in the daughter nucleus caused by residual nucleon-nucleon correlations. Importantly for the stellar weak reaction rates, the data indicate a systematic misplacement of the GT centroid adopted in the FFN parametrization. The need for an improved theoretical description of stellar weak interaction rates has consequently been realized.
The method of choice for these calculations is the interacting shell model. Early attempts to improve selected FFN rates [8, 9, 10, 11] have been performed within the conventional shell model diagonalization approach, however, in strongly restricted model spaces and with residual interactions, which did neither reproduce the quenching nor the position of the GT strength distributions well enough to give these approaches the necessary predictive power. One of the limitations of these shell model calculations (the strongly restrictive model spaces) has been overcome recently by decisive progress achieved in shell model technologies. At first, the development of the shell model Monte Carlo technique (SMMC) [12, 13] allows now calculations of the GT strength distributions in the complete shell. But also with state-of-the-art diagonalization approaches, combined with modern computer technologies, shell model calculations can be performed on a truncation level which guarantees basically complete and converged calculations of the GT strength distributions for shell nuclei. Although the first shell model estimates of stellar electron capture rates has been presented on the basis of the SMMC approach [14], we note that the diagonalization method is likely better suited for the calculation of stellar weak interaction rates. The reason is that the diagonalization approach allows for detailed spectroscopy, while the SMMC model yields only an “averaged” GT strength distribution which introduces some inaccuracies into the rate calculations. Furthermore, SMMC calculations for odd- and odd-odd nuclei can only be performed at temperatures MeV, which is in access of the temperatures encountered at the onset of the core collapse of a massive star.
This paper is concerned with the solution of the second problem, encountered in the early studies: the lack of an appropriate residual interaction which can be used to calculate the stellar weak interaction rates within the entire mass range . To do so, we have to recall the important ingredients necessary to estimate stellar weak interaction rates; from these ingredients we will derive requirements to be fulfilled by shell model calculations to have predictive power in estimating these rates. At first, we stress that the GT+ strength distribution directly determines the electron capture rates and, via the back-resonance, also indirectly contributes significantly to or even dominates the beta-decay rates. However, the beta-decay rates are not entirely given by the back-resonance contribution, as the ground state and other low-lying states can also contribute. These contributions are determined mainly by the low-lying part of the respective GT- strength distribution (in which a neutron is changed into a proton and which can be experimentally determined via (p,n) charge-exchange reactions). Finally, under stellar conditions the weak processes occur at finite temperature and hence several thermally populated states at modest temperatures (in beta decay supplemented by the back-resonances) will potentially contribute to the stellar rates. To be applicable to calculating stellar weak interaction rates the shell model calculations (model space plus residual interaction) should reproduce most notably the available GT+ strength distributions, but they should also give a fair account of the GT- strength distributions and the nuclear spectra.
Why is the original KB3 interaction not suited to calculate the weak interaction rates in the entire mass range ? To understand the problem and to find a possible cure we recall the following observations. Shell model calculations, performed in the complete shell and employing the KB3 interaction [15], have been demonstrated to give an excellent description of nuclei at the beginning of the shell () [16, 17]. However, the extension of these complete studies towards heavier nuclei, performed with the SMMC approach, clearly demonstrated the decreasing level of accuracy of the KB3 interaction which, for example, results in an overenhancement of the shell closure, most notably in 56Ni [18]. This finding has recently been confirmed and explored in more details on the basis of shell model diagonalization calculations [19]. Furthermore it turns out that the KB3 interaction apparently does not give a meaningful ordering of the single particle energies in the upper shell, where the orbit is pushed up relative to the orbits [20].
To understand the cure of the problem, let us remember that the KB3 interaction is nothing else but the original Kuo-Brown interaction, however, with a slight, but important correction of the monopole part [15]. Due to numerical restrictions at the time, the fixing of the monopole part had to be limited to pure nuclei, leaving the non- monopoles essentially undetermined. In fact, it turns out that the quasiparticle gap in 56Ni is too strong resulting in a relative underbinding of nuclei with neutron or proton numbers larger than 28.
The two failures of the KB3 interaction mentioned above suggest that i) the monopole correction introduced in [15] has been slightly too large and ii) the monopole term should be lowered with respect to the orbits. This leads us to the following modifications of the centroids between any two shells ( in the KB3 interaction (for a definition of the centroids the reader is refered to [16]): with (r=3/2,5/2,1/2) is lowered by 0.1 MeV; , , and are all raised by 0.1 MeV; and , , and are all lowered by 0.2 MeV. These corrections apply to both isospins .
Let us stress here that we have not aimed to optimize the monopole corrections. They are rather the minimal ones which allow a fair reproduction of the GT strength distributions and halflives, but for more detailed spectroscopic studies it is probably required to correct some minor deficiencies seen in occasional inversions of levels at the higher mass numbers (see below). There are ongoing efforts to overcome these minor inefficiencies and to derive a ‘final’ residual interaction for the shell. However, as we will demonstrate now, our interaction is already a well suited tool to calculate the stellar weak interaction rates on the basis of large-scale shell model calculations. We like to stress that slight energy misplacements in the level scheme do not matter, as in the calculation of the rates [21] the shell model energies will be replaced by experimental data.
We will now present the results of large-scale shell model calculations performed with our interaction defined above. Having our ultimate goal in mind - a compilation of stellar electron capture and beta-decay rates for more than 100 nuclei in the mass range [21] - we had to find a balance between numerical accuracy and computational feasibility. Thus we have not always performed the calculations at the highest truncation level achievable on modern computers (note that the rate calculations require the evaluation of the GT strengths for many levels per nucleus). However, at the chosen level of truncation involving typically 10 million configurations or more, the GT strength distribution is virtually converged for the nuclei studied. We also mention that the GT strengths distributions have always been calculated in truncated model spaces which fulfill the Ikeda sum rule. Finally, as shell model calculations, i.e. calculations performed in one major shell, overestimate the experimental GT strength by a universal factor [22, 18, 17], we have scaled our GT strength distribution by this factor, . To allow the reader the judgment of quality achieved in the shell model calculations underlying the stellar weak interaction rate compilation the results presented below have been calculated within the same truncation scheme as the compilation. Some electron capture and beta decay rates, based on our shell model studies, have already been reported in [23, 24, 25].
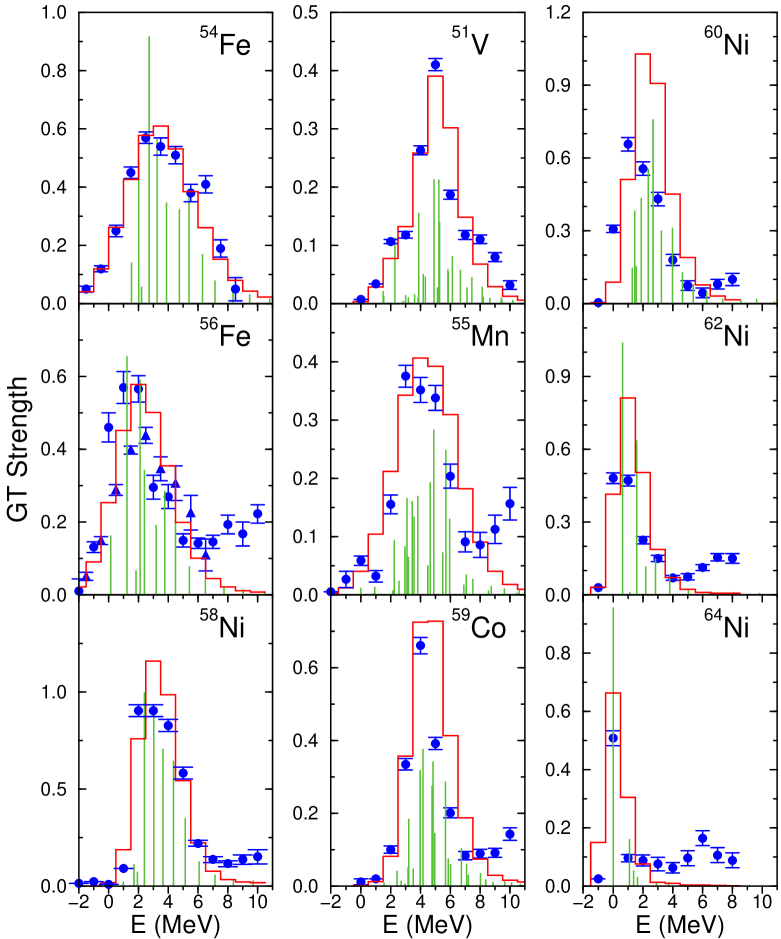
For the mass range of interest here, GT+ strength distributions have been determined from (n,p) charge-exchange experiments for the even-even nuclei 54,56Fe, 58,60,62,64Ni and the odd- nuclei 51V, 55Mn, 59Co [3, 4, 5, 6, 7]. In Table I we have listed the experimental and calculated total GT+ strengths. The overall agreement is very satisfying. The level of convergence achieved with the chosen truncation level can be estimated to be of the order or better. To check this we have performed a study of 58Ni in a model space in which a maximum of 6 particles were allowed to be excited from the shell to the rest of the shell in the final nucleus; the value quoted in Table I has been calculated for a maximum of 5 particles. With the increased truncation level the total GT+ strength reduces to 4.1 units, a decrease of about . We also note that the data for the odd-A nuclei (51V, 55Mn, 59Co) show additional GT+ strength at higher excitation energies between MeV, which has not been considered in the values quoted in Table I. Aufderheide al. have analyzed the data for 51V and 59Co upto MeV and quote GT+ values of 1.50.2 and 2.40.3 for these two nuclei [9], in very close agreement with the shell model results. We also note that, compared to experiment, the calculated GT+ strength for 64Ni is somewhat too small; a tendency which might already been indicated in 62Ni. It is conceivable that a better description of these nuclei require the inclusion of the orbital in the model space, a venture which is beyond the scope of the present study.
For the calculation of the stellar weak interaction rates, a proper reproduction of the GT strength distribution is more important than of the total strength, due to a very strong energy dependence of the phase space factors. In Fig. 1 we compare our calculated GT+ distributions with the data. To allow for a meaningful comparison we have folded the shell model results with Gaussians to account for the experimental resolution. The agreement is again satisfying in all cases. It is interesting to compare the present distributions to those obtained for the KB3 interaction within the SMMC approach, e.g. Figs. 3 and 4 of Ref. [26]. One clearly observes that the slight monopole corrections, defined above, result in a much better reproduction of the data. This is most noticeably visible for the nickel isotopes. However, we also note that the calculated strength function for 60Ni is slightly shifted to higher energies compared to the data (by about 500 keV).
For the nickel isotopes 60,62,64Ni we have taken the GT+ data from Fig. 12 in [7]. However, summing these data upto 8.5 MeV yields a total GT strength, which is about smaller than the values cited in [7] and Table I, and plotted in Fig. 10 of that reference.
In Table I we also compare the centroids of the calculated GT+ distributions with the GT resonance energy assumed in the FFN parametrization. We find that for even-even nuclei the GT centroid is usually at lower excitation energy in the daughter nucleus than assumed in [2]. For odd-A nuclei, Fuller et al. placed the GT resonance at lower excitation energies than calculated in our shell model approaches or observed in the data. For odd-odd nuclei the shell model centroids [24] are also at higher excitation energies than adopted in [2]. Possible consequences of these misplacements for the stellar electron capture and beta decay rates are discussed in [11, 23, 24, 25].
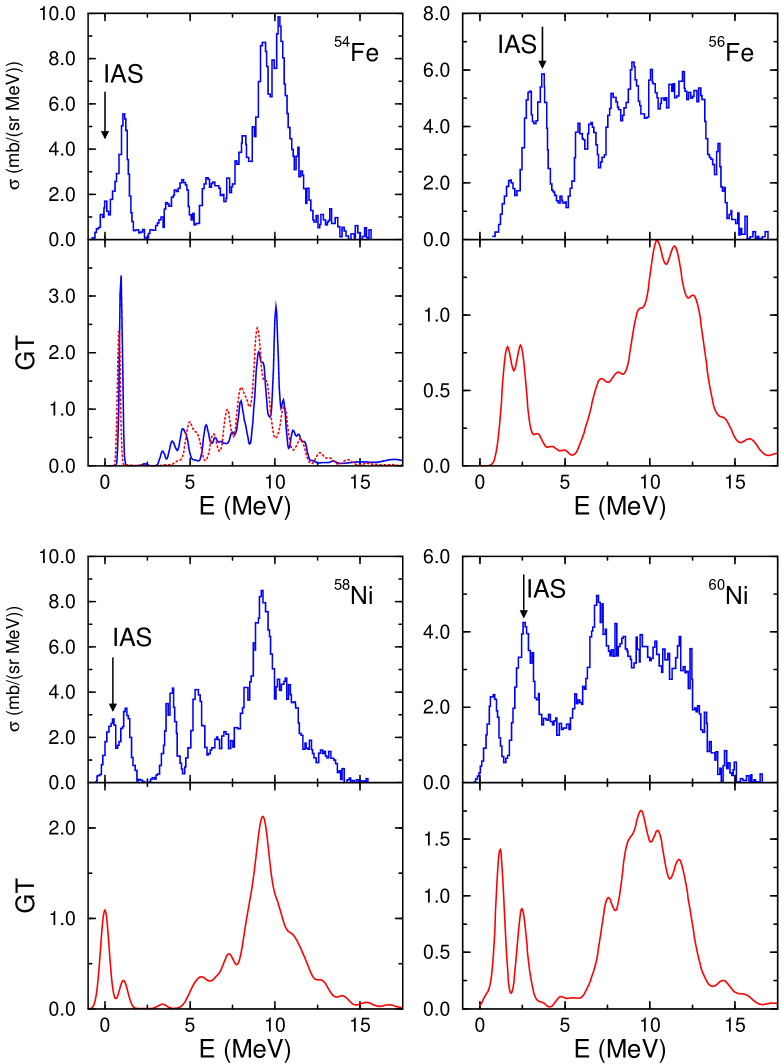
Informations about the GT- strength distribution has been determined experimentally from (p,n) charge-exchange reaction measurements for the nuclei 54,56Fe and 58,60Ni [27, 28]. As these Gamow-Teller transitions change a neutron into a proton, they can lead, for a nucleus with neutron excess and ground state isospin , to 3 different isospins () in the daughter nucleus. As a consequence, GT- strength distributions have significantly more structure and extend over a larger energy interval than the GT+ distributions, making their theoretical reproduction more challenging. For example, the shell model description of the GT- distributions in 54,56Fe with the KB3 interaction failed [29], as the gross structure of the distributions, experimentally observed at excitation energies around 10 MeV, were noticeably shifted up in energy. These authors pointed out that this discrepancy is related to the quasiparticle gap around being too large. If this is indeed the case, then the disagreement should be reduced by the slight monopole corrections in the KB3 interaction defined above. This conjecture is confirmed in Fig. 2, which shows the calculated GT- strength distributions for 54,56Fe and 58,60Ni.
For 54Fe, the (p,n) cross sections have been converted into GT- strength functions [27], allowing a direct comparison to our calculated distributions. Although not perfect in details, the overall structure of the GT data are nicely reproduced by our calculation. For the total GT- strength we find 6.9 (note that the Ikeda sumrule includes also the universal scaling factor ), which agrees well with the experimental results (, , [27, 28]).
Ref. [28] reports the forward-angle (p,n) cross sections for 54Fe, without conversion into GT strength functions. These data are shown in the upper parts of Fig. 2; they exhibit the same peak structure as the GT data, but the conversion factor is slightly energy dependent. The two data sets [27, 28] appear to have a small energy offset ( MeV), which might be interpreted as the experimental energy uncertainty.
For 56Fe and 58,60Ni the forward-angle cross sections have not been converted into GT- strength distributions. Therefore we have not overlaid the data with the calculated strength distributions in Figs. 2b-d, but rather show them in separate panels. Our calculations do not include the Fermi transitions to the isobaric analog states which are therefore marked in the data.
For 56Fe the data show two major areas of GT strength, at excitation energies below 4 MeV and between 6 and 15 MeV. This is well reproduced with our modified interaction, just removing the overall shift by 2 MeV encountered with the KB3 interaction. Although the overall agreement is satisfying, the calculation misses in some details. For example, the structure in the data around 6 MeV is not reproduced. The calculated total GT- strength of 9.3 units agrees with the experimental value of [28].
For 58,60Ni the major structures in the data are reproduced. But we notice that the data for 58Ni exhibit structure at excitation energies around 4 MeV, which is missing in our calculation. The position and width of the major peak at 9 MeV, however, is nicely reproduced. For 60Ni the calculated GT- strength function shows two narrow structures below 4 MeV, while the major strength resides in a wide structure between 7 and 13 MeV. This is in good agreement with the data. We calculate total GT- strengths of 7.7 units and 10.0 units for 58Ni and 60Ni, respectively, while the experimental values are and [28]. We note that applying the (scaled) Ikeda sumrule to the (n,p) data for 60Ni, results in a GT- strength of 9.7 units, larger than the value quoted in Ref. [28].
Although the centroids of the GT+ strength distributions dominate the stellar electron capture rates (and via the back-resonance also the beta decay rates), weaker low-lying transitions can contribute due to phase space enhancement. In the compilation, experimental informations, derived from measured halflives, will be used, if available. However, these are only available for ground states, while excited states might contribute to the stellar rates via thermal population. It is therefore useful to check how well our shell model calculations do in comparison with measured halflives. Table II lists halflives for selected nuclei, covering the mass range of interest. These halflives have been calculated using the shell model matrix elements and the experimental values. We find that our calculations agree usually very well with the data, a fact which has already been noticed before in shell model calculations of lighter nuclei (using the unmodified KB3 interaction, which yields very similar results to the present modified version for pure nuclei).
The values for beta decay increases significantly if one moves to the proton- or neutronrich sides of a mass parabola. As nuclei with large values can, in general, decay to several states of the daughter nucleus, the reproduction of such decay schemes is a rather stringent test for nuclear models. Recently there has been considerable interest in the properties of the double-magic nucleus 56Ni and its neighbors. In this context, the decay of the 56Cu ground state (with ) has been investigated and the ft-values for the transitions to 3 final states with in 56Ni could be determined [30]. Our shell model results are compared to the data in Table III, and again good agreement is observed. To derive our results we have used the experimental energies and adopted the value of 15.3 MeV [31] from a calculation of the Coulomb energy differences. We calculate a 56Cu halflife of 67 ms, which agrees well with observation ( ms) [30]).
At stellar conditions electron capture and beta-decay also occur from excited states. Although the compilation [21] will use the experimental excitation energies, it is nevertheless useful to test how well our interaction reproduces the spectra of nuclei in the mass range . This will also give us an estimate of the accuracy expected for very neutron-rich nuclei possibly encountered during a core collapse and for which the spectral information at modest energies is only incompletely known.
We compare the calculated spectra with data for selected nuclei covering the relevant mass range. The presentation is for even-even (fig. 3), odd- (fig. 4) and odd-odd (fig. 5) nuclei separately. Furthermore we compare several nuclei of the same mass number to test the isospin dependence of the interaction. We note that at the chosen truncation levels the energies are not completely converged yet, which might result in slight inaccuracies if judging the validity of the interaction. Nevertheless we chose to present the results consistent with the shell model evaluation of the stellar weak interaction rates as we feel it is more important to know the accuracy of the calculations behind these astrophysically important quantities.
For even-even nuclei the low-lying spectrum comprises mainly the ground state, the two lowest states and the first excited state. We see that these states are well reproduced in the relevant mass range. For odd- nuclei the spectra are generally also well described, although we note that the interaction is not perfect for nuclei with masses larger than . For example, the two lowest states in 63Zn are inverted in our calculation (although the misplacement amounts only to about 200 keV). Obviously the most difficult spectra to describe are those of odd-odd nuclei. Again the interaction does pretty well, although it inverts, for example, the two lowest states in 56Mn. Note, however, that on an absolute scale these misplacements are rather minute and amount only to 130 keV. For 62Cu, three and two and levels have been experimentally idenfied below 700 keV excitation energy; our calculation only misses one state. Experimentally the 62Co spectrum is incompletely known. For example no spin assignment has been made for the states at 230 keV and at 244 keV. Our calculation predicts two states around these energies. The spectra of the nuclei in the mass range , which are not shown here, are of similar quality than those presented and discussed. In particular the reproduction of the observed level schemes by our interaction gets slightly worse if moving to larger mass numbers within the shell.
In summary, our goal is to calculate stellar weak interaction rates as they are needed for example in simulations of the core collapse of a massive star. The method of choice for this adventure is the interacting shell model and in this manuscript we aimed at demonstrating that modern large-scale shell model calculations have the predictive power to fulfill this job. To demonstrate this we have performed large-scale shell model calculations for nuclei in the mass range using a slightly modified version of the wellknown KB3 interaction in which we have corrected small inefficiencies of the monopole terms. After these modifications the KB3 interaction is suited for applications in shell model calculations of stellar electron capture and beta decay rates. Our studies reproduce those ingredients which have been identified to be essential for a reliable estimate of the stellar rates. These are most notably the strength distributions in the daughter nucleus (for nuclei with ), which are well reproduced in all cases for which experimentally data are available. This includes also rather weak GT transitions as they usually determine the halflives of nuclei in this mass range under laboratory conditions. Beta decay rates also depend on the strength distributions and again our calculations reproduce the available experimental data on 54,56Fe and 58,60Ni rather well, clearly improving previous studies. Finally we have demonstrated that the shell model calculations give a fair account of the level spectra of nuclei in this mass regime. This is of interest for the calculations of stellar weak interaction rates as they occur at finite temperature.
Summarizing, for the first time a theoretical tool is in hand which has the predictive power to reliably calculate the stellar weak interaction rates for nuclei in the mass range . These computationally intensive studies are in progress and their results will be available soon.
ACKNOWLEDGMENTS
The authors are very grateful to Professor Alfredo Poves for his advices and many useful discussions. This work was supported in part by the Danish Research Council.
REFERENCES
- [1] H.A. Bethe, G.E. Brown, J. Applegate and J.M. Lattimer, Nucl. Phys. A324 (1979) 487
- [2] G.M. Fuller, W.A. Fowler and M.J. Newman, ApJS 42 (1980) 447; 48 (1982) 279; ApJ 252 (1982) 715; 293 (1985) 1
- [3] W.P. Alford et al., Nucl. Phys. A514 (1990) 49
- [4] M.C. Vetterli et al., Phys. Rev. C40 (1989) 559
- [5] S. El-Kateb et al., Phys. Rev. C49 (1994) 3129
- [6] T. Rönnquist et al., Nucl. Phys. A563 (1993) 225
- [7] A.L. Williams et al., Phys. Rev. C51 (1995) 1144
- [8] M.B. Aufderheide, Nucl. Phys. A526 (1991) 161
- [9] M.B. Aufderheide, S.D. Bloom, D.A. Ressler and G.J. Mathews, Phys. Rev. C47 (1993) 2961
- [10] M.B. Aufderheide, S.D. Bloom, D.A. Ressler and G.J. Mathews, Phys. Rev. C48 (1993) 1677
- [11] M.B. Aufderheide, S.D. Bloom, G.J. Mathews and D.A. Resler, Phys. Rev. C53 (1996) 3139
- [12] C.W. Johnson, S.E. Koonin, G.H. Lang and W.E. Ormand, Phys. Rev. Lett. 69 (1992) 3157
- [13] S.E. Koonin, D.J. Dean and K. Langanke, Phys. Rep. 278 (1996) 1
- [14] D.J. Dean, K. Langanke, L. Chatterjee, P.B. Radha and M.R. Strayer, Phys. Rev. C 58 (1998) 536
- [15] A. Poves and A.P. Zuker, Phys. Rep. 70 (1981) 235
- [16] E. Caurier, A.P. Zuker, A. Poves and G. Martínez-Pinedo, Phys. Rev. C50 (1994) 225
- [17] G. Martínez-Pinedo, A. Poves, E. Caurier, and A. P. Zuker, Phys. Rev. C 53, R2602 (1996).
- [18] K. Langanke, D. J. Dean, P. B. Radha, Y. Alhassid, and S. E. Koonin, Phys. Rev. C 52, 718 (1995).
- [19] E. Caurier, G. Martínez-Pinedo, F. Nowacki and A. Poves, to be published
- [20] W.E. Ormand and B.A. Brown, Phys. Rev. C52 (1995) 245
- [21] K. Langanke and G. Martínez-Pinedo, to be submitted to Nucl. Phys. A
- [22] B.A Brown and B.H. Wildenthal, Ann. Rev. Nucl. Part. Sci. 38, 29 (1988).
- [23] K. Langanke and G. Martínez Pinedo, Phys. Lett. B436 (1998) 19
- [24] K. Langanke and G. Martínez-Pinedo, submitted to Phys. Lett. B
- [25] G. Martínez-Pinedo, K. Langanke and D.J. Dean, submitted to Ap.J.
- [26] P.B. Radha, D.J. Dean, S.E. Koonin, K. Langanke and P. Vogel, Phys. Rev. C56 (1997) 3079
- [27] B.D. Anderson, C. Lebo, A.R. Baldwin, T. Chittrakarn, R. Madey, and J.W. Watson, Phys. Rev. C 41 (1990) 1474.
- [28] J. Rapaport et al., Nucl. Phys. A410 (1983) 371
- [29] E. Caurier, G. Martínez-Pinedo, A. Poves and A.P. Zuker, Phys. Rev. C52 (1995) R1736
- [30] M. Ramdhane et al., Phys. Lett. (1998)
- [31] G. Audi, O. Bersillon, J. Blachot and A.H. Wapstra, Nucl. Phys. A624 (1997) 1
| nucleus | experiment | shell model | centroid | FFN |
|---|---|---|---|---|
| 51V | 1.20.1 | 1.4 | 5.18 | 3.83 |
| 54Fe | 3.30.5 | 3.6 | 3.78 | 3.80 |
| 55Mn | 1.70.2 | 2.2 | 4.57 | 3.79 |
| 56Fe | 2.80.3 | 2.7 | 2.60 | 3.78 |
| 58Ni | 3.80.4 | 4.4 | 3.75 | 3.76 |
| 59Co | 1.90.1 | 2.5 | 5.05 | 2.00 |
| 60Ni | 3.10.1 | 3.4 | 2.88 | 2.00 |
| 62Ni | 2.50.1 | 2.1 | 1.78 | 2.00 |
| 64Ni | 1.70.2 | 1.3 | 0.50 | 2.00 |
| Nuclei | Expt. | Shell Model |
|---|---|---|
| 51Cr | 27.7 d | 27 d |
| 53Fe | 8.51 m | 7.0 m |
| 54Mn | 312 d | 243 d |
| 55Co | 17.5 h | 16.7 h |
| 57Co | 272 d | 397 d |
| 57Ni | 35.6 h | 49 h |
| 58Co | 70.8 d | 50.8 d |
| 60Cu | 23.7 m | 13.5 m |
| 61Cu | 3.3 h | 5.0 h |
| final state | energy (exp) | energy (SM) | log ft (exp) | log ft (SM) |
|---|---|---|---|---|
| , T=0 | 3.926 | 4.495 | 4.2(2) | 4.38 |
| (, T=0) | 4.902 | 4.80 | ||
| , T=0 | 5.483 | 5.893 | 4.2(2) | 4.33 |
| , T=1 | 6.432 | 6.113 | 3.6(1) | 3.49 |
| (, T=1) | 6.335 | 4.28 |