Experimental and Theoretical Search for a Phase Transition in Nuclear Fragmentation
Abstract
Phase transitions of small isolated systems are signaled by the shape of the caloric equation of state , the relationship between the excitation energy per nucleon and temperature. In this work we compare the experimentally deduced to the theoretical predictions. The experimentally accessible temperature was extracted from evaporation spectra from incomplete fusion reactions leading to residue nuclei. The experimental dependence exhibits the characteristic S-shape at MeV/A. Such behavior is expected for a finite system at a phase transition. The observed dependence agrees with predictions of the MMMC-model, which simulates the total accessible phase-space of fragmentation.
pacs:
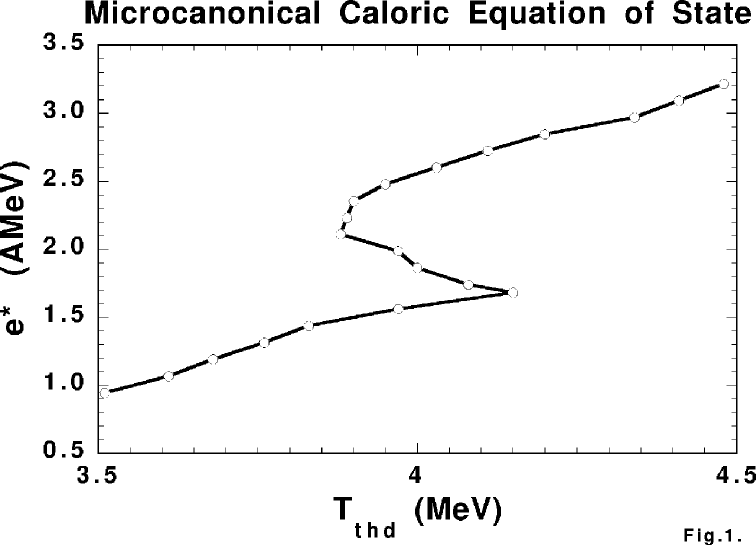
25.70Np 05.70Fh 21.10MaIn the macroscopic physics phase transitions are usually defined by a divergence at the critical temperature, for example in heat capacity , where and is the excitation energy and the thermodynamic temperature. This is corresponding to the well known finding that at a first order phase transition temperature stays constant while additional energy is pumped into the system. This picture becomes different if we deal with finite and isolated systems like nuclei. Due to conservation of mass, charge and especially total energy the signal of a first order phase transition is given by an ”S-shape” in , called the caloric equation of state (), as shown in the figure 1 for a decaying nucleus. Pictorially speaking we find that the system is cooling down with rising excitation energy at a first order phase transition in a finite system [1, 2, 3, 4, 5]. For a finite and isolated (microcanonical) system the heat capacity is no longer a positive definite quantity. At first-order phase transitions it has two divergences (instead of one for the infinite matter). In the region between the two poles it becomes a multi-valued function.
The signal of fig. 1 can be obtained only in a microcanonical description which takes into account the strict mass, charge and energy conservation. This behavior of a fragmenting nuclear system at a phase transition is due to the opening of new decay channels, i.e. the population of additional regions of phase space ( is here the excitation energy per nucleon) [2, 6]. In case of fig. 1 it is connected to the onset of IMF (intermediate mass fragment) emission and the new phase space associated to IMF. The specific entropy , N the number of nuclei, rises then higher compared to a normal Fermi-gas. It is this strong rise of entropy that leads to an anomaly in the by the relation
| (1) |
A recent experimental observation [11, 12] showing a structure in -curve fueled the discussion about the appearance and the measurement of a phase transition. It is known that apparent temperature is sensitively dependent on the mass of the source [9]. We suppose together with [13, 14] and in opposite to [15] that the curve shown in ref. [11] is just the effect of changing mass of the source without undergoing any phase transition. Another discussion can be seen in [16]. Here we concentrate on a different set of experimental data deduced from ref. [17].
We are going to perform a comparison of an experimentally obtained ”S-shape” in with theoretical predictions of the Berlin - microcanonical statistical multifragmentation model which simulates the phase space for decaying nuclei. We are going to describe the model in some detail at a later stage. predicts two phase transitions in nuclear fragmentation [6]. The phase transition at lower excitation energy at MeV per nucleon was shown in figure 1. A second phase transition at higher , which is not the subject of this treatise and not shown here, is due to the true multifragmentation.
Another similar statistical fragmentation model, the Copenhagen model SMM [7] also predicts phase transitions. Since SMM has some mixed microcanonical-canonical features and has a varying freeze-out volume [8] it produces a slightly different signal of a phase transition compared to MMMC.
The thermodynamical temperature , equation (1), cannot be accessed directly in an experiment. For the experimental comparison we need to find a related quantity which would keep the information on the behavior of [9, 10]. Such a quantity, which we call apparent temperature is thus not a temperature in the sense of thermodynamics.
In this work we show experimentally accessible ”S-shapes” of the extracted from incomplete fusion reactions resulting from 701 MeV 28Si + 100Mo [17]. We plot vs. , where (the apparent temperature) is the slope of the raw evaporation spectra.
The details of the experiment and the extraction of the needed parameters can be found in [17, 18]. Here we outline some of the important features. Heavy evaporation residues were detected at forward angles, therefore this experiment does not probe multi-fragment final states. Charged particles (including IMFs) and neutrons were detected in concentric 4-detectors. The excitation energy of the source was deduced from linear momentum reconstruction. The raw spectra of protons, deuterons, tritons and alpha particles were fitted with a three moving source prescription. The data at backward angles are well described by a surface-evaporating Maxwellian moving source:
| (2) |
where is the center of mass kinetic energy of the particles, the Coulomb barrier and , which is the slope of the raw spectra, is the desired apparent temperature.
Figure 2 presents the excitation energy per nucleon versus for protons, deuterons, tritons and alpha particles. This representation of the data exhibit two noteworthy trends. The first trend concerns the general shape of these curves and the second is the horizontal displacement (along the axis) as one progresses from protons to deuterons to tritons and alpha particles. We shall focus on the first observation although the second observation is also of interest and we shall briefly discuss it also. We find that all the four curves for different particles show an ”S-shape” in the expected region of excitation energies (compare to fig. 1), but no backbending is seen. Here one needs to keep in mind that the experimental data points correspond to sources which are slightly changing with the excitation energy. From lowest to highest energy the mass is growing from 105 to 122 nuclei and the charge from 47 to 54. We expect this change in mass and charge to smear out the ”S-shape” with a backbending shown in figure 1.
Next we are going to perform a comparison to the MMMC-model simulation.
The -model assumes that the compound system fragments quite early but the fragments remain stochastically coupled as long as they are in close contact. Consequently, the system is equilibrated inside a freeze-out volume. The size of this volume, which is a simulation parameter of is in our energy region at about 6 times the normal nuclear volume. This corresponds to an average maximum distance between the fragments of fm. Here the nuclear interaction between the fragments drops to the point that subsequent mass exchange is unlikely. Then the fragments (which can be in excited states) leave this volume and may de-excite as they trace out Coulomb-trajectories. The ensuing formation of fragments is determined by the accessible phase space which is sampled with the Monte Carlo method using the Metropolis importance sampling.
The experimental analysis of the data provides the values of the mass , charge , excitation energy , and angular momentum of the source [17], which are the input into the simulation. The only simulation parameter of the model, the freeze-out radius was taken as its standard value of fm, this means that we simulate a phase transition at constant volume. The results of calculations, performed with these input values, were subjected to a software filter of the experimental set-up which, most importantly, selects only those events with one big residue. The mass of the residue was chosen to be , which is close to estimated from the experimental data (the experiment did not directly measure the mass of the residue).
Figure 3 shows a comparison of the curves extracted from the experimental data for protons and -particles to the dependence deduced from the -model [6] using its standard parameters. Also the experimental uncertainties for the proton and alpha curves are given. The horizontal bars give the statistical uncertainty to extract the temperature (slope) from the experimental raw spectra. The vertical bars (here only given at the lowest and highest proton or alpha point) indicate the systematic difference of the excitation energy extracted by the ”top-down” resp. the ”bottom-up” procedures employed in ref.[17]. The two alternative methods lead essentially to an up or down shift of the curve without changing the main structure of the curves. The similarity of the shapes of the experimental and simulated is quite evident. The differences between the shapes of these curves and the parabolic dependence (dotted curve) expected for a simple Fermi gas is clearly seen indicating that some additional degrees of freedom, which are apparently included in the -model, become significant in this energy range.
The theoretical value of was extracted from fitting, as was done for the raw experimental spectra. It is worth noting that calculated temperatures , extracted from the Maxwellian fits, are close though not identical to the unique thermodynamical temperatures from the equation 1, as can be seen from comparing figure 1 and figure 3. The curve in figure 1 is calculated for the mass and charge corresponding to the highest value of experimental energies, but for the whole energy range.
The values of and do not influence the general shape of the calculated curves. However, the curves shift along the - axis if different values of these parameters are used. The shifts produced by reasonable changes in are larger than those produced by reasonable changes in . We checked that the anomaly in the is not due to the changes of the angular momentum from to . It exists also at .
While the similarity of the shapes of the experimental and simulated is good for p’s and -particles, significant differences exist. The simulated curves for deuterons and tritons (not shown here) have the same shape but are shifted towards lower values of . The higher values of the experimental deuteron and triton spectra might be an indication that the production of these less bound fragments might occur in an earlier hotter stage of the reaction, an ingredient not included in the .
We have also compared the multiplicities of neutrons , protons , deuterons , tritons and alpha calculated with with the experimental values. The total number of the evaporated particles is the same in the calculation and experiment. The model overestimates by approximately a factor 1.3 and underestimates by a factor of 2. The calculation reproduces and at all values of . On the other hand, the values of are not reproduced by the model calculation, which systematically predicts values which are too high. In this context one should keep in mind: In we treat deuterons as spherical nuclei with normal nuclear matter density. This may overestimate their stability.
The experimental data also suggest an association between the onset of significant IMF production and the upswing in the dependence. This is seen in figure 5 where the measured absolute IMF-multiplicities () associated with the experimentally selected events which produce a large residue are compared to the absolute of the corresponding events from the model calculation. (The smooth dependence of on the excitation energy underlines the high statistical quality of both experimental and simulated data.) Both the data and the calculations exhibit a dramatic increase in for between and MeV/A. The primary difference between the experimental data and the model predictions is that the ’s rise at higher -values for the model predictions than they do for the experimental data. Another point worth noting is that the values of in these decay-channels are less than . In other words, most (more than %) of the selected events (both in the experiment and in the model calculation) have no IMF.
Besides the overall agreement in the experimental an theoretical some uncertainty of the interpretation remains. There are too few experimental data points outside the ”S-shape” region to interpret the data unambiguously. Further there is a small change in the charge and mass of the source for different excitation energies. Therefore it is desirable to perform a similar experimental analysis covering a larger range of excitation energies and selecting a strictly constant and for the whole energy range.
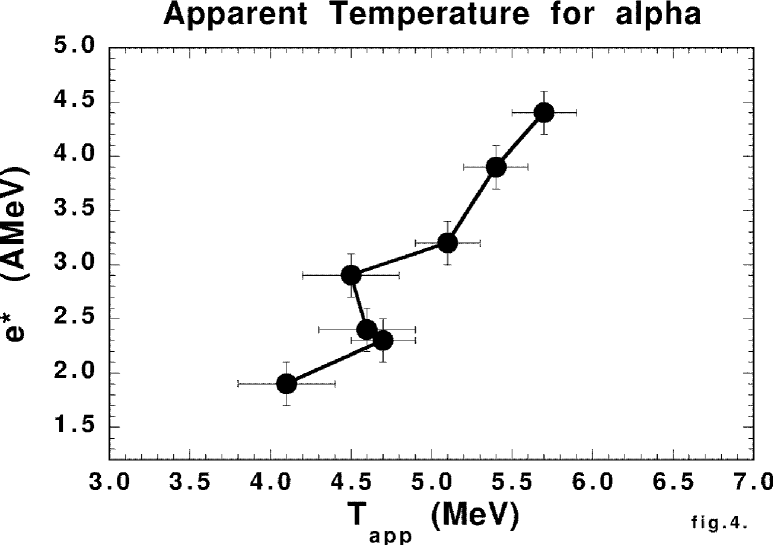
Finally, we would like to point out that the extracted temperatures for and -particles in related earlier experimental work by the Texas A&M-group [21], exhibit trends similar to those presented here. This data is for similar masses of compound nucleus ranging from 109 to 128 and in the same energy region. We plot the data for the apparent temperatures for alphas in figure 4. The proton data (not plotted here) show also a similar backbending. Despite the large error-bars this shape anomaly had already been noted and was well reproduced by in fig. 13 of ref.[6].
In this paper we have shown that a strong anomaly exists in the shape of the experimental for the apparent temperature. This ”S-shape” suggests that the relevant phase space becomes enlarged in the region of . In terms of thermodynamics this is associated with a phase transition for this isolated, strongly interacting quantal system. MMMC-model reproduces the general shape of the experimental curve at right excitation energies. This supports the hypothesis of strong stochastic mixing of the various fragmentation channels and the statistical equilibration at freeze-out. As the production of intermediate mass fragments increases dramatically in this region of excitation energy we associate the ”S-shape” to the additional phase space opened by IMF production. This association is also supported by the results of the calculation where the ”S-shape” in is seen in the energy region of strongly increasing .
More to the point the ”S-shape” in the caloric equation of state associated with IMF production is even seen in the evaporation spectra of different particles in events which in more than % of the cases have no IMF. In addition, the calculations are rather insensitive to variations of its basic model parameter, the freeze-out volume within broad limits [6] and thus no adjustment of this parameter was necessary to reproduce the general shape of the experimental caloric equation of state. Prior to this work the primary evidence of the validity of the concept of stochastic coupling of two moving nuclei in proximity was the finding of a strong pre-barrier surface friction in deep inelastic collisions [19]. An experimental support for the equilibration hypothesis was given also at higher excitation energies in [20].
While this work adds weight to the argument that strong stochastic mixing and equilibration exists up to rather extended configurations of the fragmented source, we do not believe that the issue is closed. For while the general shape of the caloric equation of state was reproduced by the model, differences exist with particle type which may imply the existence of a dynamics or a (mean) sequence, which is not dealt with by the single freeze-out configuration of the model.
Taking all the findings together, the anomaly in all four spectra (proton, deuteron, triton, and alpha) at the same excitation energy as predicted by and also the earlier data by the Texas A&M-group (fig. 2, 3 and 4), we see a strong support for the significance of our interpretation of the ”S-shape” in the as a signal of a phase transition in nuclear fragmentation. The transition is from pure evaporation to asymmetric fission, which is associated to the onset of IMF emission. Nevertheless, additional experimental and theoretical confidence is desirable.
O.S. is grateful to GANIL for the friendly atmosphere during her stays there. This work is supported in part by IN2P3/CNRS.
REFERENCES
- [1] D.H.E. Gross, A. Ecker and X.Z. Zhang. Ann. Phys, 5, 446 (1996)
- [2] A. Hüller, Z. Phys. B93, 401 (1994); Z. Phys. B93, 401 (1994)
- [3] D.H.E. Gross. Phys. Rep. 279, 119 (1997)
- [4] M.Bixon and J.Jortner. J. Chem. Phys 91(3), 1631 (1989)
- [5] O. Schapiro Microcanonical phase transitions - Fragmentation and Coulomb explosion of metal clusters. Wissenschaft und Technik Verl. Berlin, 1997
- [6] D.H.E. Gross, Rep. Prog. Phys. 53 (1990) 605-658.
- [7] J. Bondorf, A.S. Botvina, A.S. Iljinov, I.N. Mishustin and K. Sneppen. Phys. Rep. 257 (1995) 133.
- [8] D.H.E. Gross and K. Sneppen. Nucl. Phys. A567, 317 (1994)
- [9] A. Le Fevre, O. Schapiro and A. Chbihi, Study of thermometers for measuring a microcanonical phase transition in nuclear fragmentation, Preprint
- [10] F. Gulminelli and D. Durand. Nucl. Phys. A 615 (1997) 117-134
- [11] J. Pochodzalla et al., Phys.Rev.Lett. 75, 1040 (1995)
- [12] J.A. Hauger et al., Phys. Rev. Lett. 77, 235 (1996)
- [13] J. Natowitz et al.,Phys. Rev. C 52 (1995) R2322
- [14] Y.-G. Ma et al., Phys. Lett. B 390 (1997) 41
- [15] S.J. Lee and A. Z. Mekjian, Phys. Rev. C56 (1997) 2621
- [16] J. Pochodzalla, Progress in Particle and Nuclear Physics 39 (1997) 443-501
- [17] A. Chbihi et al., Phys. Rev. C 43, 652 (1991).
- [18] A. Chbihi et al., Phys. Rev. C 43, 666 (1991).
- [19] D.H.E. Gross and H. Kalinowski, Phys.Rep. 45 177 (1978)
- [20] N. Marie et al., Phys. Rev. C 58, 256 (1998)
- [21] R. Wada et al. Phys. Rev. C 39, 497 (1989)
The error-bars are given in fig.3.