COMPRESSION AND EXPANSION IN CENTRAL COLLISIONS111Talk given at the Int. Research Workshop on “Heavy Ion Physics at Low, Intermediate, and Relativistic Energies with 4 Detectors”, Poiana Brasov, Romania, 7-14 October, 1996.
Abstract
Dynamics of central collisions of heavy nuclei in the energy range from few tens of MeV/nucleon to a couple of GeV/nucleon is discussed. As the beam energy increases and/or the impact parameter decreases, the maximum compression increases. It is argued that the hydrodynamic behavior of matter sets in the vicinity of balance energy. At higher energies shock fronts are observed to form within head-on reaction simulations, perpendicular to beam axis and separating hot compressed matter from cold. In the semicentral reactions a weak tangential discontinuity develops in-between these fronts. The hot compressed matter exposed to the vacuum in directions parallel to the shock fronts begins to expand collectively into these directions. The expansion affects particle angular distributions and mean energy components and further shapes of spectra and mean energies of particles emitted into any one direction. The variation of slopes and the relative yields measured within the FOPI collaboration are in a general agreement with the results of simulations. As to the FOPI data on stopping, they are consistent with the preference for transverse over the longitudinal motion in the head-on Au + Au collisions. Unfortunately, though, the data cannot be used to decide directly on that preference due to acceptance cuts. Tied to the spatial and temporal changes in the reactions are changes in the entropy per nucleon.
1 Introduction
In my talk, I shall discuss the dynamics of central heavy-ion reactions in the energy range from few tens of MeV to a couple of GeV per nucleon. I shall use simple estimates, data, and transport reaction simulations, to reach conclusions. When moving from low to high energies, from light to heavy systems, or from high to low impact parameters, I will argue, the onset of hydrodynamic behavior in collisions is demarked by the balance energy. Transport simulations indicate that in the high-energy head-on collisions of nuclei, in the hydrodynamic regime, nuclear shock waves develop, perpendicular to the beam axis, separating hot compressed nuclear matter from cold matter. With time, the compressed matter exposed to the vacuum acquires collective motion giving rise to a characteristic behavior of transverse cm spectra of different particles with mass. At finite impact parameters a so-called weak discontinuity develops in-between the shocks. Both the motion associated with the discontinuity and the expansion contribute to the sideward flow. Recently FOPI data became available on stopping and on expansion in central collisions. I shall examine to what extent these data are consistent with the above scenario. Finally, I shall discuss the production of entropy in collisions and conclude.
2 Onset of Hydrodynamic Behavior: Balance Energy
The hydrodynamic behavior requires a local equilibrium and, thus, a small mean free path, fm, compared to the size of a system, . Here is density and the effects of Pauli principle are ignored. The condition implies that the hydrodynamic behavior is more likely in the interactions of heavy than of light nuclei, and in the more central than in peripheral collisions. Adding to this consideration, the effects of the Pauli, lengthening the mean free path, can slow down the equilibration required for the hydrodynamic behavior, at low beam energies. At moderate energies the momentum dependence of nuclear mean field may cause a reduction in the number of NN collisions affecting equilibration.
At low energies, nuclei colliding at moderate to high impact parameters are expected to clutch and rotate in a binary system, emitting particles to negative angles. At high energies, high pressure should develop in the region between the nuclei, expelling nucleons and the residual nuclei to positive angles. For emission quantified in terms of the average momentum in the reaction plane as a function of rapidity , the slope of the dependence on rapidity should then change sign, when going from low to high bombarding energies, at the so-called balance energy. I will argue that, whether in the bombarding energy or in the impact parameter, the balance energy demarks the onset of the hydrodynamic behavior.
By investigating the magnitude of the flow, at midrapidity, the balance energy has been studied [1] as a function of the reduced impact parameter , in the system 40Ar + 45Sc. The energy was observed to rise with the rise in , see Fig. 1.

The measurement is consistent with the hydrodynamic behavior setting earlier in the more central than in the more peripheral collisions as the beam energy increases (see also Ref. \citelowbut95). The dependence of the balance energy on total mass for symmetric systems is shown in Fig. 2.

The balance energy is higher for light systems and lower for heavy systems, consistent with the hydrodynamic behavior setting earlier in the heavy than in the light systems. The balance energy calculated with the transport model [5] strongly depends on NN cross sections; better agreement with the data is obtained for reduced than for free-space cross-sections.
In the measurements such as e.g.,\citelowpak96,wes93,but95 there has been no control on the direction of the reaction plane. Thus only a suppression of the slope of at midrapidity could be observed as a function of the beam energy. Principally, one might imagine that at the deduced balance energy only a suppression of the slope takes place without a change in sign. Recently in the experiment,\citelowlem96 though, the polarization of rays from a residual target nucleus has been measured, in the 14N + 154Sm reaction at 35 and 100 MeV/nucleon, in coincidence with the emission of energetic particles at . For intermediate reduced impact parameters , the polarization was found to change sign in-between 35 and 100 MeV/nucleon, in a manner consistent with the change of sign of the flow, from negative (attractive) to positive (repulsive). For high , the sign of the polarization was found such as for an attractive flow at either of the beam energies.
Let us try to understand the mass dependence of the balance energy in some detail; we shall consider a symmetric reacting system. As the nuclei come into contact, the forces that act on each include the force due to pressure in the neck region with equilibrium and dissipative terms, the proximity force acting within the circumference of the neck, and the Coulomb force,
| (1) |
The pressure within the neck region is
| (2) |
where the first term on the r.h.s. is equilibrium pressure, next is a portion of the viscosity tensor that contributes to transverse force, and final term is the finite-range correction. The factor in the viscous term is viscosity coefficient. The proximity force may be estimated either from the finite-range term in (2) or by considering the surface energy within the system, obtaining
| (3) |
where MeV/fm2 is the surface tension and is the nuclear radius. The proximity force is proportional to neck circumference. The Coulomb force may be estimated as MeV/fm. Given that no compression is expected at high impact parameters,[7] the equilibrium pressure can be estimated as . Finally, the dissipative viscous correction to pressure may be estimated as (an additional, nominally dissipative, correction may arise from the momentum dependence of the mean field). At the balance energy the net force acting on any of the nuclei vanishes, i.e.
| (4) |
where has been used as an estimate for the neck area. Solution of Eq. (4) gives
| (5) | |||||
where is Fermi energy and the last result is given in MeV ( is the total mass of the system). The crude estimate (5) is shown with a solid line in Fig. (2). Quantitative result allows to conclude the following. The nonequilibrium correction in the pressure is very important; if this correction were omitted the balance energy would turn out to be 4 times too low compared to data. Observed large balance energies demonstrate that little compression is reached in periphery; if one assumed that all c.m. energy per nucleon were used up in a compression, the balance energy from (4) would underestimate data by an order of magnitude. The sensitivity to elementary cross sections for light nuclei, with , seems to explain the rise of balance energy with the rise in the isospin asymmetry found in the transport calculations; [8] the weakening of the mean field should act to reduce rather than to increase the balance energy.
3 Head-On Reaction Simulations
Dynamics of nuclear reactions above the balance energy has been studied in some detail following simulations based on the Boltzmann equation with a density and isospin dependent mean field, free NN cross-sections, and composite production, in Ref. \citelowdan95 and elsewhere. It is possible to break the dynamics into several stages. A 400 MeV/nucleon Au + Au system at , for which baryon-density contour-plots are shown in Fig. 3, will serve to illustrate points. Unless otherwise indicated the results of simulations will correspond to a stiff equation of state with an incompressibility of MeV.

Following an initial interpenetration of projectile and target densities, the collisions begin to thermalize matter in the overlap region making the momentum distribution there centered at zero momentum in the c.m.s. The density in the overlap region rises above normal and a disk of excited and compressed matter forms at the center of the system. More and more matter dives into the region with compressed matter that begins to expand in transverse directions. At late stages, when the whole matter is excited, transverse expansion predominates. A further view at the situation in reaction at is given in Fig. 4.

If a nuclear system were very large, then it would be necessarily ruled by laws of hydrodynamics. In the initial state of a head-on reaction, a discontinuity exists in the velocity field at the contact area of two nuclei, with the velocities in the nuclei directed opposite. Within hydrodynamics, such an initial discontinuity would have to break at finite times into two shock fronts travelling in opposite directions into the projectile and target. To assess whether the interfaces between normal and compressed matter, cf. Figs. 3 and 4, may be interpreted as the shock fronts, one can ask whether the state of the matter at the center is such as expected behind a developed front. Properties of the matter behind a front can be determined, in a straightforward manner, from the conservation of hydrodynamic fluxes of baryon number, momentum, and energy. Figure 5

displays some of these properties, baryon density, temperature, and entropy per baryon, together with a maximum density and entropy per baryon at a maximum density, from simulations. The latter quantities generally follow the trends anticipated from hydrodynamics. The shocks are nearly completely developed in the high-energy simulations of the head-on reactions of heavy nuclei.
Let us now turn attention to the expansion. The hot matter in-between the shocks is exposed in transverse directions to vacuum and, as the pressure of the hot matter is finite and that of vacuum is zero, the matter begins to expand collectively into transverse directions. The features of this process may be understood at a qualitative level in terms of the self-similar cylindrically-symmetric hydrodynamic expansion. In the self-similar expansion, the velocity is proportional to the distance from symmetry axis, , which roughly holds in the direction of 90∘ in the Au + Au collision at 400 MeV/nucleon, at the center of the system, see Fig. 4. On solving, in a near-analytic manner, the hydrodynamic equations of motion for the expansion,[7] one arrives at the expectation that the matter should accelerate collectively in the transverse direction for a time , where is the speed of sound. This time is such as necessary for a signal to propagate into the interior. It is generally consistent, fm/c, with the time during which collective transverse energy, calculated from the local collective velocities
| (6) |
After shocks reach the vacuum after a time fm/c, where is the initial velocity in the c.m. and is the density in the shocked region, an expansion along the beam axis sets in, see Fig. 4. However, as the expansion in transverse directions is already in progress and matter becomes decompressed, the expansion in longitudinal direction does not acquire same strength.
While definite features of reaction dynamics appear to be consistent with a hydrodynamic behavior of the matter, there are also important differences. For example, in a system continuing to expand hydrodynamically temperatures would have dropped to zero and all kinetic energy would have got converted into collective energy of expansion. For that collisions would need to continue down to very low densities. The transverse collective energy from (6) freezes out at about 40 MeV/nucleon. With about 10 MeV/nucleon of longitudinal collective energy, one finds that for nucleons the net collective energy constitutes about 50% of the kinetic energy in the c.m. for a 400 MeV/nucleon reaction.
4 Semicentral Reactions
In the initial state, an angle of inclination of the plane of discontinuity in velocity, relative to the beam axis, is given nonrelativistically by
| (7) |
While at velocities are normal to the plane of discontinuity, the velocities have finite tangential components relative to that plane at finite . Such components are continuous across the shocks which detach from the initial plane of discontinuity and, with tangential components being directed opposite for the matter from a projectile and from a target, at the center of the system a so-called tangential discontinuity develops, see the sketch in Fig. 6.

Density, pressure and entropy are continuous across that discontinuity. Only the tangential velocity component changes.
As only the normal velocity component drops to zero across shocks, the shocks are weaker at a finite than in a head-on reaction. With the normal component being equal to , the effective c.m. kinetic energy for a shock at a finite becomes
| (8) |
rather than in the nonrelativistic approximation. In consequence, the density behind a shock at a finite should be lower than at and it should, in fact, coincide with the density in a reaction at beam energy reduced by a factor . That is tested in the upper panel of Fig. 5. In the 1 GeV/nucleon reaction the density appears to follow the above expectation up to very high impact parameters.
While a shock width generally does not change with time, if conditions at the two sides of a shock wave stay the same, the width of a weak discontinuity increases with time. That this is the case, may be seen by adapting the Navier-Stokes equations to the conditions in the vicinity of a weak discontinuity and by observing that the equations reduce there to a diffusion equation for a tangential velocity component. The diffusion coefficient is equal to the kinetic viscosity coefficient , where is viscosity. With an initial condition for the tangential velocity in the ideal-fluid limit in the form , the solution to the diffusion equation becomes , where is the distance along a line perpendicular to the discontinuity, i.e. the width increases as . If a nuclear system were very large, then the two shock waves and a weak discontinuity would well separate from each other, as the distance between the shocks increases as . In actual simulations, though, the tails of discontinuities overlap, cf. Fig. 7.

In that figure, the center of the shock is at a position fm, where density rises to the mean of that in normal matter and that at the center of the system, where, further, entropy per nucleon rises to a half of its maximum value, and where magnitude of the normal velocity component drops to a half of the asymptotic value. The center of the tangential discontinuity in the figure is, on the other hand, at , where tangential velocity component vanishes. The width of the discontinuity is characterized by fm which agrees well with expected from the simple formula, given above, for the space and time behavior of the tangential velocity.
Let us start to confront the findings with some data. Just as at in a heavy system, an expansion develops at a finite in-between the shock waves, as an effect of the exposure of the hot matter to vacuum. Anisotropy in the expansion, with regard to the direction perpendicular to the reaction plane and the direction of the shock motion, results from the delay in the start of expansion in the latter direction, as in the case . The anisotropy (squeeze-out) may be quantified with a ratio of the eigenvalue of the kinetic energy tensor associated with the direction out of the reaction plane, to the smaller of the eigenvalues associated with the directions within the plane,
| (9) |
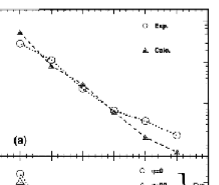
As in a heavy system (but not in light), the ratio tends to . The Au + Au data for the ratio [9] are compared to the results of calculations, corrected for the experimental inefficiencies, in Fig. 8.

At 250 MeV/nucleon and 400 MeV/nucleon a degree of agreement between the data and the calculations is observed. The inefficiencies reduce the sensitivity of the ratio to the nuclear compressibility.
With regard to the directions within the reaction plane, both the tangential motion behind the shock waves for finite impact parameters, and the anisotropy in expansion, contribute to the sideward deflection quantified usually in terms of the slope of mean momentum within the reaction plane at midrapidity, . Measured and calculated slopes in the 400 MeV/nucleon Au + Au reaction are shown in Fig. 9.

If the motion associated with the weak discontinuity were not contributing to the sideward deflection, then the slope would have been limited from above [7] by where and the energy components are from a reaction. For protons from 400 MeV/nucleon reactions this limit is equal to 0.22, while slopes given in Fig. 9 reach values twice as high.
5 Comparisons to FOPI Data
As , the expansion of matter between the shocks, favoring the transverse direction of motion, competes with the transparency effects in the corona, that favor the longitudinal direction. For light systems in simulations, such as Ca + Ca, the transparency effects prevail, leading to at , but not so for heavy systems such as Au + Au, as was discussed and as is evidenced in Fig. 3. The experimental detection of , i.e. , would demonstrate a violence of the nuclear hydrodynamic phenomena in heavy systems. On the other hand, if for any reason the in-medium NN cross sections were lower than the free-space cross-sections used in the simulations, then the transparency effects could prevail over the anisotropy in the expansion, even within heavy systems. A clear experimental answer requires a full coverage either in the forward or in the backward c.m. hemisphere.
Generally, the experimental determination of the average anisotropy of momentum distribution in collisions may be difficult, due to the contaminations of event samples by events corresponding to intermediate . The idea borne within the FOPI collaboration [11] has been then to employ, for comparisons to model calculations, the differential cross sections for anisotropies quantified in terms of the event-by-event energy ratio, sometimes termed ,
| (10) |
where the sums extend over detected charged particles from collisions emerging in the forward c.m. hemisphere. In Phase I, the FOPI detector setup covers laboratory angles for the full azimuth, with a broader range expected in Phase II. The cross sections for the energy ratio measured [12, 13, 11] in the 250 MeV/nucleon Au + Au reaction are shown in Fig. 10

together with the results of calculations filtered through the acceptance of the FOPI apparatus. The calculations were carried out for a stiff () and for a soft () equation of state, without ( and ) and with () momentum dependence, for free-space cross sections and for cross sections reduced (in the case) by a factor exponentially dependent on density,
| (11) |
Because of the acceptance cuts, no events above or in the vicinity of can be actually observed in Fig. 10. The comparison between the data and calculations at 250 MeV/nucleon and at other energies, shows that the data allow only for a small reduction () in the NN cross-sections in the simulations with a stiff equation of state and hardly for any reduction in the simulations with a soft equation. Values as large as , for the stiff equation of state, are required for the transparency to prevail over the transverse expansion in the Au + Au collisions. When the acceptance cuts are removed, the cross sections from simulations extend well above , see Fig. 11.

It should be possible to observe such distributions within the Phase II of the FOPI experiment. Figure 12

shows the differential cross section computed with cuts and broken down into contributions from narrow -intervals. The figure demonstrates that selecting the highest values can yield a surprisingly pure sample of most central events with fm.
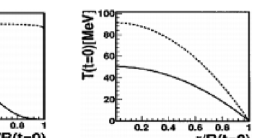
The transport simulations demonstrate various effects of the anisotropy in the collective expansion on observables from the collisions. However, the collective expansion should also affect observables at any one angle. Thus, in a globally equilibrated system, exponential spectra would be expected at any angle, with the same slope parameter for different particles, equal to the temperature, . In the presence of the collective expansion, on the other hand, the particle spectra should exhibit different slopes for particles with different mass, with particle spectrum becoming flatter as particle mass increases. This is due to an increased sensitivity to the collective motion with an increasing mass; for the average kinetic energy of a particle, one would, in fact, expect a linear rise with the mass number,
| (12) |
where is collective velocity and a uniform temperature is assumed. The spectra of light particles from the FOPI measurements [14] and from the calculations [7] are shown in Fig. 13,
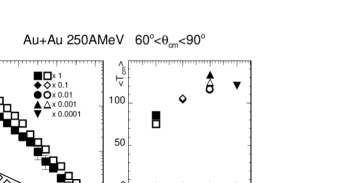
together with the average energies as a function of the mass number and with the relative particle yields. Similar flattening of the spectra with particle mass is observed for the data and for the calculations. The average kinetic energies are consistent and they rise approximately linearly with the mass for the lightest fragments, exhibiting the presence of the collective expansion. Also the particle yield ratios, shown in Fig. 13, are rather consistent at 250 MeV/nucleon between the theory and experiment. These ratios reflect the entropy produced within the system, as, in the limit of Boltzmann statistics,
| (13) |
6 Entropy Production
While the entropy produced in reactions attracted much experimental attention in the past, this has not been the case recently. Yet, the entropy ties in an interesting fashion to the reaction dynamics and it may, principally, provide information on the low-density phase transition.
The entropy in central reactions of heavy nuclei comes from several sources. Most of the entropy per nucleon in the participant region at is produced in shock waves, see Figs. 4, 5, and 14.

Additional entropy is produced during expansion. The hydrodynamic Navier-Stokes equations yield for the rate of change of the local entropy per baryon with time
| (14) | |||||
where is heat capacity coefficient and is viscosity coefficient. Whereas the viscosity term on the rhs of (14) always leads to the rise in local entropy, the heat conduction term may cause a local drop, although still the entropy increases on a global scale. The latter is the case when the temperatures on the average decrease as one moves away from a considered point.
In the collective expansion, the edges of participant matter cool off; in an isentropic expansion and thus as . Then the heat conduction, or simply flux of energetic nucleons from the inner region, reheats the outside matter, significantly raising the entropy there, see Fig. 4. Within the inner region the entropy per nucleon decreases. For 400 MeV/nucleon Au + Au collision, analytic estimates with Eq. (14) yield an overall increase in the entropy on account of the heat conduction, and, practically, no increase on account of viscosity due to the lack of shear in a central collision. As increases, shear appears and then the entropy gets to be produced through viscosity as the weak viscosity spreads, cf. Fig. 14. Moreover, the production of the entropy per nucleon in the participant region during expansion rises, since the size of the region diminishes, .
In a recent investigation [17], Petrovici et al. attempted to describe, simultaneously, the yields and the average energies of intermediate-mass fragments from central 250 MeV/nucleon Au + Au collisions, in terms of an analytic ideal-fluid hydrodynamic model [18] combined with a model of statistical disassembly. Within an ideal-fluid model the entropy per nucleon is conserved along a streamline; there is no entropy production. If the initial entropy rises or declines with distance the from the center, so does the entropy towards the freeze-out. The parameter within the model, regulating the shape of initial density, regulated simultaneously the entropy. Best fit to data was obtained for the entropy sharply rising with the distance from the center, cf. Figs. 15
and 16,
consistent with Fig. 4. Such variation of the entropy favors, cf. Eq. (13), the production of heavier fragments within the inner region of matter and of lighter fragments outside, see Fig. 16. The collective energy per nucleon is lower inside and higher outside within the model and according to the simulations.
As is apparent, the change in entropy with the impact parameter is tied to quite nontrivial aspects of reaction dynamics. Even at one impact parameter, in very central reactions, fragments with different masses may be associated, due to a variation of the entropy, with different regions and emission times. It may be worthwhile to study directly the entropy and the collective energy as a function of mass accessing the spatial and temporal changes in a reaction.
7 Conclusions
To summarize, the dynamics of central energetic heavy-ion collisions proceeds through numerous complex stages. As the beam energy increases and/or the impact parameter decreases, the maximum compression increases. Hydrodynamic behavior of matter sets in the vicinity of balance energy. At that energy, the bulk pressure competes with viscous effects and with the proximity force. The polarization measurements show directly the change in sign of the nuclear deflection at the balance energy. At higher energies shock fronts are observed to form in the head-on reaction simulations, perpendicular to beam axis and separating the hot compressed matter from the cold. In the semicentral collisions a weak tangential discontinuity develops in-between the shock fronts. The hot compressed matter exposed to the vacuum in directions parallel to the shock fronts begins to expand collectively into these directions. The expansion affects particle angular distributions and mean energy components and further shapes of spectra and mean energies of particles emitted into any one direction. The variation of slopes and the relative yields measured within the FOPI collaboration are in a general agreement with the results of simulations. As to the FOPI data on stopping, they are consistent with the preference for transverse over the longitudinal motion in the head-on Au + Au collisions. However, the data cannot be used to decide directly on that preference due to acceptance cuts. Tied to the spatial and temporal changes in the reactions are changes in the entropy per nucleon. Different fragments are associated with regions of different entropy values. Besides the participant entropy varies with impact parameter. The entropy sources include shock waves, weak discontinuity and dissipation in expansion.
Acknowledgment
This work was partially supported by the National Science Foundation under Grant PHY-9403666.
References
References
- [1] R. Pak et al., Phys. Rev. C 53, R1469 (1996); Phys. Rev. C 54, 2457 (1996).
- [2] S. Soff et al., Phys. Rev. C 51, 3320 (1995).
- [3] A. Buta et al., Nucl. Phys. A584, 397 (1995).
- [4] G. D. Westfall et al., Phys. Rev. Lett. 71, 1986 (1993).
- [5] D. Klakow et al., Phys. Rev. C 48, 1982 (1993).
- [6] R. Lemmon et al., in preparation.
- [7] P. Danielewicz, Phys. Rev. C 51, 716 (1995).
- [8] B.-A. Li et al., Phys. Rev. Lett. 76, 4492 (1996).
- [9] M. B. Tsang et al., Phys. Rev. C 53, 1959 (1996).
- [10] H. Å. Gustafsson et al., Mod. Phys. Lett. A 3, 1323 (1988).
- [11] W. Reisdorf, private communication.
- [12] T. Wienold, Ph. D. Thesis, U. Heidelberg, Report GSI-93-28, 1993.
- [13] T. Wienold et al., in Proc. 10th Winter Workshop on Nuclear Dynamics, Snowbird, 1994, ed. J. Harris, World Scientific, 1994, p. 288.
- [14] G. Poggi et al., Nucl. Phys. A586, 755 (1995).
- [15] K. G. R. Doss et al., Phys. Rev. C 37, 163 (1988).
- [16] C. Kuhn et al., Phys. Rev. C 48, 1232 (1993); J. P. Coffin et al., Centre de Recherches Nucleaires Strasbourg Report CRN 93-50 (1993), and in Proc. NATO ASI on Hot and Dense Nuclear Matter, Bodrum, 1993.
- [17] M. Petrovici et al., Phys. Rev. Lett. 74, 5001 (1995).
- [18] J. P. Bondorf, S. I. A. Garpman, and J. Zimànyí, Nucl. Phys. A296, 320 (1978).