Superdeformation and hyperdeformation in the 108Cd nucleus.
Abstract
The superdeformation and hyperdeformation in 108Cd have been studied for the first time within the framework of the fully self-consistent cranked mean field theory, namely, cranked relativistic mean field theory. The structure of observed superdeformed bands 1 and 2 have been analyzed in detail. The bumps seen in their dynamic moments of inertia are explained as arising from unpaired band crossings. This is contrary to an explanation given earlier within the framework of projected shell model. It was also concluded that this nucleus is not doubly magic SD nucleus.
pacs:
21.60.Jz, 21.60.Cs, 27.60.+jSince the discovery of superdeformation in 152Dy two decades ago Dy152 , nuclear super- and hyperdeformation have been in the focus of attention of nuclear structure community. At present, superdeformation (SD) has been discovered in different mass regions and extensively studied experimentally SD-sys and theoretically (see, for example, Ref. A150 and references therein). On the other side, nothing is known experimentally about hyperdeformation (HD) apart from some indications of this phenomenon at low spin in the uranium nuclei K.98 .
Recent observation of the very extended shapes in 108Cd Cd108-1 ; Cd108-2 has opened new region of superdeformation and renewed interest to the study of hyperdeformation HD . Two SD bands have been found in this nucleus. In the present manuscript, they are labeled according to Ref. Cd108-2 , namely, the lowest SD band as band 1 and the excited SD band as band 2. These experiments were strongly motivated by earlier calculations of Ref. WD.95 and more recent studies of Ref. C.01 .
So far theoretical interpretation has been performed only for band 1 within the framework of projected shell model (PSM) (Ref. PSM ). Clear deficiency of this description is the fact that the equilibrium deformation is not defined within some “variational” procedure, but is adjusted for a better description of moments of inertia. It was concluded in Ref. PSM that the low- proton orbitals are responsible for the observed bump in the dynamic moment of inertia at low rotational frequencies and that the 2-quasiparticle configurations from these orbitals dominate the structure of the observed states. However, it is well known that the pairing is considerably quenched at high rotational frequencies and superdeformation SGBGV.89 ; CNS . For example, no paired band crossing is observed above rotational frequencies MeV in the A150 ; A150-sp ; VRAL and MeV in the A60 ; VRAL mass regions of superdeformation and the experimental data above these frequencies are well (within accuracy for the moments of inertia) described by the cranked relativistic mean field (CRMF) theory with no pairing. Considering that the mass region of superdeformation is located between these two regions, it is reasonable to expect that the influence of pairing will be negligible above MeV. Thus, rephrasing the results of the PSM studies in Ref. PSM to the language of the calculations without pairing, one can conclude that the configuration has to be assigned to the band 1 in 108Cd above the band crossing. The SD configurations are active in the medium-mass part of the rare-earth region of superdeformation [Gd () nuclei] A150 . However, the Fermi level is located at much lower in 108Cd as compared with the mass region of superdeformation, and, thus, considerably larger deformation and higher rotational frequencies than in the rare-earth region of SD will be required to have the two lowest proton orbitals occupied.
In the present manuscript, the CRMF theory KR.89 ; A150 is used for detailed investigation of the structure of observed SD bands in 108Cd and the nature of hyperdeformation in the mass region. Additional insight has been provided by the cranked Nilsson-Strutinsky (CNS CNS ) calculations performed with the standard Nilsson parameters BR.86 . In both calculations, the pairing is neglected. The CRMF equations are solved in the basis of an anisotropic three-dimensional harmonic oscillator in Cartesian coordinates with the deformation parameters , and oscillator frequency MeV. All fermionic and bosonic states belonging to the shells up to and are taken into account in the diagonalization of the Dirac equation and the matrix inversion of the Klein-Gordon equations, respectively. The detailed investigation indicates that this truncation scheme provides good numerical accuracy. The NL1 set NL1 is used for the RMF Lagrangian. As follows from our experience A150-sp ; A250 , this set provides reasonable description of the single-particle energies.
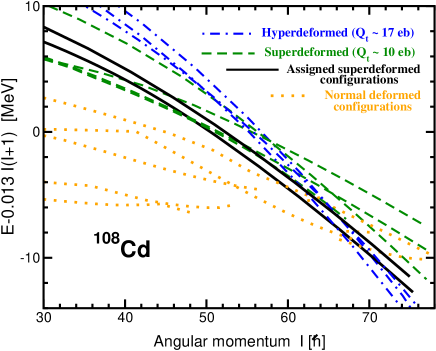
The results of the CRMF calculations for the configurations forming the yrast line or located close to it in energy are shown in Fig. 1. According to these calculations, normal-deformed bands, many of which show high triaxiality indicative of approaching band termination, dominate the yrast line up to . At higher spin hyperdeformed bands become yrast. The SD bands are never yrast, but come close to the yrast line at .
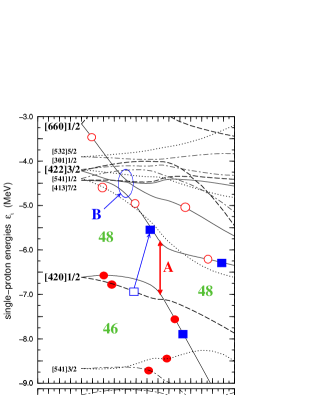
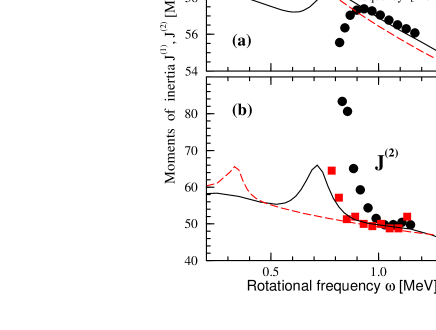
The lowest SD configuration has (even spins) quantum numbers and it is assigned to band 1. We assign bands 1 and 2 to SD configurations, because the calculated kinematic and dynamic moments of inertia agree well with experiment. The configurations with normal deformation have too small and the configurations with hyperdeformation too large values of moments of inertia. The experimental values of transition quadrupole moment are best reproduced by the SD configurations. The proton and neutron single-routhian diagrams along the deformation path of this configuration are shown in Fig. 2. Before unpaired band crossing it has the structure, while after band crossing the structure. The unpaired band crossing is due to the crossing of the and orbitals (arrow A in Fig. 2). The exact band crossing frequencies are not known for bands 1 and 2 because downsloping branches of below the band crossing have not been observed. The comparison of the experimental and calculated bumps in suggests that the crossing takes place keV earlier in the calculations than in experiment (see Fig. 3). The frequency of this band crossing depends on the relative position of the above mentioned orbitals and thus the discrepancy between experiment and theory suggests that the relative energy distance between these orbitals is underestimated in the calculations by approximately 0.7 MeV. The CRMF calculations well reproduce the absolute value of dynamic moment of inertia above the band crossing, but underestimate somewhat the height of the bump in dynamic moment of inertia at the band crossing (Fig. 3b).
The best agreement between calculated and ’experimental’ kinematic moments of inertia is seen if the lowest state in band 1 has spin (Fig. 3a). This suggests that the band in 108Cd has been observed in the spin range from up to . However, taking into account that typical accuracy of the description of the moments of inertia in the CRMF calculations is around 5% A150 ; A60 ; VRAL and possible minor impact of pairing at high rotational frequencies, which would lead to slight decrease of calculated VRAL , one cannot completely exclude that the lowest SD band in 108Cd has been observed from up to . The spin range has been suggested in Ref. Cd108-1 using the assumption that . However, this assumption is not supported by our calculations where for assigned configuration above the band crossing.
The average transition quadrupole moment of the assigned configuration in the suggested spin range is b, which agrees with the lower limit of b obtained in experiment Cd108-1 . The occupation of the first proton orbital at the band crossing has only minor impact on : an increase of by approximately 0.2 b.
Band 2 has the features similar to the band 1 except that the band crossing takes place keV earlier (Fig. 3b). Especially interesting is the observation that the moments of inertia of these two bands are very similar above the band crossing. Similar to the region of superdeformation BRA.88 ; A150 , this suggests that the intruder content of observed bands should be the same. The only possible explanation found in our calculations is related to the excitation of proton from the orbital into the lowest positive parity orbital with signature above the shell gap (see Fig. 2). In Fig. 2 above MeV, this orbital has the structure. However, contrary to the situation shown in Fig. 2 at equilibrium deformation of the configuration of interest the orbitals are located below the orbitals even at zero rotational frequency. At MeV, the and the orbitals interact strongly. This interaction creates the bump in (Fig. 3b). Above the band crossing, the calculated reproduces well the experimental one and is very close to the values of the configuration assigned to the lowest SD band, the feature observed also in experiment.
When interpreting band 2, we also considered particle-hole excitations in neutron subsystem, namely from the orbital to the orbitals (Fig. 2). Such excitations lead to smaller deformation, and thus to the delay of the unpaired band crossing (originating from interaction of the and the orbitals). For example, in the configuration based on the occupied orbital this crossing is delayed by MeV, which is in contradiction with experiment.
Therefore, similar to the configuration assigned to the band 1, the structure of the configuration assigned to the band 2 changes from to at the band crossing. However, it has total signature (odd spins) and negative parity. The band crossing A, active in the configuration of the band 1, is not active in the configuration of band 2 since both interacting orbitals ( and ) are occupied (see Fig. 2). Since the and orbitals interact very weakly (see inside of ellipse B in Fig. 2), their interaction cannot explain the observed features of band 2 in the band crossing region. The comparison of relative alignments of bands 2 and 1 (Fig. 3) suggests that with assigned for initial state of band 1, the band 2 has been observed in the spin range from up to . In the region beyond band crossing ( MeV), the calculated relative alignments differ from the experimental ones only by : this is within the typical uncertainty of the description of relative alignments in the CRMF theory A150-sp ; A60 ; A80 .
The calculations show that the quadrupole deformations of the configurations assigned to the bands 1 and 2 are almost the same, but they differ somewhat in the -deformation. While the configuration of band 1 has , the one of the band 2 has . As a consequence, the configuration of the band 2 is more collective ( b) as compared with the one of band 1. Although the experimental analysis for band 2 yielded a lower value for the transition quadrupole moment b, it suffered from the large errors on the values which did not allow an accurate measurement of the values Cd108-2 . Thus based on the similarity of rotational properties of bands 1 and 2 above the band crossing and the results of the CRMF calculations, it is reasonable to believe that the deformation for band 2 is comparable to the one for band 1 (see also Ref. Cd108-2 ).
The earlier band crossing in the configuration of band 2 as compared with experiment is due to small energy distance between the and orbitals in the calculations. In order to have this crossing at experimentally observed frequency, one should increase this distance by MeV. This value is similar to the underestimate of the energy distance between the and orbitals deduced earlier. This suggests that the energy distance between the and orbitals, and, consequently the SD shell gap is reasonably well reproduced in the calculations. Thus, one concludes that the SD shell gap is smaller than the SD shell gap in the region of superdeformation (see Fig. 1 in Ref. A60 ) and SD shell gap in the rare-earth region of superdeformation (see Fig. 3 in Ref. A150 ). This maybe a possible reason why the search for SD bands in neighbouring nuclei has been unsuccesful so far F.05 .
In addition, it indicates that in reality the orbital is located MeV higher in energy with respect of the and orbitals than suggested by the present calculations. This is not far away from the typical accuracy with which the energies of the single-particle states are reproduced at normal- A250 and superdeformation A150-sp in the RMF calculations with the NL1 set.
Unpaired band crossings at superdeformation were reported earlier, for example, in 146,147Gd H.93 ; A150 and 153Ho Ho153 . The band crossing in the SD band 1 of 153Ho is similar to the ones seen in 108Cd since it involves the interaction of the routhians with .
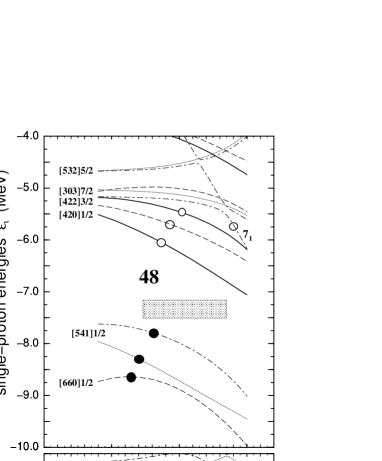
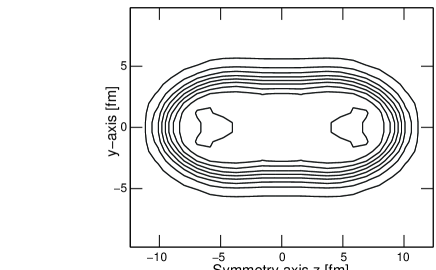
The hyperdeformed configurations become yrast above (Fig. 1). These are the signature partner configurations of negative parity which are degenerated in energy. This energy degeneracy is due to the excitation of one neutron from the orbitals into the lowest orbital (see Fig. 4). The HD configurations are favoured in energy at these spins due to the HD shell gap and low neutron level density at . The transition quadrupole moment increases from b at up to at . This fact is related to the stretching of the nucleus due to centrifugal force. The shape of nucleus corresponds to the 2.3:1 semiaxis ratio (Fig. 5). The kinematic moment of inertia drops down from MeV-1 at to MeV-1 at . In the frequency range where the experimental bands 1 and 2 have been observed, the dynamic moments of inertia of calculated configurations are equal to MeV-1; the quantity which is much larger than in experiment. At higher frequencies there is smooth increase of up to MeV-1 at MeV, possibly caused by unpaired band interaction. No experimental counterparts of these configurations have been observed so far.
It is interesting to mention the similarity of the single-particle spectra at hyperdeformation obtained in the CRMF calculations (Fig. 4) and in the Wood-Saxon-Strutinsky calculations of Ref. C.01 (Fig. 4 and 5 of Ref. C.01 ). However, the ( and ) shell gaps are somewhat smaller (larger) in the CRMF calculations. In the later calculations, the quadrupole, octupole, hexadecapole and necking degrees of freedom were taken into account. There are, however, no indications that octupole deformation should play a role at HD in 108Cd C.01 . On the other side, the CRMF calculations take into account all even-multipole deformations and triaxiality in a fully self-consistent way. The basis of the CRMF model is sufficiently large to see if there is a pronounced tendency for the development of necking. Fig. 5, showing the densities of lowest HD configuration, does not indicate such a tendency.
The CNS calculations, which will not be discussed here in detail, also indicate that the band 1 in 108Cd is associated with the configuration having b and located in the minimum. Similar to earlier calculations (Ref. A60 ), the triaxiality is more pronounced in the CNS calculations for 108Cd as compared with the CRMF ones. In the CNS calculations, the HD configurations are yrast above , and the configurations with b are the lowest ones. Thus, one can conclude that general properties of SD and HD bands are similar in both approaches.
The present CRMF calculations suggest that in the spin range where the feeding of SD bands takes place (i) the SD bands are non-yrast and (ii) the HD bands compete in energy with the SD bands. However, only SD bands have been reported at high spin in Refs. Cd108-1 ; Cd108-2 . Because of limited experimental information it is difficult to find unique explanation for this discrepancy. On one side, one would expect that the calculated relative energies of different minima deviate somewhat from reality. Alternative explanation is related to the differences in feeding mechanism of SD and HD bands Dudek . Although the HD and SD states are comparable in energy at at zero temperature (Fig. 1), these high spin nuclear states are populated at somewhat higher spin at temperatures MeV. At these temperatures, the deformed shell structure melts, and thus SD minimum becomes lower in energy than HD one. As a consequence, the feeding of the SD minimum maybe the dominant population channel Dudek .
In summary, the detailed analysis of the structure of observed superdeformed bands 1 and 2 in 108Cd within the cranked relativistic mean field theory led to new configuration assignment: both bands have been assigned the configurations. The band crossings seen in these bands have been related to the unpaired crossings of the lowest proton orbital and the orbitals. The size of the SD shell gap, which is smaller than that of doubly magic 60Zn and 152Dy SD nuclei, and the absence of large neutron shell gap at indicate that the 108Cd nucleus cannot be considered as a doubly magic SD nucleus. The properties of hyperdeformed configurations, which are expected to be yrast above , have also been discussed.
I Acknowledgements
The work was supported by the DoE grant DE-F05-96ER-40983. The help of Y. Gu in performing CNS calculations and the discussions with I. Ragnarsson are highly appreciated.
References
- (1) P. J. Twin et al, Phys. Rev. Lett. 57, 811 (1986).
- (2) B. Singh, R. Zywina, R. B. Firestone, Nucl. Data Sheets 97, 241 (2002).
- (3) A. V. Afanasjev, J. König and P. Ring, Nucl. Phys. A608, 107 (1996)
- (4) A. Krasznahorkay et al, Phys. Rev. Lett. 80, 2073 (1998).
- (5) R. M. Clark et al, Phys. Rev. Lett. 87, 202502 (2001).
- (6) A. Görgen et al, Phys. Rev. C65, 027302 (2002).
- (7) B. M. Nyako et al, Acta Phys. Pol. B36, 1033 (2005), H. Hübel et al, ibid B36, 1015 (2005), B. Herskind, Phys. Scripta, in press
- (8) T. Werner and J. Dudek, At. Data Nucl. Data Tables 59, 1 (1995).
- (9) R. R. Chasman, Phys. Rev. C64, 024311 (2001).
- (10) C.-T. Lee, Y. Sun, Jing-ye Zhang, M. Guidry, and C.-L. Wu, Phys. Rev. C65, 041301(R) (2002).
- (11) Y. R. Shimizu et al, Rev. Mod. Phys. 61, 131 (1989).
- (12) A. V. Afanasjev, D. B. Fossan, G. J. Lane and I. Ragnarsson, Phys. Rep. 322, 1 (1999).
- (13) A. V. Afanasjev, G. Lalazissis and P. Ring, Nucl. Phys. A634, 395 (1996).
- (14) D. Vretenar, A. V. Afanasjev, G. A. Lalazissis, P. Ring, Phys. Rep. 409, 101 (2005).
- (15) A. V. Afanasjev, I. Ragnarsson and P. Ring, Phys. Rev. C 59, 3166 (1999).
- (16) W. Koepf and P. Ring, Nucl. Phys. A493, 61 (1989).
- (17) T. Bengtsson and I. Ragnarsson, Nucl. Phys. A436, 14 (1985).
- (18) P.-G. Reinhard et al, Z. Phys. A323, 13 (1986).
- (19) A. V. Afanasjev et al, Phys. Rev. C 67, 024309 (2003).
- (20) A. V. Afanasjev and S. Frauendorf, Phys. Rev. C 71, 064318 (2005).
- (21) T. Bengtsson, I. Ragnarsson and S. Åberg, Phys. Lett. B208, 39 (1988).
- (22) P. Fallon, Nucl. Phys. A752, 231c (2005).
- (23) A. V. Afanasjev and P. Ring, Nucl. Phys. A654, 647c (1999).
- (24) B. Haas et al, Nucl. Phys. A561, 251 (1993).
- (25) J. Dudek et al, Eur. Phys. J A20, 15 (2004).