Fusion hindrance and roles of shell effects in superheavy mass region
Abstract
We present the first attempt of systematically investigating the effects of shell correction energy for a dynamical process, which includes fusion, fusion-fission and quasi-fission processes. In the superheavy mass region, for the fusion process, shell correction energy plays a very important role and enhances the fusion probability when the colliding partner has a strong shell structure. By analyzing the trajectory in three-dimensional coordinate space with the Langevin equation, we reveal the mechanism of the enhancement of the fusion probability caused by ‘cold fusion valleys’. The temperature dependence of shell correction energy is considered.
keywords:
superheavy elements, fluctuation-dissipation dynamics, fusion-fission process, quasi-fission process1 Introduction
In a heavy-ion fusion reaction, with increasing atomic numbers of the target and projectile, it becomes more difficult to produce a compound nucleus owing to the strong Coulomb repulsion and strong dissipation forces. In the superheavy mass region, this difficulty is more pronounced. Although the mechanism of the fusion-fission reaction in the heavy-mass region is not clear, generally we recognize the existence of fusion hindrance hana74 ; pete76 ; brun79 .
The dynamical aspects of the fusion-fission mechanism have been investigated as a time evolution of the nuclear shape with friction. In the 1980s, a mean trajectory calculation in the nuclear deformation space using a stochastic equation, known as the extra-push model, was performed by Swiatecki and coworkers swia81 ; bloc86 . In the superheavy-mass region, however, even if substantial extra push energy is supplied, it is very difficult for the mean trajectory to reach the spherical region owing to a strong dissipation. It is necessary to apply fluctuation-dissipation dynamics ari04 .
The simplified calculation that included the one-dimensional diffusion model was applied to cold fusion reactions swit05 . With one adjustable parameter, the results showed a good agreement with many experimental data, not only maximum cross sections, but also the optimum energies and widths of the excitations functions. In the present study, we concentrate to discuss the fusion process using the more realistic model.
Fusion hindrance is mainly caused by the macroscopic properties of the colliding partner ari05I . On the contrary, fusion is enhanced by the deformation and shell structure of the nuclei, which we call fusion enhancement mits00 ; nish00 ; sato02 ; ikez03 . In experiments, especially in the case of a cold fusion reaction, these advantages are used to synthesize superheavy nuclei hofm00 ; mori03 . To understand the fusion mechanism clearly, it is better to treat separately fusion hindrance and fusion enhancement, that is to say, the macroscopic and microscopic aspects, respectively.
In our previous study ari05I , we focused, in particular, on fusion hindrance, in the superheavy mass region. We have presented the origin of the fusion hindrance systematically by conducting a trajectory calculation in three-dimensional coordinate space. To see the fundamental mechanism of the fusion hindrance, we employed the potential energy of the liquid drop model, and analyzed the mean trajectory. From the behavior of the trajectory, we can understand the mechanism that the fusion probability decreases exponentially as the number of the fused system increases. It is concluded that the fusion hindrance in a system with greater than 102 is explained by considering the fragment deformation to be an important factor.
Considering aspects of the fusion enhancement, we focus on the influence of the shell effect. The nuclear structure of the projectile-target combinations is related to the touching probability, but it also influences the dynamics from the touching point to the compound nucleus in the superheavy mass region sato02 ; ikez03 . In our approach ari04 ; ari05 ; ari05I , as parameters related to the microscopic effects, in principle we can introduce the shell correction energy on the potential energy surface and the transport coefficients calculated using the microscopic model ivan97 ; hofm97 ; yama97 . In the former case, we can see ’cold fusion valleys’ in the potential energy surface, which have been suggested in references gra99 ; gra00 . It is said that these valleys lead to the enhancement of the fusion probability. Here, we investigate precisely how the trajectory is affected by shell correction energy, and how the fusion probability is changed.
In fact, shell correction energy depends on the nuclear temperature. In a dynamical process, the nuclear temperature changes owing to the dissipation of the kinetic energy of the relative motion. Therefore, we must discuss the fusion process taking into account the time evolution of the potential energy surface, which is controlled by nuclear friction, since the dissipation depends on the nuclear friction. We clarify the effect of the temperature-dependent shell correction energy in the fusion process.
For clarity, in this paper, we consider the ’dynamical process’ as the whole process from the contact point to the spherical nucleus or re-separated one. It includes the fusion, quasi-fission and deep quasi-fission processes, which are defined in reference ari04 .
In section 2, we briefly explain our framework for the study and the model. We precisely investigate the effects of cold fusion valleys in section 3. In this section, using the potential energy surface of the full shell correction energy, we discuss the mechanism of the enhancement of the fusion probability by cold fusion valleys. In section 4, taking into account the temperature dependence of shell correction energy, we discuss the fusion process. In section 5, we present a summary and further discussion to clarify the reaction mechanism in the superheavy mass region.
2 Model
Using the same procedure as described in reference ari04 to investigate the dynamical process, we use the fluctuation-dissipation model and employ the Langevin equation. We adopt the three-dimensional nuclear deformation space given by two-center parameterization maru72 ; sato78 . The three collective parameters involved in the Langevin equation are as follows: (distance between two potential centers), (deformation of fragments) and (mass asymmetry of the colliding nuclei); , where and denote the mass numbers of the target and the projectile, respectively.
The parameter is defined as , where and denote the half length of the axes of ellipse in the and directions, respectively as expressed in Fig. 1 in reference maru72 . We assume that each fragment has the same deformations as the first approximation. is related to the deformation parameter , which is familiar with us, as
| (1) |
The neck parameter is the ratio of the smoothed potential height to the original one where two harmonic oscillator potentials cross each other. It is defined in the same manner as reference maru72 . With , the surface of two fragments shows the smooth curve at the connecting point of them. On the other hand, in the case of , the two fragments are connected with a sharp point like a top of cone. In the present calculation, is fixed to be 1.0, so as to retain the contact-like configuration more realistically for two-nucleus collision.
The multidimensional Langevin equation is given as
where a summation over repeated indices is assumed. denotes the deformation coordinate specified by , and . is the conjugate momentum of . is the potential energy, and and are the shape-dependent collective inertia parameter and dissipation tensor, respectively. A hydrodynamical inertia tensor is adopted in the Werner-Wheeler approximation for the velocity field, and the wall-and-window one-body dissipation is adopted for the dissipation tensor bloc78 ; nix84 ; feld87 . The normalized random force is assumed to be white noise, i.e., =0 and . The strength of random force is given by , where is the temperature of the compound nucleus calculated from the intrinsic energy of the composite system. The potential energy is defined as
| (3) |
| (4) |
| (5) |
where is the moment of inertia of a rigid body at deformation . and are the potential energy of the finite-range liquid drop model and the shell correction energy taking into account the temperature dependence. is the shell correction energy at . The temperature dependent factor is discussed in the section 4.1. and denote a generalized surface energy krap79 and Coulomb energy, respectively. The centrifugal energy arising from the angular momentum of the rigid body is also considered. The detail is explained in reference ari04 . The intrinsic energy of the composite system is calculated for each trajectory as
| (6) |
where denotes the excitation energy of the compound nucleus. is given by , where and denote the value of the reaction and the incident energy in the center-of-mass frame, respectively. At , each trajectory starts from the contact point which is defined as , where and are the radii of projectile and target, respectively.
As discussed in reference ari04 , we assumed that the kinetic energy of the relative motion does not dissipate during the approaching process. However, to investigate the effect of the energy dissipation during the approaching process, we introduce a parameter which is the intrinsic energy converted from the relative kinetic energy before both nuclei touch. The discussion on this issue is given in section 4.3. At the contact point, the initial velocity is directed only in the direction, and the components of the initial velocities along the and directions are both assumed to be zero ari04 ; ari052 .
3 Effects of shell correction energy in fusion process
In our previous study ari05I , we focused on the fusion hindrance from the macroscopic point of view. We employed the potential energy of the liquid drop model and analyzed the mean trajectory excluding the final term on the right-hand side of Eq. (2) and used in Eq. (5). We presented the origin of the fusion hindrance systematically.
Here, we investigate the fusion enhancement from the microscopic point of view. The nuclear structure of the projectile-target combinations is related to the touching probability, but it also influences the dynamics from the contact point to the compound nucleus sato02 ; ikez03 . We focus on the dynamics taking into account the shell effect after both nuclei touch. Within our model ari04 ; ari05 ; ari05I , we introduce the potential energy surface with the shell correction energy.
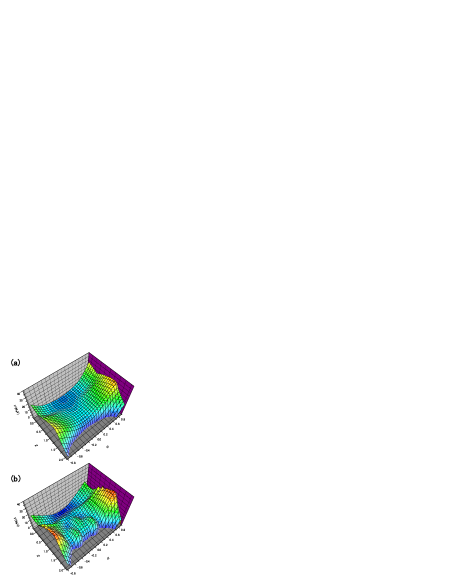
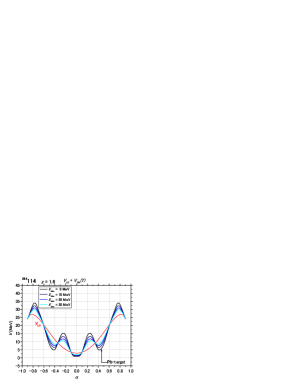
Figure 1 shows the potential energy surface of the liquid drop model and with shell correction energy for in the space , which is calculated using the two-center shell model code suek74 ; iwam76 . When we consider the shell correction energy on the potential energy surface, we can see pronounced valleys, that lead to the compound nucleus. The valleys are called ’cold fusion valleys’ gra99 ; gra00 . It is said that these valleys enhance the fusion probability.
We can see such shell structure in another calculation moll97 . Single particle level diagrams in reaction 70Zn+208Pb were calculated by a macroscopic-microscopic model. It shows that the entrance-channel fragment-shell effects remain far inside the touching point.
In this section, we discuss the effect of shell correction energy on the dynamical process using trajectory calculation.
3.1 Effect of cold fusion valleys on fusion process
As our first attempt, we employ the potential energy of the liquid drop with the full shell correction energy, which corresponds to the potential energy surface at MeV. This potential energy is represented by , or by Eq. (5). We mainly discuss head-on collision, that is to say, the process for , because the general mechanism of the trajectory’s behavior does not change essentially in any of the angular momentum cases, although the potential landscape changes with angular momentum.
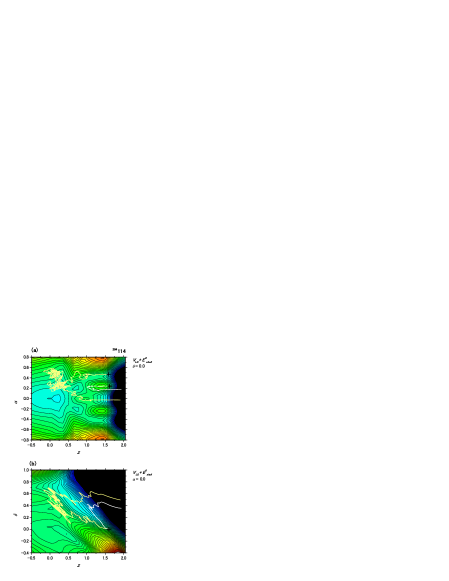
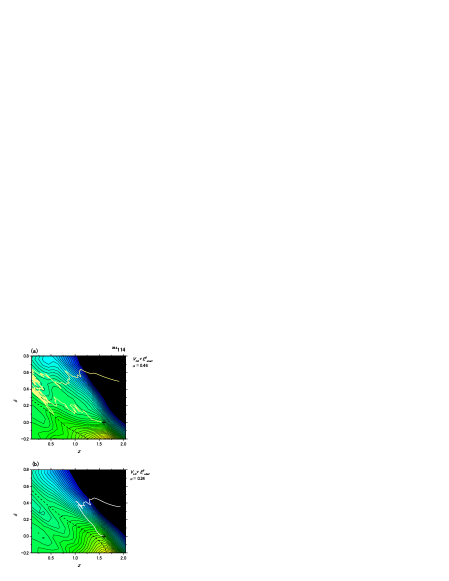
Figure 2 shows the potential energies and for at , which the potential energies correspond to a location near the contact point. The red and blue lines denote and , respectively. The shell correction energy in the reaction system where the target corresponds to Pb is significant, and is indicated in Fig. 2. Actually, a Pb target is chosen in a cold fusion reaction, in order to suppress the excitation energy of a compound nucleus oga75 .
To investigate the effects of the cold fusion valleys, we compare the fusion probabilities at different injection points, where the shell correction energy has very large negative and positive values, such as and in Fig. 2, respectively.
The former corresponds to the reaction 76Ge + 208Pb, which is a cold fusion reaction, and the latter corresponds to 108Ru + 176Yb. Figure 3(a) shows sample trajectories that are projected onto the plane of the potential energy surface for . The contact point is marked by . The light yellow line denotes the trajectory with the starting point at the incident energy corresponding to the excitation energy of the compound nucleus =20 MeV. This trajectory appears to move along the valley till . Then it approaches the region.
On the other hand, the trajectory with the starting point moves till without changing the mass asymmetry parameter , which is denoted by the white line. It seems that the trajectory overcomes the mountain located at and . This trajectory does not move along the bottom of the valley. We can say that this trajectory is not influenced by the valley till . Then it turns in the direction, which corresponds to the fission region.
We project the trajectories of Fig. 3(a) onto the plane at , as shown in Fig. 3(b). The trajectory with can approach the compact shape region, but it is not trapped by the pocket at the ground state. The trajectory with moves rapidly in the direction and enters the fission region. We can say that the former is a deep quasi-fission process (DQF) and the latter is a quasi-fission process (QF) ari04 ; ari05I .
To understand why these two trajectories take different paths, we precisely analyze the trajectory’s behavior with the potential energy surface near the contact point. The potential landscape near the contact point is very important for deciding the destiny of the trajectory ari05 . Figure 4(a) shows the trajectory with , which is projected onto the plane (). The trajectory is the same as that in Fig. 3. The dashed line denotes the ridge line. The contact point is far from the ridge line, but it does not mean the trajectory moves into the fission region immediately. On the potential energy surface near the contact point, although we can see the steep slope in the direction, there are no significant barriers in the direction from the contact point. Therefore, first the trajectory moves in the direction while maintaining . Owning to the shell correction energy, a flat potential region exists around and . This flat region prevents the trajectory from moving in the direction rapidly. Finally, the trajectory can enter the region near .
Figure 4(b) shows the trajectory with , which is projected onto the plane (). The contact point is located near the ridge line, but a substantial barrier exists in the direction from the contact point. To avoid the barrier, the trajectory moves in the direction rapidly.
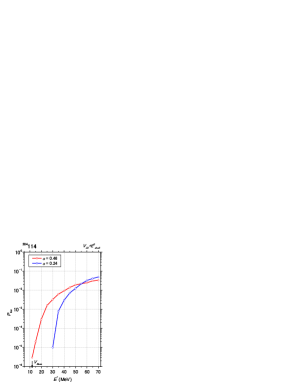
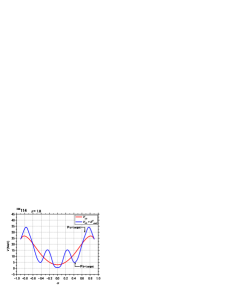
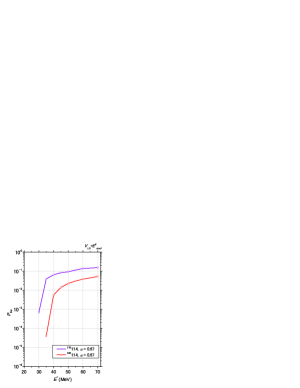
Figure 5 shows the fusion probabilities for and , which are denoted by the red and blue lines, respectively. The potential energy at the contact point for is lower than that for , as shown in Fig. 2. Therefore, at low excitation energy, the former fusion probability is larger than the latter one because in the former case the available kinetic energy at the contact point is larger than that in the latter case. The arrow indicates the Coulomb barrier bass741 . At high excitation energy, the fusion probabilities of these two cases are not markedly different because the kinetic energy at the contact point is rather large in both cases.
3.2 Evolution of cold fusion valleys on dynamical process
Usually, cold fusion valleys are discussed using the potential energy surface on the plane with , as in Fig. 1(b). However, in the dynamical process, the trajectory moves in the large direction. Therefore, we should discuss the cold fusion valleys with the dynamical evolution of the parameter. For the case, we can see that the cold fusion valleys are remarkable. With changing in the dynamical process, the cold fusion valleys also change. While the trajectory moves from to 0.5, changes to 0.2. Figure 6(a) shows the potential energy surface on the plane at with the trajectory. The position and depth of the cold fusion valleys slightly change. After moving along the valley, the trajectory enters the region . In this region, is more than 0.4. Figure 6(b) shows the potential energy at with the trajectory. We can see that the cold fusion valleys have already disappeared.
3.3 Roles of shell effects on fusion process
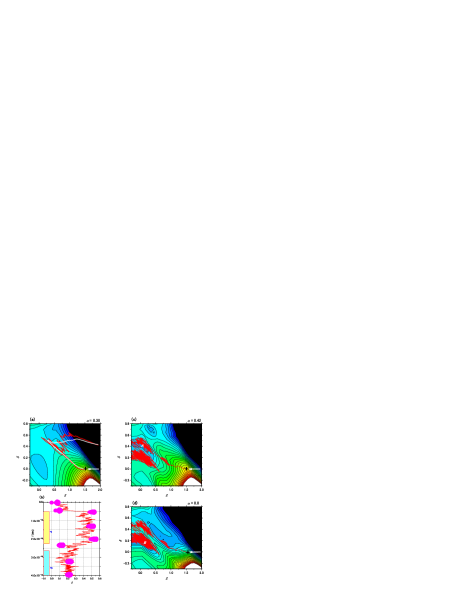
Owing to the shell correction energy, we discuss another important effect to enhance the fusion probability. In the discussion on fusion hindrance ari05I , we indicated that the turning point is very important. Figure 7(a) shows the potential energy surface of for =102 at the turning point on the plane, that is to say, corresponds to the value at the turning point. The mean trajectory is denoted by the white line. The red line denotes the trajectory taking into account the fluctuation. At the turning point , the trajectory moves in the fission direction owing to the potential landscape ari05I .
However, when we take into account the shell correction energy shown in Fig. 7(c), a temporary pocket appears at the turning point (indicated by ), which we call the second pocket ari05 . Figure 7(d) shows the potential energy at . The pocket (indicated by ) corresponds to the ground state. The trajectory is trapped in the second pocket at the turning point, and is blocked from going to the fission area ari05 . While the trajectory remains in pocket , the mass asymmetry is relaxed, and the large pocket appears at . Then, the trajectory moves to pocket . Pocket helps the trajectory enter the region corresponding to the compound nucleus.
Figure 7(b) shows the time evolution of nuclear shape. The horizontal axis denotes . After the contact point, the trajectory moves in the large direction rapidly, then it is trapped in the second pocket . At this moment, the neck of nuclear shape is rather large owing to the large , so that the mass asymmetry is relaxed easily while the trajectory remains in pocket . As approaches zero, the trajectory moves into pocket . It corresponds to the compound nucleus.
3.4 Difference between spherical and deformed compound nuclei
In the previous section, we pointed out the role of the second pocket in the fusion process. However, the second pocket does not always enhance the fusion probability. As regards the position of the second pocket, we discuss the difficulty of synthesizing superheavy elements.
In general, the position at the ground state of the compound nucleus is decided by the shell correction energy. As discussed above, in the reaction 48Ca+ 208Pb, the ground state of the compound nucleus 256No is located at , which is deformed. Therefore, the second pocket is located at a with a more deformed shape , as shown in Fig. 7(c), which simply corresponds to the turning point. In this case, pocket assists the trajectory in entering the region corresponding to the compound nucleus.
However, in the superheavy mass region , the nuclear shape at the ground state is spherical, which has a large shell correction energy. For example, in the reaction 48Ca+ 244Pu , the ground state of the compound nucleus 292114 is located at . In this case, the second pocket is located at , which does not correspond to the turning point . Therefore, many trajectories return in the direction. This is one of the difficulties in making spherical compound nuclei such as 292114.
To show the role of the second pocket, we compare the trajectories forming the compound nuclei (deformed) and (spherical). Figures 8(a) and (b) show sample trajectories, which are projected onto the plane at of , for and , respectively. Both trajectories start at with the incident energy corresponding to the excitation energy of the compound nucleus, =40 MeV. In this case, corresponds to the turning point.
In Fig. 8(a), a small pocket exists at and , which is the second pocket (indicated by ). The trajectory is trapped by pocket and is prevented from moving into the reseparation region. Then, it moves to the main pocket, which is located at around and . The shell correction energy at the ground state is about 5.0 MeV; therefore, the trajectory easily escapes from the main pocket. In Fig. 8(b), which corresponds to the reaction 48Ca+244Pu, the second pocket does not exist at around and because the compound nucleus 292114 is spherical. We can see that it is difficult for the trajectory to enter the spherical region. The trajectory returns to the fission region.
Figure 9 shows the fusion probabilities for forming the compound nuclei and , which are denoted by the blue and red lines, respectively. We use the initial value of for both cases. The fusion probability of is larger than that of , owing to the second pocket, which is located at the deformed shape.
4 Effect of temperature-dependent shell correction energy
In the previous section, we used the full shell correction energy for the potential energy surface. However, the shell correction energy actually depends on the nuclear temperature . For the dynamical calculation for the fusion process, the temperature dependence of shell correction energy has not been considered sufficiently in many publications.
In this section, we discuss the temperature dependence of the shell correction energy and how the fusion process is affected. Considerable effort has been made to investigate the temperature dependence of the level density parameter igna75 ; igna79 and applied to the calculation of the statistical model for the fission process reis92 . The temperature dependence of the potential energy surface has been investigated in references dieb81 ; loje85 . Here, we discuss the effect of this dependence on the fusion process on the basis of dynamical calculations.
4.1 Temperature dependence of shell correction energy
The temperature dependence of shell correction energy can be extracted from the free energy calculated using single particle energies, which is obtained from the two-center shell model code suek74 ; iwam76 . The procedure is given precisely in reference ari98 . The temperature dependence of shell correction energy calculated by this method is represented by .
The ratio of shell correction energies, , in the spherical region for is shown in Fig. 10(a) by the solid line. As discussed in reference ari98 , our result is consistent with the parameterization of the factor ,
| (7) |
following the work by Ignatyuk et al. igna75 , where denotes the level density parameter of the constant value . The shell damping energy is chosen as 20 MeV, which is given by Ignatyuk et al. igna75 . This parameterization is denoted by the open circles in Fig. 10(a), which shows a tendency similar to that of the solid line.
In the fusion process, it is important to determine near the contact point of the colliding partner. The potential landscape near the contact point mainly decides the destiny of the trajectory in the dynamical process. Using the same procedure, we calculate the temperature dependence of shell correction energy at the contact point for the reaction 76Ge+208Pb. In Fig. 10(b), the blue line denotes . This tendency is different from that of the spherical shape case, which is denoted by the dashed line. In Eq. (7), when we take into account the nuclear deformation dependence of the level density parameter toke81 , our result can be fitted using MeV, denoted by the open circles. The result shows the similar tendency of the blue line.

4.2 Trajectory behavior on temperature-dependent potential energy surface
In the fission process, the time evolution of the potential energy surface affects the dynamical process considerably. Owing to the neutron emission from the compound nucleus, the temperature of the nucleus decreases, and the shell correction energy recovers. The time scale of the variation of the potential energy surface affects the dynamics of the fission process ari98 .
Here, we focus on the effect of the temperature-dependent shell correction energy on the fusion process. In the dynamical calculation, we analyze the trajectory on the temperature-dependent potential energy surface, which is concerned with the intrinsic energy of the system.
Within our model, the time evolution of is controlled by the friction tensor . Also, is connected with at the contact point ari052 . Here, we clarify the relationship among these variables and the mechanism of the fusion process.
We start the dynamical calculation from the contact point using the Langevin equation. is treated as a parameter of the initial condition. Discussions on this issue have been given in references ari03a ; ari052 . In fact, is related to the dynamics in the approaching process. Considering as a parameter, we investigate the effect of on the trajectory in the process after the both nuclei touch. Then, in the next section, we discuss the effect of the friction tensor .
Before we discuss the effect of the different ’s on the dynamical process, we analyze the trajectory under the influence of the temperature-dependent shell correction energy, using the same initial condition as MeV in the previous calculation. We employ the potential energy surface and in the reaction 76Ge+208Pb.
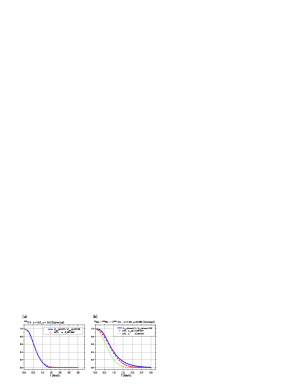
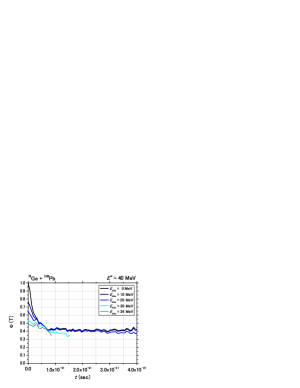
When we use as the potential energy surface, as the intrinsic energy that is transformed from kinetic energy increases, some part of the shell correction energy disappears. Figure 11 shows the time evolution of for a trajectory at MeV. At the contact point, where in the calculation, owing to the assumption MeV, which corresponds to MeV, the full shell correction energy is indicated. Then, till sec, more than 50% of the shell correction energy disappears owing to the strong friction tensor. During this extremely short reaction time, the kinetic energy dissipates into the intrinsic energy, which has been discussed in reference ari05 .
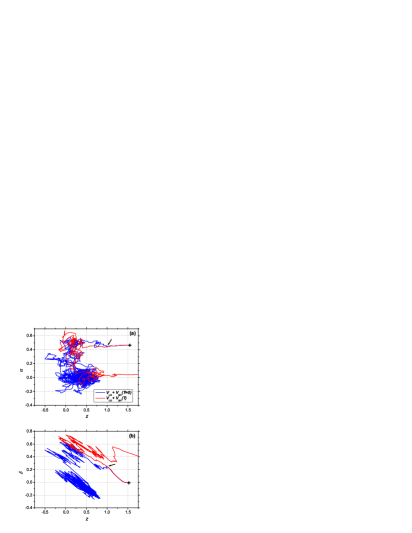
As consequence, such variation of the potential energy surface gives the influence on the trajectory’s behavior. Figure 12 shows sample trajectories on and , which are denoted by the blue and red lines. The trajectories are projected onto the plane and plane, which are shown in (a) and (b), respectively. The (+) denotes the point of contact in the system. Both trajectories in Fig. 12 are calculated using the same random numbers. After sec, which is indicated by the black arrow, trajectories separate along different paths owing to the different potential energy surfaces. The trajectory with takes the fusion process. On the other hand, the trajectory with takes the deep quasi-fission process. This is brought about by the disappearance of the second pocket at around and .
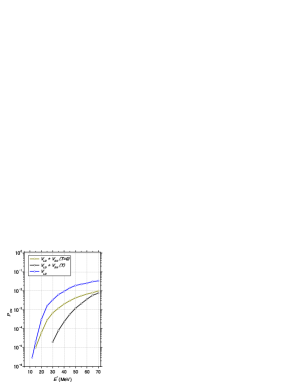
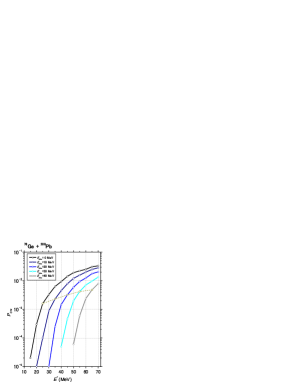
Figure 13 shows the fusion probabilities in the reaction 76Ge+208Pb for each potential energy with MeV. The blue and red lines denote with and , respectively. with is represented by the black line. With increasing incident energy, with approaches that with owing to the disappearance of shell correction energy at high temperature.
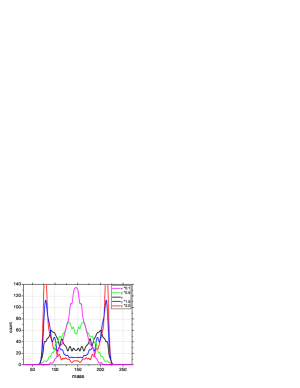
The mass distributions of fission fragments in the reaction 76Ge+208Pb at MeV are shown in Fig. 14. The blue and red lines denote the cases of and with MeV, respectively. In the latter case, some part of the shell correction energy disappears and the number of mass symmetric fission events increases in comparison with that in the case.
4.3 dependence on dynamical process
Next, we focus on the dependence on . As discussed in references ari052 ; ari03a , the fusion probability and mass distribution of fission fragments are affected by . When we use the condition MeV (or ), we assume that the velocity of the trajectory is in the direction at the contact point, so that there exists trajectories that enter the fusion region. However, when we take the condition in which all the kinetic energy has already dissipated at the contact point, which is represented by , all trajectories move down along the steep slope in the fission direction (the direction) immediately. As a result, the fusion probability is equal to zero. We discuss this point in connection with the potential energy surface near the contact point in section 4.5.
First, we investigate the evolution of related to . When the kinetic energy dissipates during the approaching process, some part of the shell correction energy has already disappeared at the contact point. Figure 15 shows the time evolution of for a trajectory at MeV with various . At sec, strongly depends on . In this case, the potential energy surface at the contact point for each is shown in Fig. 16. Owing to the strong friction, of the shell correction energy is rapidly lost by sec. After this time, the trajectory of each moves on almost the same potential energy surface.
In Fig. 15, the gray line denotes for , which corresponds to MeV in this case. In fact, in the surface friction model, it shows that all the kinetic energy dissipates during the approaching process gros78 ; froe83 . Under this condition, the gray line shows that 50% of the shell correction energy has already disappeared at the contact point. The trajectory moves down the steep slope rapidly and arrives at the fission region at sec. The mass distribution of the fission fragments in this reaction is denoted by the gray shadow in Fig. 14. As discussed in reference ari03a , it shows the two sharp peaks corresponding to target-like and projectile-like fragments.
The fusion probabilities for the various cases are shown in Fig. 17. We can roughly say that the fusion probability of each shifts by as much as MeV from the black line in the MeV case. For example, in Fig. 17, we connect the points that have the same value of at the contact point using the red dashed line. On this dashed line, the fusion probability with the large increases owing to the thermal fluctuation of the collective motion. However, we can see the systematic tendency and the relationship between the fusion probability and . Even though we treat as a parameter in our model, the mechanism of the dynamical process after the contact point is clarified.
4.4 Friction tensor dependence on dynamical process
In the dynamical process, the dissipation speed is controlled by the friction tensor . That is to say, the time evolution of depends on . The ambiguity of the friction tensor derived from the macroscopic model has been discussed very often wada92 ; hils93 ; karp01 . Moreover, as for the effect of nuclear structure, we should consider the microscopic transport coefficients, that are calculated by the linear response theory ivan97 ; hofm97 ; yama97 . The friction tensor that calculated by the microscopic model depends on the temperature and is smaller than that calculated by the macroscopic model at low temperature. Here, using the modified strength of the one-body friction tensor, we investigate the effect of the friction tensor on the dynamical process, in terms of the variational speed of the potential energy surface.
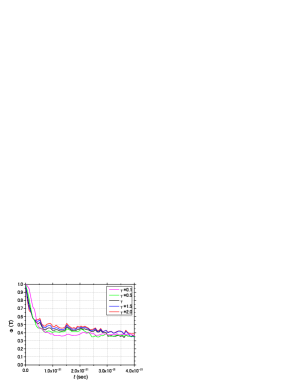
Figure 18 shows the time evolution of for the different friction tensors in the reaction 76Ge+208Pb at MeV with MeV. The factors multiplied with the friction tensor are 0.1, 0.5, 1.0, 1.5 and 2.0, and the corresponding results are shown. Except in the case of the multiplied factor 0.1, more than 40% of the shell correction energy disappears till sec for all cases. This time is rather short in comparison with the reaction time in the whole dynamical process. After sec, in the smaller friction case, decreases faster than in the larger friction case. In the smaller friction case, after the trajectory overcomes the fusion barrier rapidly, the trajectory enters the region where the potential energy is lower than that near the contact point. It is possible that the variation in the potential energy is transformed into the intrinsic energy by Eq. (6). In this way, after the trajectory overcomes the fusion barrier at high speed, the intrinsic energy increases and the shell correction energy disappears rapidly. The intrinsic energy increases, not only owing to the dissipation from kinetic energy, but also owing to the transformation of the variation from the potential energy.
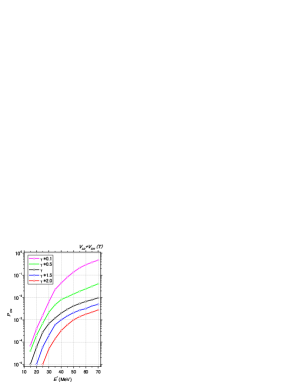
Figure 19 shows the fusion probabilities for each friction tensor for the reaction 76Ge+208Pb with MeV. increases with decreasing magnitude of the friction tensor. The friction tensor affects the dynamical process considerably ari052 .
We investigate the mass distribution of fission fragments for each friction tensor for the reaction 76Ge+208Pb at MeV with MeV, which is shown in Fig. 20. In the small friction case, mass symmetric fission events are dominant, because the trajectory can reach the small region. On the other hand, mass asymmetric fission events are dominant in the large friction case. The smallest value of that the trajectory can reach is related to the mass distribution of fission fragments ari05 .
4.5 Effect of modified potential energy surface
As we mentioned in section 4.3, when all the kinetic energy dissipates during the approaching process , all trajectories move down the steep slope in the fission direction and the mass distribution of fission fragments has two sharp peaks, as shown in Fig. 14. In connection with this problem, we should precisely investigate the landscape of the potential energy surface near the contact point. The modification of the potential energy near the contact point is performed continuously zag05 .
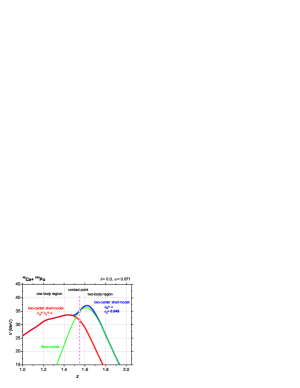
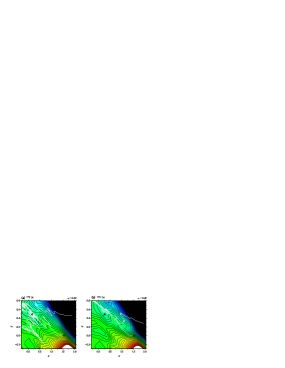
As a problem in our two-center shell model, since we employ the mass asymmetry parameter , the charge distribution of the nuclei follows . In the fusion process, this is not the proper assumption before the contact point, which we call the two-body region. At least, in the two-body region, we should calculate the potential energy using realistic distributions for the proton charge and mass of the projectile and target. By performing the analysis in this manner in the two-body region, we obtain the modified potential energy surface by employing the proper smoothing between the two-body region and the one-body region at the contact point, which is denoted by the blue line in Fig. 21. It shows the 48Ca+244Pu reaction case, where both colliding nuclei are assumed to have a spherical shape. The red line denotes the potential energy using the same distributions of for the charge and mass of both nuclei, even in the two-body region, that were used in the previous calculation. The open circles denote the contact point of the colliding partner. The Coulomb barrier of the modified potential energy agrees with that calculated using the Bass model, which is denoted by the green line bass741 .
Using the modified potential energy surface, which is represented by , we calculate the fusion probability and mass distribution of fission fragments using the same procedure as in the previous section. We start the Langevin calculation at the contact point. We also take into account the temperature dependence of shell correction energy.
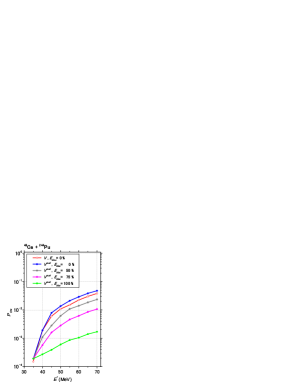
In the case of MeV, the fusion probability with the modified potential does not change considerably compared with the previous results. Since the velocity of the trajectory is in the direction, it is easy to enter the small region, and it is not affected by the potential energy surface in the two-body region. In the case of MeV, Fig. 22 shows using the previous potential and the modified potential, which are denoted by the red and blue lines, respectively.
On the other hand, when all the kinetic energy dissipates during the approaching process, even though the fusion probability with the previous potential is zero for any incident energy, it markedly increases in the case of the modified potential , which is denoted by the green line in Fig. 22. In the case, the Coulomb barrier located at prevents the trajectory from moving into the fission region immediately, and the trajectory at the contact point moves down along the potential slope in the direction automatically. In this case, the trajectory has the momentum to go to the fusion region. In Fig. 22, we also show in the and 75 % cases with . decreases with increasing .
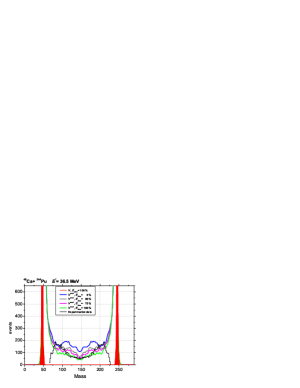
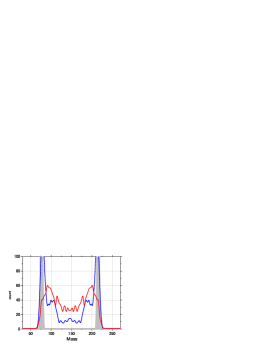
Figure 23 shows the mass distribution of fission fragments with the modified potential energy surface, in the reaction 48Ca+244Pu at MeV. When all the kinetic energy dissipates during the approaching process, the results with the previous and modified potential energy surfaces are denoted by the red shadow and green lines, respectively. Whereas the result with the previous potential shows two sharp peaks, that with the modified potential is distributed around the wide mass region. The tendency of the latter shows a rather good agreement with the experimental data, which correspond to fusion-fission and quasi-fission events, as denoted by the black line itki01 . Here, the experimental data are normalized to agree with the results in the case with at the mass symmetric point. Also, we plot the results of different cases in Fig. 23.
Even though this result is a preliminary one, it shows the importance of the potential energy surface near the contact point and . We should investigate more precisely the effect of the approaching process with the modified potential energy.
5 Summary
The dynamical process in the superheavy mass region was studied systematically by trajectory calculation in three-dimensional coordinate space. To understand the fusion mechanism clearly, we treated the dynamical process as a fusion hindrance and as a fusion enhancement, separately.
On the basis of our previous results ari05I , we discussed the fusion enhancement. We introduced shell correction energy on the potential energy surface, and investigated how trajectory is affected by shell correction energy.
The fusion probability increases along the cold fusion valleys at low incident energy. This is caused by the potential energy surface near the contact point on the plane. With shell correction energy, the second pocket appears at the location with a deformed shape. When the position of the second pocket corresponds to the turning point, it enhances the fusion probability.
The temperature dependence of shell correction energy was also discussed. In the dynamical process, the evolution of is related to and the friction tensor . We analyzed the trajectory on the temperature-dependent potential energy surface, and clarified the effects of and . The fusion probability and mass distribution of fission fragments were calculated.
This study is the first systematic attempt to investigate the role of shell correction energy in the dynamical process. Shell correction energy plays a very important role in the fusion process and enhances the fusion probability, when the colliding partner has a strong shell structure. Although we treated as a parameter, after the both nuclei touch, the mechanism of the dynamical process and the relationship among the parameters are clarified.
As a topic of further study, the potential energy surface should be improved near the contact point and we should investigate the dynamical process more accurately zag05 . We should take into account the dynamics in the approaching process and clarify how the kinetic energy dissipates in the approaching process. Also, we should directly apply the transport coefficients calculated using the microscopic model, for example, linear response theory ivan97 ; hofm97 ; yama97 .
The author is grateful to Professor M. Ohta, Professor Yu. Ts. Oganessian, Professor M.G. Itkis, Professor V.I. Zagrebaev, Professor F. Hanappe, Dr. A.K. Nasirov and Dr. F.A. Ivanyuk for their helpful suggestions and valuable discussion throughout the present work. The special thanks are devoted to Professor T. Wada who developed the original calculation code for the three-dimensional Langevin equation. The author thanks Dr. S. Yamaji and his collaborators, who developed the calculation code for potential energy with two-center parameterization.
This work has been in part supported by INTAS projects 03-01-6417.
References
- (1) F. Hanappe, M. Lefort, C. Ngo, J. Peter, and B. Tmain, Phys. Rev. Lett. 32 (1974) 738.
- (2) J. Peter, C. Ngo, F. Plasil, B. Tamain, B. Berlanger, and F. Hanappe, Nucl. Phys. A 279 (1977) 110.
- (3) C. Lebrun, F. Hanappe, J. Lecolley, F. Lefebvres, C. Ngo, J. Peter, and B. Tamain, Nucl. Phys. A 321 (1979) 207.
- (4) W.J. Swiatecki, Physica Scripa, 24 (1981) 113; Nucl. Phys. A 376 (1982) 275.
- (5) J.P. Blocki, H. Feldmeier and W.J. Swiatecki, Nucl. Phys. A 459 (1986) 145.
- (6) Y. Aritomo and M. Ohta, Nucl. Phys. A 744 (2004) 3.
- (7) Swiatecki W J, Siwek-Wilczyska K and Wilczyski J 2005 Phys. Rev. C 71 014602.
- (8) Y. Aritomo and M. Ohta, Nucl. Phys. A 764 (2006) 149-159.
- (9) S. Mitsuoka, H. Ikezoe, K. Nishio, and J. Lu, Phys. Rev. C 62 (2000) 054603.
- (10) K. Nishio, H. Ikezoe, S. Mitsuoka, and J. Lu, Phys. Rev. C 62 (2000) 014602, 63 (2001) 044610.
- (11) K. Satou, H. Ikezoe, S. Mitsuoka, K. Nishio, and S.C. Jeong, Phys. Rev. C 65 (2002) 054602.
- (12) H. Ikezoe, K. Satou, S. Mitsuoka, K. Nishio, and S.C. Jeong, Phys. Atom. Nucl. 66 (2003) 1053.
- (13) S. Hofmann and G. Munzenberg, Rev. Mod. Phys. 72 (2000) 733; S. Hofmann et al., Eur. Phys. J. A 14 (2002) 147.
- (14) K. Morita et al., Nucl. Phys. A 734 (2004) 101; K. Morita et al., Journal of the Physical Society of Japan, 73 (2004) 2593.
- (15) Y. Aritomo and M. Ohta, Nucl. Phys. A 753 (2005) 152; nucl-th/0502042.
- (16) F.A. Ivanyuk, H. Hofmann, V.V. Pashkevich, S. Yamaji, Phys. Rev. C 55 (1997), 1730.
- (17) H. Hofmann, Phys. Rev. 284 (1997), 137.
- (18) S. Yamaji, F.A. Ivanyuk, H. Hofmann, Nucl. Phys. A 612 (1997), 1.
- (19) R.K. Gupta and W. Greiner, Heavy Elements and Related New Phenomena edited by W. Greiner and P.K. Gupta (World Scientific 1999) p. 397.
- (20) W. Greiner, Proc. of Fusion Dynamics at the Extremes, Dubna, 2000 (World Scientific, Singapore, 2001) p.1.
- (21) J. Maruhn and W. Greiner, Z. Phys. 251 (1972) 431.
- (22) K. Sato, A. Iwamoto, K. Harada, S. Yamaji, and S. Yoshida, Z. Phys. A 288 (1978) 383.
- (23) J. Blocki, Y. Boneh, J.R. Nix, J. Randrup, M. Robel, A.J. Sierk and W.J. Swiatecki, Ann. Phys. 113 (1978) 330.
- (24) J.R. Nix and A.J. Sierk, Nucl. Phys. A 428 (1984) 161c.
- (25) H. Feldmeier, Rep. Prog. Phys. 50 (1987) 915.
- (26) H.J. Krappe, J.R. Nix, and A.J. Sierk, Phys. Rev. C 20 (1979) 992.
- (27) Y. Aritomo, M. Ohta, T. Materna, F. Hanappe, O. Dorvaux and L. Stuttge, Nucl. Phys. A 759 (2005) 309.
- (28) S. Suekane, A. Iwamoto, S. Yamaji and K. Harada, JAERI-memo, (1974) 5918.
- (29) A. Iwamoto, S. Yamaji, S. Suekane and K. Harada, Prog. Theor. Phys. 55 (1976) 115.
- (30) P. Moller, J.R. Nix, P. Armbruster, S. Hofmann, G. Munzenberg, Z. Phys. A 359 (1997) 251.
- (31) Yu.Ts. Oganessian et al., Nucl. Phys. A 239, (1975) 353.
- (32) R. Bass, Nucl. Phys. A 231 (1974) 45.
- (33) A.N. Ignatyuk, G.N. Smirenkin, A.S. Tishin, Sov. J. Nucl. Phys. bf 21 (1975) 255.
- (34) A.N. Ignatyuk, K.K. Istekov, G.N. Smirenkin, Sov. J. Nucl. Phys. 30 (1979) 626.
- (35) W. Reisdorf and M. Schodel, Z. Phys. A 343 (1992) 47.
- (36) M. Diebel, K. Albrecht, R.W. Hasse, Nucl. Phys. A 355 (1981) 66.
- (37) Z. Lojewski, V.V. Pashkevich, S. Cwiok, Nucl. Phys. A 436 (1985) 499.
- (38) Y. Aritomo, T. Wada, M. Ohta, and Y. Abe, Phys. Rev. C 59 (1999) 796.
- (39) J. Toke and W.J. Swiatecki, Nucl. Phys. A 372 (1981) 141.
- (40) Y. Aritomo and M. Ohta, Yderna Fiz. 66 (2003) 1141.
- (41) D.H.E. Gross and H. Kalinowski, Phys. Rept. 45 (1978) 175.
- (42) P. Froebrich et. al, Nucl. Phys. A 406 (1983) 557.
- (43) T. Wada, N. Carjan and Y. Abe, Nucl. Phys. A 538 (1992) 283c.
- (44) D. Hilscher and H. Rossner, Proceedings of the International School-Seminar on Heavy Ion Physcis (1993), Dubna, Russia, p230.
- (45) A.V. Karpov, P.N. Nadtochy, D.V. Vanin, and G.D. Adeev, Phys. Rev. C 63 (2001) 054610.
- (46) V.I. Zagrebaev, A.V. Karpov, M.A. Naumenko and W. Greiner, private communication.
- (47) M.G. Itkis et al., Proceeding of Fusion Dynamics at the Extremes (World Scientific, Singapore, 2001) p93.