Half-lives of -emitters approaching the N=Z line
Abstract
The half-lives of newly observed -emitters 105Te and 109Xe [Seweryniak et al., Phys. Rev. C 73, 061301(R) (2006); Liddick et al., Phys. Rev. Lett. 97, 082501 (2006)] are investigated by the density-dependent cluster model. The half-lives of -emitters close to the N=Z line are also studied in a unified framework where the influence of the nuclear deformation is properly taken into account. Good agreement between model and data is obtained and some possible -emitters are suggested for future experiments.
pacs:
23.60.+e, 21.10.Tg, 21.60.GxOne of the important subjects in nuclear physics is the exploration of the stability of nuclei against spontaneous radioactivity. Experiments have shown that a large number of nuclei are unstable to emission, which is a primary decay mode for medium and heavy nuclei in the mass table aud . Since the discovery of radioactivity, the mass region dominated by -decay has been continuously broadened owing to the rapid development of experimental techniques. Theoretically, a very interesting question concerned arises: Which are the lightest and heaviest -emitters? In fact, the available heaviest -emitters synthesized by cold and hot fusion reaction methods have been studied extensively hof ; oga . The theoretical results of many different -decay models were in good agreement with the experimental data buc ; roy ; del ; del2 ; den ; gam ; moh ; dua ; cho ; xu1 . Useful predictions on even heavier -emitters were also given in a number of theoretical works. Significant progress has been made toward the synthesis of the heaviest -emitter from both the experimental and theoretical sides. In contrast, -emitters at the opposite end of the mass table have received little attention aud . Usually the light mass -emitters are very close to the N=Z line, which can provide unique information of nuclear structure as compared with the neutron-rich ones. Thus it is also important to investigate the decay properties of the light mass -emitters and to make reliable theoretical predictions. Reaching limit of the lightest -emitter is, at the same time, a very interesting objective for future experiments. Recently, the -decay of 105Te with a decay energy of Qα = 4900(50) keV and a half-life of T1/2 = 0.70(0.17 + 0.25) was reported by Seweryniak et al. sew ; lid . This newly found -emitter is the lightest one observed experimentally so far. It belongs to a special class of -emitters occurring in the mass region A=105114 with N/Z ratio 1.0 aud .
In this Brief Report, we systematically investigate the -decay of 105Te and other light mass -emitters (106Te114Ba) in the framework of the density-dependent cluster model (DDCM). The density-dependent cluster model is based on the microscopic double-folding potential with the M3Y nucleon-nucleon interaction, which correctly includes the low-density behavior of the nucleon-nucleon interaction and guarantees the antisymmetrization of identical particles in the -cluster and in the core sat ; ber . In DDCM the ground-state of the parent nucleus is assumed to be an -particle interacting with a deformed core that has an axially symmetric deformation. The influence of the core deformation on the double-folding potential is properly taken into account by the multipole expansion method. The depth of the nuclear potential is determined separately for each decay to generate a quasibound state. The penetration probability of the -particle through the deformed Coulomb barrier is obtained by a careful averaging procedure along different orientation angles ste . The only free parameter in DDCM is the preformation factor which is chosen to fit the experimental half-lives. The value of the preformation factor in DDCM is consistent with both the experimental facts and the microscopic calculations. The details of DDCM can be found in Ref.xu2 .
The -decay of the isotopic chains of Te, I, Xe, Cs, and Ba forms a special light mass region around 100Sn and we call it as ‘light island’ of -decay for convenience. The maximum mass number of the observed -emitters in the ‘light island’ is A=114 (Ba) maz , whereas the minimum mass number of the -emitters outside the ‘light island’ is A=144 (Nd) aud . We know that the -emitters heavier than Ba are all very neutron-rich. This differs from the -emitters in the ‘light island’ which approximately consist of equal numbers of protons and neutrons.
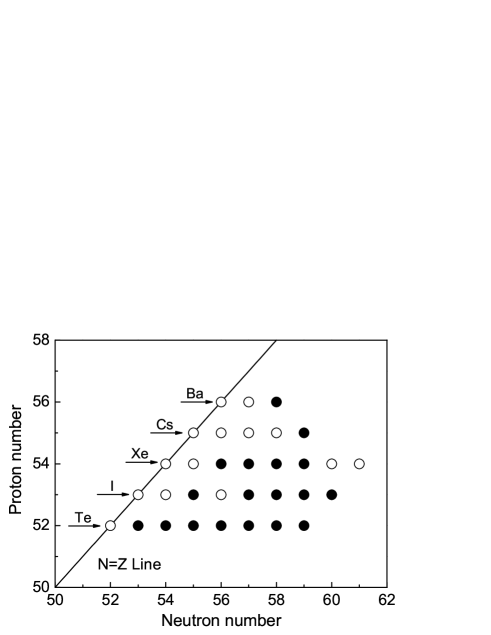
In Fig.1, we plot the ‘light island’ of Te, I, Xe, Cs, and Ba isotopes. The X and Y axes are the neutron and proton numbers, respectively. The black circles denote the -emitters with experimental data and the white circles denote the possible -emitters which have not been observed in experiment yet. It is seen from Fig.1 that the presently found -emitter 105Te is the one closest to the N=Z line. It consists of a combination of 52 protons and 53 neutrons. Experimentally it is also possible to observe the first -emitter with equal proton and neutron numbers.
We perform a systematic calculation on the -emitters in the ‘light island’ by the deformed version of the density-dependent cluster model xu1 . The detailed numerical results are given in Table I. In Table I, the parent and daughter nuclei are listed in the first column. The -decay energy is listed in the second column. The deformation parameters in column 3 and column 4 are taken from Möller et al. mo1 . The experimental -decay branching ratio is given in column 5 web . The experimental partial half-lives and two sets of calculated results are listed in the last three columns, respectively.
Besides the available -emitters, we also give in Table I the suitable candidates of -emitters in the light mass region for future experiments (see also Fig.1). To make reliable predictions on the half-lives of these possible -emitters, the -decay energies used in calculations should be chosen very carefully. Through a detailed analysis on the experimental data, it is found that there exists a linear relationship for the experimental -decay energies of a certain kind of Te, I and Xe isotopes. For instance, Fig.2 plots the experimental -decay energies of 106Te, 108Te and 110Te against the mass numbers (A).
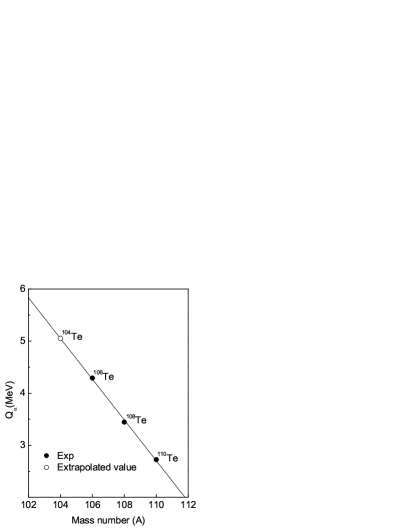
It is clearly seen from Fig.2 that the three experimental points (black circles) of 106Te, 108Te and 110Te are in a perfect line. It is expected that the -decay energy of 104Te (white circle) also lies on this line and the extrapolated -decay energy for 104Te, as well as for other predicted -emitters should have good reliability. For the decay chains of Cs and Ba, the theoretical -decay energies from the finite-range droplet model (FRDM) are used in calculations because only a single -emitter in each chain is observed in experiment mo2 . We note that the predicted -decay energies of Cs and Ba isotopes from FRDM are very accurate as compared to the experimental ones mo2 . For example, the theoretical decay energy of 114Ba from FRDM is 3.550 MeV, which is very close to the experimental value (Qα=3.540 MeV) maz .
The quadrupole and hexadecapole deformations are generally not large for the -decay chains of Te, I, Xe, Cs, and Ba (see Table I). We properly take into account the influence of nuclear deformation on the partial half-lives in our calculations. From Table I, it is seen that the magnitude of the nuclear deformation increases with the increasing neutron number for each isotopic chain. The largest deformation occurs for the -emitter 114Ba, which has a quadrupole deformation of =0.169 and a hexadecapole deformation of =0.052. Similarly, the experimental -decay branching ratios in Table I also reveal a close dependence on the neutron number (N). Usually the emission is a dominating decay mode on the proton-rich side of each isotopic chain, i.e. %100%. On the neutron-rich side, the -decay mode of the nuclei competes with the -decay process and the value of the -decay branching ratio is much smaller (%100%). Moreover, the proton radioactivity also can become a very important decay mode for several nuclei, such as 109I, 112Cs and 113Cs, but the observation of emission of the three nuclei is still feasible.
In Table I, we can see that the experimental partial -decay half-lives range from 7.0 to 2.0 seconds. This is a very large variation for the -decay lifetime. However, the first set of calculated partial half-lives by the deformed version of DDCM is in good agreement with the available experimental data. For example, the theoretical half-life of 105Te is =0.54 s, which agrees well with the experimental one (Tα(Exp)=0.70 s) sew . The experimental half-lives of many -emitters in Table I are reproduced within a factor of 3 by DDCM. Experimental and theoretical values for 114Ba deviate by a factor of 5, which is the largest among all -emitters. One possible reason of this abnormal deviation is that the theoretical deformation parameters from FRDM are relatively too small for 114Ba mo1 . When larger values of the quadrupole and hexadecapole deformations are used in calculations, the agreement between model and data can be greatly improved for 114Ba maz .
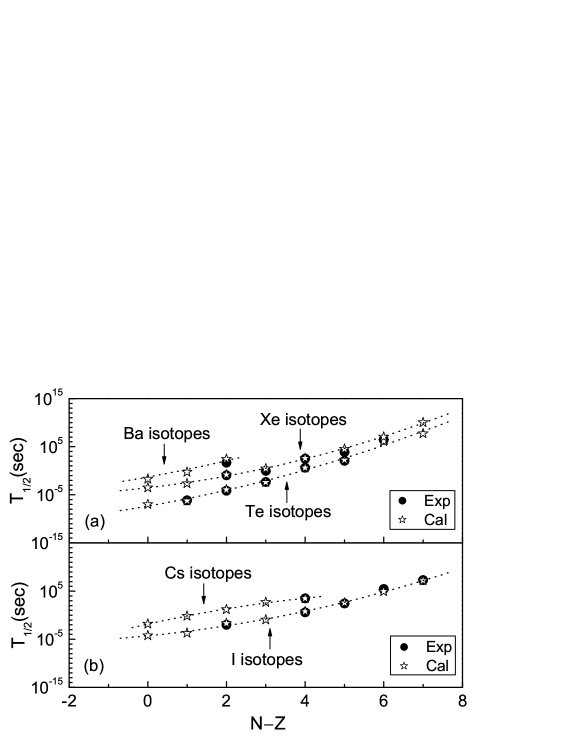
In Fig.3, we give a direct comparison of the experimental and theoretical -decay half-lives of these nuclei ( and ). The even-Z isotopes of Te, Xe, and Ba are plotted in the upper part, and the odd-Z isotopes of I and Cs in the lower part of Fig.3. It is seen from Fig.3 that the experimental points follow the theoretical curve very well. This shows that DDCM has good accuracy in the light mass region. The predicted -emitters are also given in Fig.3. We consider that these predicted -emitters are within the range of current experimental capabilities. Other predicted -emitters have either an extremely short lifetime or a very weak -decay branching ratio, which are not included in our calculations. Because of the success of DDCM for the available experimental data, the present exploration to unknown mass region is necessary and useful for experiments.
Although the first set of calculated results () is very close to the experimental data, the overall agreement can be further improved by taking into account the degree of -clusterization in DDCM. Delion and co-workers systematically analyzed the -clustering effect in heavy and superheavy nuclei del ; del2 and they pointed out the suppression of -clusterization process with increasing proton-neutron asymmetry along the isotopic chains del2 . To improve the agreement between experiment and theory, we therefore use the isospin-dependent preformation factor Pα=c1+c2(NZ) instead of the constant one xu2 for each kind of nuclei [e.g., a linear dependence P=0.730.09(NZ) for the even-even nuclei]. As expected, the corresponding theoretical lifetimes () show a significantly better agreement with the experimental data. The root-mean-square deviation reduces from 0.319 to 0.242 for the available -emitters. Thus the experimental data are reproduced very well by including the nuclear structure effect of -clusterization in DDCM.
In summary, we carried out a systematic study of the -decay half-lives of Te, I, Xe, Cs, and Ba isotopes by the deformed version of the density-dependent cluster model. This is a test on the reliability of DDCM for the very light mass region just above 100Sn. For the newly observed -emitters 105Te and 109Xe, the calculated partial half-lives are in good agreement with the experimental data. For other light mass -emitters (106Te114Ba), the experimental half-lives are also reproduced very well. In addition, we also give the theoretical half-lives of some possible -emitters for future experiments which includes five predicted -emitters consisting of equal numbers of protons and neutrons. It is very interesting to compare the present theoretical predictions with the experimental observations in future.
Notes added: After the submission of this article, we noticed that one of our predicted -emitters 109Xe was reported by Liddick et al. lid , and we added the new results of the favored -transition () of 109Xe in the revised version (see Table I). For the -transition to the ground-state of 105Te (), DDCM also yields a theoretical partial lifetime (Q=4.217MeV, =17ms) in good agreement with the experiment one (=21ms).
This work is supported by National Natural Science Foundation of China (No.10125521, No.10535010) and by 973 National Major State Basic Research and Development of China (No.G2000077400).
| Nuclei | |||||||
|---|---|---|---|---|---|---|---|
| 104Te100Sn+ | 5.053∗ | 0.009 | -0.015 | 9.8 | 5.1 | ||
| 105Te101Sn+ | 4.900 | 0.027 | 0.024 | 100% | 7.0 | 5.4 | 7.6 |
| 106Te102Sn+ | 4.290 | 0.009 | -0.015 | 100% | 7.0 | 1.1 | 7.6 |
| 107Te103Sn+ | 4.008 | 0.018 | -0.015 | 70% | 4.4 | 3.8 | 3.6 |
| 108Te104Sn+ | 3.445 | 0.018 | 0.016 | 49% | 4.3 | 3.9 | 4.0 |
| 109Te105Sn+ | 3.230 | 0.026 | 0.009 | 4% | 1.2 | 1.7 | 1.2 |
| 110Te106Sn+ | 2.723 | 0.027 | 0.016 | 0.00067% | 2.8 | 1.3 | 2.6 |
| 111Te107Sn+ | 2.576 | 0.045 | 0.001 | 100% | 5.2 | 3.0 | |
| 106I102Sb+ | 4.579∗ | 0.054 | 0.034 | 6.1 | 3.1 | ||
| 107I103Sb+ | 4.400∗ | 0.054 | 0.034 | 1.9 | 2.7 | ||
| 108I104Sb+ | 4.034 | 0.081 | 0.051 | 100% | 1.0 | 1.9 | 1.2 |
| 109I105Sb+ | 3.835∗ | 0.081 | 0.051 | 1.1 | 1.1 | ||
| 110I106Sb+ | 3.580 | 0.099 | 0.052 | 17% | 3.8 | 6.1 | 5.7 |
| 111I107Sb+ | 3.270 | 0.098 | 0.052 | 0.09% | 2.8 | 3.6 | 2.6 |
| 112I108Sb+ | 2.990 | 0.107 | 0.044 | 0.0012% | 2.9 | 8.7 | 1.4 |
| 113I109Sb+ | 2.705 | 0.107 | 0.044 | 3.31% | 2.0 | 1.5 | 0.9 |
| 108Xe104Te+ | 4.440∗ | 0.045 | 0.016 | 2.9 | 1.5 | ||
| 109Xe105Te+ | 4.067 | 0.053 | 0.017 | 5.0 | 2.9 | 4.1 | |
| 110Xe106Te+ | 3.885 | 0.099 | 0.052 | 64% | 1.1 | 1.5 | 1.0 |
| 111Xe107Te+ | 3.693 | 0.134 | 0.064 | 100% | 9.0 | 2.6 | 2.5 |
| 112Xe108Te+ | 3.330 | 0.134 | 0.056 | 0.8% | 3.4 | 3.7 | 3.8 |
| 113Xe109Te+ | 3.094 | 0.142 | 0.048 | 0.035% | 7.8 | 3.3 | 2.4 |
| 114Xe110Te+ | 2.775∗ | 0.152 | 0.049 | 1.1 | 2.2 | ||
| 115Xe111Te+ | 2.495∗ | 0.161 | 0.043 | 1.1 | 0.6 | ||
| 110Cs106I+ | 4.270∗ | 0.134 | 0.072 | 1.5 | 0.8 | ||
| 111Cs107I+ | 3.900∗ | 0.142 | 0.066 | 6.8 | 9.6 | ||
| 112Cs108I+ | 3.710∗ | 0.152 | 0.058 | 1.6 | 1.0 | ||
| 113Cs109I+ | 3.430∗ | 0.160 | 0.060 | 5.1 | 4.9 | ||
| 114Cs110I+ | 3.357 | 0.161 | 0.059 | 0.018% | 3.2 | 2.9 | 2.7 |
| 112Ba108Xe+ | 4.260∗ | 0.152 | 0.067 | 2.0 | 1.0 | ||
| 113Ba109Xe+ | 4.020∗ | 0.160 | 0.060 | 5.4 | 7.6 | ||
| 114Ba110Xe+ | 3.540 | 0.169 | 0.052 | 0.9% | 4.8 | 2.6 | 1.8 |
References
- (1) G. Audi, O. Bersillon, J. Blachot, and A. H. Wapstra, Nucl. Phys. A729, 3 (2003).
- (2) S. Hofmann and G. Münzenberg, Rev. Mod. Phys. 72, 733 (2000).
- (3) Yu. Ts. Oganessian et al., Phys. Rev. C 72, 034611 (2005).
- (4) B. Buck, A. C. Merchant, and S. M. Perez, Atomic Data and Nuclear Data Tables 54, 53 (1993).
- (5) G. Royer, J. Phys. G 26, 1149 (2000).
- (6) D. S. Delion, A. Sandulescu, and W. Greiner, Phys. Rev. C 69, 044318 (2004).
- (7) D. S. Delion, S. Peltonen, and J. Suhonen, Phys. Rev. C 73, 014315 (2006); D. S. Delion and A. Sandulescu, J. Phys. G 28, 617 (2002).
- (8) V. Yu. Denisov and H. Ikezoe, Phys. Rev. C 72, 064613 (2005).
- (9) P. Mohr, Phys. Rev. C 73, 031301(R) (2006).
- (10) S. B. Duarte et al., Atomic Data and Nuclear Data Tables 80, 235 (2002).
- (11) Chang Xu and Zhongzhou Ren, Nucl. Phys. A753, 174 (2005); A760 303 (2005).
- (12) Y. K. Gambhir, A. Bhagwat and M. Gupta, Phys. Rev. C 71, 037301 (2005).
- (13) P. R. Chowdhury, C. Samanta, and D. N. Basu, Phys. Rev. C 73, 014612 (2006)
- (14) D. Seweryniak et al., Phys. Rev. C 73, 061301(R) (2006).
- (15) S. N. Liddick et al., Phys. Rev. Lett. 97, 082501 (2006).
- (16) G. R. Satchler and W. G. Love, Phys. Reps. 55, 183 (1979).
- (17) G. F. Bertsch, J. Borysowicz, H. McManus, and W. G. Love, Nucl. Phys. A 284, 399 (1977).
- (18) T. L. Stewart, M. W. Kermode, D. J. Beachey, N. Rowley, I. S. Grant, and A. T. Kruppa, Phys. Rev. Lett. 77, 36 (1996).
- (19) Chang Xu and Zhongzhou Ren, Phys. Rev. C 73, 041301(R) (2006); Phys. Rev. C 74, 014304 (2006).
- (20) C. Mazzocchi et al., Phys. Lett. B532, 29 (2002).
- (21) P. Möller, J. R. Nix, W. D. Myers, and W. J. Swiatecki, Atomic Data and Nuclear Data Tables 59, 185 (1995).
- (22) National Nuclear Data Center, Brookhaven National Laboratory, http://www.nndc.bnl.gov/
- (23) P. Möller, J. R. Nix, and K. -L. Kratz, Atomic Data and Nuclear Data Tables 66, 131 (1997).