Some thoughts on critical and tricritical points and deconfinement
Abstract:
We start with a discussion of a phase diagram and three special collision energies: (i) the first touching of the mixed phase; (ii) the softest point; (iii) the critical point. We then proceed to more details about the role a massless critical mode should play in the particle interaction and the elliptic flow. We then enter a discussion of whether high density QGP is or is not strongly coupled, and if so what one can say about color superconductivity domain using universality and data on trapped ultracold fermionic atoms. At the end, we briefly discuss deconfinement, or more specifically on whether there are precursors of the QCD strings at , as well as possible role of magnetically charged excitations (monopoles and dyons).
1 Mapping this talk on the phase diagram
Let us start with a presentation of our main map of the territory, the QCD phase diagram. Its most used form is a plane of temperature -baryonic111Of course one can introduce different chemical potential for each quark flavor. However, we do not need to do so in this talk. chemical potential . A schematic version of it we will need for our purposes is shown in Fig.1. The low-T-low- part is a confining hadronic phase denoted by H. The very high-T region is a weakly coupled quark-gluon plasma denoted by wQGP, and the region not too high above is now known as strongly coupled one, sQGP. The dashed lines introduced by Zahed and myself [1] show expected “zero binding lines” of corresponding binary channels, which are also known as “curves of marginal stability” (CMS). (The subscript is color representation, so means color singlet charmonium, and a color triplet diquarks. ) The right lower part of the diagram is the domain of color superconductivity, believed to be separated from QGP by a second order transition line. The place where two transition line meet is called the “triple” point: here all three basic phases of QCD – confined, QGP and Color Superconductivity – can coexist. The issue where is it at the phase diagram depends on the maximal pairing possible: indeed one is often asked whether it can be reached via heavy ion collisions. We will address recent progress on this in section 4.

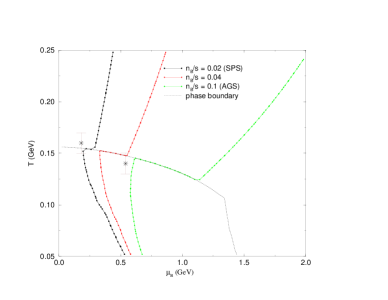
The point is the endpoint of liquid-gas transition of nuclear matter, and we believe there is another critical endpoint denoted by , which separates the cross over (to the left of it) from the first order transition to the right of it. The exact location of point E is subject to intense work on the lattice, which is yet to converge to as definite value. At there is a second order transition, which must be accompanied by specific phenomena associated with infinite correlation length: we will return to it in section 3 where we will argue that this should dramatically increase attractive mean field potentials for baryons and non-Goldstone mesons. In particular, we expect a downward shift of the mass of vector mesons to be greatly increased in its vicinity, which is directly accessible via dilepton experiments. For Goldstone modes – the pions – we predict that their interaction is instead becoming stronger and more repulsive. There are observable implications of these effects for collective flows of pions and nucleons.
As other talks at this conference, we focus our discussion toward rather poorly explored region in the middle of the map, where forthcoming high-density (HD) RHIC runs and eventually FAIR experiments would take place. It is widely expected that those may locate the critical endpoint . Moreover, in section 2 we will show as the collision energy grows from around few GeV/N there are two more special energy points. The first corresponds to energy when the “initial point” reached the phase transition line for the first time. The second (known as the “softest point”) is when it starts venturing into the QGP domain.
Of course, thermodynamical quantities are not the only ones which one would like to know. Many other practically important quantities can be calculated perturbatively in QGP, such as dilepton and photon production rates. Transport properties like viscosity or particle diffusion constant are especially important, because they define the micro length defining applicability of the approach. (Unfortunately, it is next to impossible calculate those on the lattice.)
It is in this area where recent revolution happened: both RHIC data as well as some theory development have lead to a conclusion [2] that QGP is in fact in a “strongly coupled” regime, named sQGP, and is a near-perfect liquid rather than a weakly interacting gas. Fascinating connections between theory of sQGP and other strongly coupled systems – string theory, ultracold atoms, e/m strongly coupled plasmas – have lead to a tremendous progress in the last few years. We will not however address “strong coupling” issues in this talk (except in relation to triple point).
Another long-standing problem is the famous problem of confinement. More specifically, we would like to understand what happens at the deconfinement region, at . In section 5 we will discuss some new ideas about its precursors from the plasma side.
2 Three special energy points for heavy ion collisions
The phase diagram is a theoretical concept, appropriate for the infinite matter in equilibrium. The idea of “traveling” from one point to another includes the assumption that all transitions happen slowly, at a time scale long enough to get new equilibrium established. Clearly, this is not so during initial period of the collisions, in which large amount of entropy is produced by very non-equilibrium phenomena: therefore (unlike for textbook heat engines) one can map only the cooling part of the cycle.
Those are described by “adiabatic paths”: an early example222 It comes from a decade-old paper Hung and myself [3] devoted to hydrodynamics of radial flow at SPS. of such paths is shown in Fig.1(b), for a particular resonance gas plus bag-model QGP thermodynamics with the first order transition. Since the baryon number is also conserved, the ratio of baryon to entropy densities remains constant along the line: those values are shown in the figure. I show it to emphasize their zigzag shapes: the reason is fixed in H and QGP phases do not match. Continuity demands that (in spite of continuous expansion!) there is a “reheating” part of the zigzag hiding behind the phase boundary. (Two data points correspond to experimentally extracted “chemical freezeout points” for different collision energies: more recent points of the kind will be shown in Fig.4 below.)
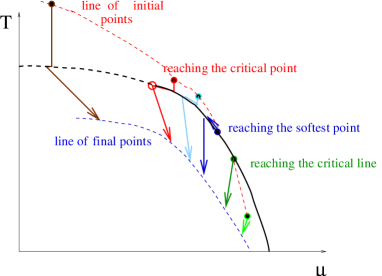

Let us now look at Fig.2 which shows more sophisticated phase diagram, indicating special collision points specifically relevant for (high-density) HD-RHIC–FAIR energy domain. The upper (red) dashed line corresponds to the “initial” points reached in the collision333 Although its definition is rather vague – equilibrium is “nearly reached” because “most of the entropy” is already generated – changing it would presumably move this line a bit, but not the cooling paths stemming from it (the zizgzags with arrows) themselves.. Those cooling paths, distinguished via value, go through the transition line, if it is on its way, toward the “kinetic freezout line” shown by the lower (blue) dashed line.
At very low energy we are at the right lower end of the diagram: and both the initial and final lines are in hadronic (nuclear) matter phase. As the energy of the collision grows, one reaches the first singular point, at which the initial point touches the phase boundary. The second one is when the initial point separates from the “mixed phase” into the QGP phase. This point was called the softest point in [3], because here ratio is believed to reach its minimum. It corresponds to longer-lived fireball expansion.
As lattice results show, moving to the left along the phase boundary one eventually find a “rapid crossover” regime at small , with the second-order critical endpoint . The first-order-related zigzags are supposed to change near the critical point into a different “focusing” behavior, suggested in [4] and detailed in [5].
Another way to look at the phase diagram, perhaps more appropriate for our applications, is to transfer all quantities from () representation to their thermodynamical conjugates, the entropy and baryon densities (). A schematic picture of such plot is shown in Fig.2(b). In this case the cooling curves are extremely simple: as we use log-log scale, they are just a set of parallel lines with the unit slope
| (1) |
But “the law of conservation of difficulties” cannot be ignored: now the phase boundaries become very complicated instead. Furthermore, in such variables the “mixed phase” domain (hiding inside the 1-st order line before) now opens up and gets visible (the dashed region). If the whole transition would be first order, the whole region between (green) dash-dotted lines would be a mixed phase. The shadows gray area corresponds to “true” mixed phase. As in the previous figure, we also indicated the set of initial points by a (red) dashed line, and a “final” line by (blue) dashed line blow. All three special points indicated above are seen on this plot nicer.
Returning to the experimental program, for HD-RHIC and FAIR, one may say that their main objectives should be location of all three collision energies corresponding to those three points. As also emphasized by other talks, we dont know where the critical point is, but most likely it is around . The “softest point” is perhaps at : maybe it is related with the (so far unexplained ) “horn” in ratio observed by the NA49 collaboration at the lowest SPS energies due to different expansion time. The “first touch” point I think is around ; the corresponding experimental hits are perhaps the sudden change in energy dependence of radial and elliptic flows.
3 The critical mode and its effect on flow
Let me first remind that thermodynamics (and also of the masses of the related modes) follows from the Landau-Ginzburg function, which was discussed in detail in the second paper [4]. Without quark masses (in the chiral limit) one has a so called tricritical point, which becomes simply critical when finite quark masses are included. As is well known, Goldstones – the pions – are massive anywhere, including the critical point444Where which is only slightly differs from in Gellman-Oaks-Renner relation in the vacuum. Below we will ignore this small correction and treat pion mass as unchanged from the vacuum value. .
The real difference should come from the “critical mode” which (in terms of its “screening mass”) must gets massless at the critical point. And, at this point, massless means really massless, for the real world with nonzero quark masses. Although we will refer to it as “sigma” field below, actually the critical mode is a mixture between scalar and vector mesons555At nonzero baryon density, C-parity is broken and such mixing is allowed.
Stephanov, Rajagopal and myself [4] were the first to propose experimental search for the QCD (t)critical point in heavy ion collisions, by varying the energy of and looking for “non-monotonic” signals. The first specific signal proposed in that paper was an increased event-by-event fluctuations near it, reminiscent of critical opalescence well known near other 2-nd order phase transitions. The second proposal of [4] was the so called “focusing effects” already mentioned above. Both are quite subtle signals. In this talk I would like to discuss my later suggestions [6] of few (hopefully) more robust signals of the critical point.
All non-Goldstone particles (such as baryons and e.g. vector mesons) have effective mean field potentials in hadronic phase, a significant part of which is the attractive sigma exchange. If one take any particular model of those (e.g. Walecka model for nuclear forces) and put naively sigma mass to zero, huge effect follows, which cannot possibly be realistic. It happens because the nuclear potential is in fact a highly tuned small difference of two large terms. This also makes any predictions difficult. Yet there is little doubt that infinite-range attraction will increase the potentials.
One observable consequence of that can be extra large mass shifts for mesons
| (2) |
These shifts were experimentally seen in nuclear matter, where mass shifts by about 14% [7], as well as in heavy ion collisions e.g. in peripheral AuAu collisions at RHIC, where STAR collaboration [8] finds about 10% shift of . Extra mass shift near the critical point should be of the same order of magnitude.
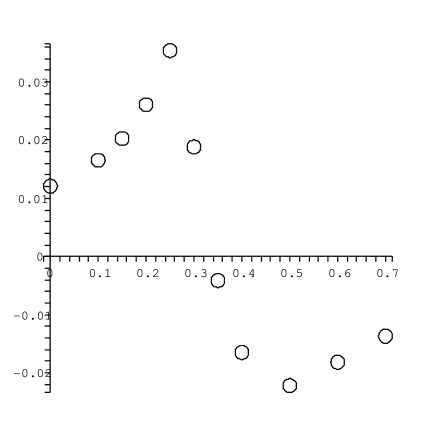
For pions the effect should be different. First of all, they must interact with sigma with derivatives, to protect their Goldstone masses, thus there is no significant effect of large distance (small momentum) sigmas on them. On the contrary: if sigma mass (now a real one, not the screening) shifts so that , sigma gets unable to decay to pions and also strong repulsion in the channel will follow. Thus very light sigma implies a effect on pions (evaluated in [6], see Fig.3 ).
Now, if the nucleon-nucleon and nucleon-non-Goldstone-meson interaction gets much more attractive near the critical point than it is elsewhere, this should reduce collective flows of nucleons, both their radial and elliptic components. At the same time, as the pion-pion interaction gets more repulsive, one should expect the opposite effect in the pion flows.
Sudden reduction of the baryonic flow at low SPS energy was reported by NA49: whether it is a real effect we hope to learn soon from HD-RHIC runs.
4 The location of a triple point and (strongly coupled) color superconductivity
Color superconductivity (CS) in dense quark matter in general appears due to attractive interaction in certain scalar diquark channels. More specifically, three mechanisms of such attraction were discussed in literature are: (i) the electric Coulomb interaction (see e.g.[9]) (ii) instanton-induced ’t Hooft interaction [10, 11] and the magnetic interaction [12]. The instanton mechanism have re-activated the field, because it have demonstrated for the first time that large (and thermodynamically significant) pairing may actually appear in cold quark matter. Since forces induced by small-size instantons are not affected by screening that much, they can be much stronger than (i), leading to gaps about 2 orders of magnitude larger [10, 11].
However such gaps are rather uncertain because they are so large666 Additional argument [10] why one should believe such large gaps: the interaction but in channel is responsible for chiral symmetry breaking, producing the gap (the constituent quark mass) as large as 350-400 MeV. Furthermore, in the two-color QCD, the so called Pauli-Gursey symmetry relates these two condensates directly. that they may fall outside of applicability range of the usual BCS-like mean field theory. Unfortunately, an analytic theory of strong pairing is still in its infancy. The main idea of this letter is to get around this “technical” problem by using the universality arguments and an appropriate atomic data.
The interaction (scattering) of two quarks is maximally enhanced (to its unitarity limit) if there is a marginal state in the diquark channel, a bound state with near-zero binding or a virtual state at small positive energy. In atomic systems such situations are generically called a “Feshbach resonance”, tuned by external magnetic field. Transition between these two possibilities is reflected in specific behavior of the condensation, known as BEC-to-BCS transition. In the middle, with resonance at exactly zero binding, the interaction is at its maximum, limited by unitarity (for the relevant s-wave).
In quark-gluon plasma the existence of marginally bound states of quarks and gluons and their possible role in liquid-like behavior at RHIC has been pointed out in [1]. For any hadronic states one can argue that they dissolves at large or , and thus existence of some lines of zero binding on the phase diagram are unavoidable. The issue was so far studied only for small and high relevant for RHIC heavy ion program: and indeed there are theoretical, lattice and experimental evidences that e.g. charmonium ground state does not melt till about .
In [13] I had explored consequences of the idea that there is a marginal binding line, closely trailing the phase boundary line on the phase diagram. If this is the case (which I cannot prove at this time), it must cross the CS critical line, separating the CS region into a BCS-like and BEC-like, see right lower part of Fig.1(a). Lines of zero binding of a pair starts at at the temperature very close to the critical line : the reason for that is that effective color attraction in state is only of that in mesons such as charmonium. The lines associated with (color triplet) diquark are the lower (blue) dashed and dash-dotted lines: below the former diquark binding is below zero and above the later it does not exist at all, even as a Cooper pair.
How can one relate atomic and quark systems, if at all? The way it can be done is due to the so called “universality” of the system. As the scattering length gets large , it cannot enter the answers any more. As a result, there remain so few parameters on which the answer may depend777 The next parameter of scattering amplitude, the effective range, is about 3 orders of magnitude smaller than interparticle distance for trapped atoms, and thus completely irrelevant. Although similar parameter for quarks are not that small, we will assume it does not affect the universal results too much. on that those can be absorbed by selection of the appropriate units.
The 50-50 mixture of two “spin” states is characterized by the density and the particle mass . Quantum mechanics adds to the list of possible quantities, and so one has only 3 input parameters, which can be readily absorbed by selecting proper units of length, time and mass. Thus the pressure (or mean energy) at infinite and zero can only be related by some universal numerical constant . We do not know how to get its value from any theory (other than quantum Monte-Carlo simulations or other brute force methods), but it has been measured experimentally (e.g. by the very size of the trapped system). The same should hold for transport properties: e.g. viscosity of such universal gas can only be where is some universal coefficient [15]. Similarly, the critical temperature must be simply proportional to the Fermi energy
| (3) |
with the universal constant .
Experimental progress in the field of strongly coupled trapped fermionic atoms is quite spectacular; unfortunately this author is certainly unqualified to go into its discussion. Let me just mention one paper, which killed remaining doubts about superfluidity: a discovery by the MIT group of the quantized vortices, neatly organized into the usual lattice [14]. We will however need only the information about the of the transition temperature. Duke group lead by J.E.Thomas (Kinast et al) have for some time studied collective vibrational modes of the trapped system. Their frequencies in strong coupling regime are well predicted by hydrodynamics and universal equation of state, with little variation with temperature. Their damping however show significant -dependence: in fact Kinast et al [17] have found two distinct transitions in its behavior. The lowest break in damping is interpreted as the phase transition to superfluidity, it corresponds to
| (4) |
where stands for the Fermi energy of the ideal Fermi gas at the center of the trap. In another (earlier) set of experiments [16] there has also been found a change in the specific heat, at . In spite of some numerical difference between these two values, the Duke group indicates that both are related to the same phenomenon888 They do not provide any error bars on the value of , as the absolute value of the temperature is obtained in rather indirect calibration procedure. The reader may take the spread of about 20% as an estimate of uncertainties involved.. At another temperature
| (5) |
the behavior of the damping visibly changes again. Kinast et al interpret it as a transition to a regime where not only there is no of atomic pairs, but even the pairs themselves are melted out.
4. There are of course important differences between quarks and atoms. First, quarks have not only spin but also flavor and color, so there are more Fermi surfaces. However, in the first approximation one may focus only at one pair of them (say u-d quarks with red-blue colors) which are actually paired. Second, atoms are non-relativistic while quarks are in general relativistic and in matter may have some complicated dispersion laws. Since the gaps are large, one cannot use a standard argument that close to Fermi surface only Fermi velocity is important. Nevertheless, we will assume that quark quasiparticles have dispersion laws which can be approximated by a simple quadratic form
| (6) |
where dots are for terms we ignore. In matter and need not be the same. It then implies that e.g. the relation between the critical and chemical potential should read
| (7) |
and similarly for the second point. (The factor 3 appears because baryon number is counted per baryon, not quark.)
The can be used to set the units as explained above, and we will not actually need its value. The is needed, but since it makes a simple shift of the chemical potential, it can be eliminated by differentiation. Thus we get a prediction of the slope of the critical line
| (8) |
The intersection of CMS for diquarks with the SC critical line (the point S (strong) in our phase diagram Fig.1(a)) should thus be at this line, at which the boundary of superconducting phase crosses with the zero energy of the bound state. The second critical point associated with disappearance of pairs (identified with the (blue) dash-dotted line and point D in Fig.1(a)) should thus be at the line with the slope .
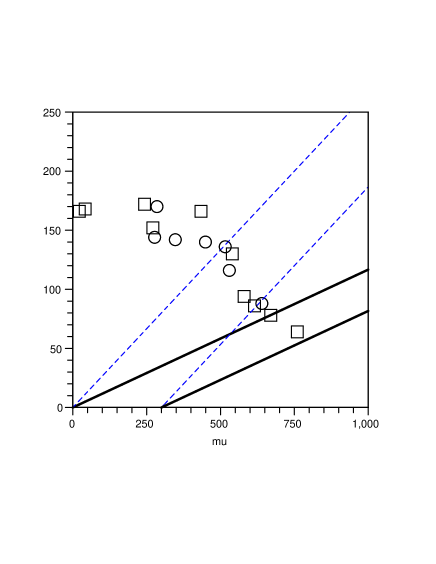
In order to plot the line on the phase diagram one needs the value of the , which unfortunately is not known. To set the upper bound one may simply take and draw two straight lines pointing to the origin, see Fig.1(b). As grows, the lines slide to the right, as is shown by another line with a (randomly chosen) value .
Finally, we turn to “realistic” phase diagram, with numerical values extracted from experiment. We know for sure that matter is released at the so called chemical freezeout lines indicated by points in Fig.1(b). These points are the ends of adiabatic cooling paths. Unfortunately we do not know how high above them those curves start at a given collision energies. However it is general expected that this line more or less traces the critical line, being few MeV below it, into the hadronic phase. One may then conclude that the upper limit on of CS is about 70 MeV (intersection of the upper solid lines with the freezeout line). The disappearance of pairing (dashed lines) is thus expected below .
Finally, comparing these results with theoretical expectations and experimental capabilities, we conclude that (i) if there is a strongly coupled CS, its critical temperature should definitely be below . This maximal value is amusingly close to what was obtained from the instanton-based calculations [10, 11]; (ii) therefore no heavy ion collisions can reach the CS domain, even at the maximal coupling. However, a penetration into the region in which non-condensed bound diquarks may exist, I think is quite likely, both in the HD-RHIC runs and in future GSI facility FAIR; (iii) if that happens, one may think of some further uses of universality, e.g. about relating the transport properties in both systems. One may in particularly ask whether the universal viscosity extracted from vibrations of trapped atoms (like that in [15], but at appropriate ) can or cannot describe the hydrodynamics of the corresponding heavy ion collisions.
5 sQGP and deconfinement
The N=2 SUSY YM (“Seiberg-Witten” theory) is a working example of confinement due to condensed monopoles[19]. If it is also true for QCD, at magnetic monopoles must become light and weakly interacting at large distances due to U(1) beta function. Then the Dirac condition forces electric coupling be large (in IR).
Recent lattice data have revealed a puzzling behavior of static potentials, which I call “postconfinement”. At we all know that a potential between heavy quarks is a sum of the Coulomb and a confining potential. At deconfinement the Wilson or Polyakov lines with a static quark pair has vanishing string tension; but this is the free energy . Quite shockingly, if one calculates the or separately (by , ) one finds a force between to be more than twice till rather large distances. The total energy added to a pair is surprisingly large, it reaches about , and the entropy as large as . Since this energy of “associated matter” is about 20 times larger than , any separation of two static quarks must be extremely suppressed by the Boltzmann factor exp(-E/T). (As grows, this phenomenon disappears, and thus it is obviously related to the phase transition itself.)
Where all this energy and entropy may come from in the deconfined phase? The most likely reason is a long (thus energetic) QCD string of a compicated shape (thus a lot of entropy) connecting two static quarks. Such strings can be explained by a “polymerization” of gluonic quasiparticles in sQGP [20].
Let us now add a twist to this story related with magnetic excitations, the monopoles999Recall that they appear naturally if there is an explicit Higgs VEV breaking of the color group. We cannot discuss in detail a QCD setting: the reader may simply imagine a generic finite- configuration with a nonzero mean , an adjoint Higgsing leaving U(1) massless gauge fields. These U(1)’s corresponds to magnetic charges of the monopoles. In AdS/CFT language one may simply considered branes to be placed not at exactly the same point in the orthogonal space.. According to t’Hooft-Mandelstamm scenario, confinement is supposed to be due to monopole condensation. Seiberg-Witten solution for the N=2 SYM is an example of how it is all supposed to work: it has taught us that as one approaches the deconfinement transition the electrically charged particles – quarks and gluons – are getting heavier while monopoles gets lighter and more numerous. Although I cannot go into details here, we do have hints from lattice studies of monopoles and related observables that this is happening in QCD as well.
Let us now think what all of it means for the sQGP close to . Even at classical level, it means that one has a plasma with both type of charges – electric and magnetic – at the same time, with the former dominant at large and the latter dominant close to .
A binary dyon-dyon systems have been studied before , but not manybody ones. The first numerical studies of such systems (by molecular dynamics) are now performed by (Stony Brook student) Liao and myself [21]. We found that a monopole can be trapped by an electric static dipole, both classically and quantum mechanically.
We also found that classical plasma containing magnetic monopoles is sufficient to generate electric flux tubes101010Those are dual to magnetic flux tubes in solar classical plasmas., or the QCD strings. The reason is monopoles scatter from the electric flux tube back into plasma, compressing it. Whether monopoles are condensed or not is not that crucial. Such solutions are in fact dual to known magnetic flux tubes in solar plasma.
Are there bound states of electric and magnetic quasiparticles? Yes, there are a lot of them. A surprise is that even finite- instantons can be viewed as being made of selfdual dyons [22], attracted to each other pairwise, electrically and magnetically. Not only such baryons-made-of-dyons have the same moduli space as instantons, the solutions can be obtained vis very interesting AdS/CFT brane construction [23]. Many more exotic bound states of those are surely waiting to be discovered.
References
- [1] E. V. Shuryak and I. Zahed, Phys. Rev. C 70, 021901 (2004) [arXiv:hep-ph/0307267]. Phys. Rev. D 70, 054507 (2004) [arXiv:hep-ph/0403127].
- [2] E. V. Shuryak,Prog.Part.Nucl.Phys.53:273-303,2004, hep-ph/0312227 Nucl. Phys. A 750, 64 (2005). M. Gyulassy and L. McLerran, Nucl. Phys. A 750, 30 (2005) [ nucl-th/0405013].
- [3] C. M. Hung and E. V. Shuryak, “Equation of state, radial flow and freeze-out in high energy heavy ion Phys. Rev. C 57, 1891 (1998) [arXiv:hep-ph/9709264].
- [4] M. Stephanov, K. Rajagopal and E. Shuryak, Phys. Rev. Lett. 81, 4816 (1998) [hep-ph/9806219]. “Event-by-event fluctuations in heavy ion collisions and the QCD critical point,” Phys. Rev. D60, 114028 (1999) [hep-ph/9903292].
- [5] C. Nonaka and M. Asakawa, “Hydrodynamical evolution near the QCD critical end point,” arXiv:nucl-th/0410078.
- [6] E. Shuryak, “Interactions between hadrons are strongly modified near the QCD (tri)critical point,” arXiv:hep-ph/0504048.
- [7] CBELSA/TAPS Collaboration (D. Trnka et al.). Apr 2005. 4pp. Phys.Rev.Lett.94:192303,2005; nucl-ex/0504010
- [8] P. Fachini, J. Phys. G 30, S735 (2004) [arXiv:nucl-ex/0403026].
- [9] D. Bailin and A. Love, “Superfluidity And Superconductivity In Relativistic Fermion Systems,” Phys. Rept. 107, 325 (1984).
- [10] R. Rapp, T. Schäfer, E. V. Shuryak and M. Velkovsky, “Diquark Bose condensates in high density matter and instantons,” Phys. Rev. Lett. 81, 53 (1998) [hep-ph/9711396].
- [11] M. Alford, K. Rajagopal and F. Wilczek, “QCD at finite baryon density: Nucleon droplets and color superconductivity,” Phys. Lett. B422, 247 (1998), [hep-ph/9711395].
- [12] D. T. Son, ‘Superconductivity by long-range color magnetic interaction in high-density quark matter,” Phys. Rev. D59, 094019 (1999) [hep-ph/9812287].
- [13] E. V. Shuryak, “Locating strongly coupled color superconductivity using universality and experiments with trapped ultracold atoms,” arXiv:nucl-th/0606046.
- [14] M. W. Zwierlein, J. R. Abo-Shaeer, A. Schirotzek, C. H. Schunck and W. Ketterle,Nature 435, 1047-1051 (23 June 2005)
- [15] B. A. Gelman, E. V. Shuryak and I. Zahed, “Cold Strongly Coupled Atoms Make a Near-perfect Liquid,” Phys. Rev. A 72, 043601 (2005), nucl-th/0410067.
- [16] J. Kinast et al, Science 25, jan.2005
- [17] J. Kinast et al, cond-mat/0502507)
- [18] A. Andronic, P. Braun-Munzinger, J. Stachel, Nucl.Phys.A772:167-199,2006, nucl-th/0511071
- [19] N. Seiberg and E. Witten, “Electric - magnetic duality, monopole condensation, and confinement in N=2 supersymmetric Yang-Mills theory,” Nucl. Phys. B 426, 19 (1994) [Erratum-ibid. B 430, 485 (1994)] [arXiv:hep-th/9407087].
- [20] J. Liao and E. V. Shuryak, Nucl.Phys.A, in press, arXiv:hep-ph/0508035. Phys. Rev. D 73, 014509 (2006) [arXiv:hep-ph/0510110].
- [21] J. Liao and E. V. Shuryak, in progress
- [22] T. C. Kraan and P. van Baal, “Exact T-duality between calorons and Taub - NUT spaces,” Phys. Lett. B 428, 268 (1998) [arXiv:hep-th/9802049].
- [23] K. M. Lee and P. Yi, “Monopoles and instantons on partially compactified D-branes,” Phys. Rev. D 56, 3711 (1997) [arXiv:hep-th/9702107].