-decay in neutron-deficient Hg, Pb, and Po isotopes
Abstract
The effect of nuclear deformation on the energy distributions of the Gamow-Teller strength is studied in neutron-deficient Hg, Pb, and Po even isotopes. The theoretical framework is based on a self-consistent deformed Skyrme Hartree-Fock mean field with pairing correlations between like nucleons in BCS approximation and residual spin-isospin interactions treated in the proton-neutron quasiparticle random phase approximation. After a systematic study of the Gamow-Teller strength distributions in the low excitation energy region, relevant for -decay, we have identified the best candidates to look for deformation signatures in their -decay patterns. half-lives and total Gamow-Teller strengths are analyzed as well.
pacs:
PACS: 21.60.Jz, 23.40.-s, 27.70.+q, 27.80.+wI Introduction
The existence of spherical and deformed nuclear shapes coexisting in a given nucleus at low excitation energies is nowadays a well established feature characterizing many isotopes in the neutron-deficient Hg, Pb, and Po region (see Ref. [1] and references therein). These coexisting structures have been found experimentally by studying the -rays in coincidence with the emitted -particles in the -decay of the fusion products created in selected fusion-evaporation reactions. As a matter of fact, the existence of at least one low-lying excited state in all even Pb isotopes between and has been experimentally observed at excitation energies below 1 MeV [1, 2]. Similarly, Hg isotopes from up to have been found to be oblate in their ground states with prolate excited states in the 1 MeV range.
Within a mean field description of the nuclear structure, the presence of several states at low energies is understood as due to the coexistence of different collective nuclear shapes. The energies of the different shape configurations are calculated using a nuclear potential with the energies of the single particle orbitals depending on the deformation. Calculations of the potential energy surface have become more and more refined with time. Phenomenological mean fields and Strutinsky method [3], are already able to predict the existence of several competing minima in the deformation energy surface of neutron-deficient Hg and Pb isotopes. Self-consistent mean field calculations [4, 5] and calculations including correlations beyond mean field [6, 7, 8] confirm these results. In particular, for Pb isotopes, all the approaches analyzed in Ref. [7], from mean field up to very sophisticated angular momentum projected generator coordinate methods, provide the same underlying basic picture of strong coexisting spherical and deformed shapes. This justifies the use of mean field approaches as a first estimate to a qualitative description of the energy minima and to associate the states with coexisting energy minima in this energy surface.
The relative energies of the different shapes predicted by mean field calculations in the neutron-deficient Hg-Pb region have been found to be very sensitive to fine details in the calculations, specially to pairing effects. This is true in both non-relativistic [9] and relativistic calculations [5, 10, 11]. In particular, standard deformed relativistic mean field (RMF) calculations [10, 12] do not reproduce the experimentally observed spherical ground states in the neutron-deficient Pb isotopes. In RMF, these isotopes are found to be deformed using standard forces with constant pairing gaps [10, 12]. It should be emphasized that the same RMF+BCS calculations that lead to good agreement with experimental data in systematic studies of ground state properties carried out over 1300 even-even isotopes [12], fail to account for the spherical ground states in this neutron-deficient Pb region. It has been also shown [11] that using constant strengths for the pairing interaction, which makes the gap parameters dependent on deformation, produces spherical ground states in the Pb isotopes. Yet, more recently [5], an improved treatment of pairing was used by means of a relativistic Hartree-Bogoliubov calculation with the NL3 effective interaction and a finite range Gogny force to describe the pairing properties. However, it produced again oblate ground states in 188-194Pb, contradicting the experimental data. In order to recover the spherical ground states, a new parametrization of the effective interaction was proposed [5].
In a recent work [13], we have calculated the -decay properties of the neutron-deficient Pb isotopes using a deformed Skyrme HF+BCS+QRPA approach. This approach was used extensively [14] to demonstrate that the -decay properties of unstable nuclei may depend on the nuclear shape of the decaying parent nucleus and to predict to what extent the GT strengths may be used as fingerprints of the nuclear shapes. Accurate measurements of the GT strength distributions in Kr and Sr isotopes [15] have supported the usefulness of these studies. By analyzing the energy deformation curves corresponding to those Pb isotopes we found that, although the relative energies of the various minima are dependent on both the Skyrme and pairing forces, the existence of shape isomers as well as the location of their equilibrium deformations are rather stable. We also found that the Gamow-Teller (GT) strength distributions calculated at the various equilibrium deformations exhibit specific features that can be used as signatures of the shape isomers, and what is important, these features basically remain unaltered against changes in the Skyrme and pairing forces. Therefore, although an accurate calculation of the excitation energies of the states is beyond the scope of the theoretical framework used here, our estimate of the -decay patterns is reliable and has been proved to be useful [14, 15].
Motivated by the interest in this type of calculations, not only in Pb isotopes but also in the neighbor regions where shape coexistence is found as well, in this paper we extend the calculations of the GT strength distributions to the neutron-deficient 180,182,184,186,188,190,192Hg, 184,186,188,190,192,194Pb and 198,200,202,204,206Po even isotopes, using the Skyrme force SLy4 [16], which is one of the most recent and successful forces. The reason for this choice of isotopes is that they are the best candidates for -decay experimental studies. They are -unstable isotopes, yet not dominated by other decay modes such as -decay. In addition they have relative large half-lives and large enough energies to make experiments feasible. Nevertheless, we present the results obtained not only within the window relevant for the -decay, which is being considered as a real possibility to be measured at ISOLDE/CERN [17], but also the GT strength distributions for and in the whole range of excitation energies up to 25 MeV that could be extracted from charge exchange reactions in the near future at the new experimental facilities involving radioactive isotope beams, such as FAIR. Charge exchange reactions at small momentum transfer are a powerful tool to study GT strength distributions when -decay is not energetically possible. For incident energies above 100 MeV the isovector spin-flip component of the complex effective interaction is dominant and the cross section at forward angles is proportional to the GT strength [18].
The paper is organized as follows. In Sec. II we briefly present the main features of our theoretical framework. Sec. III contains our results on the energy deformation curves and Gamow-Teller strength distributions in the neutron-deficient Hg, Pb, and Po isotopes relevant for -decay. We also discuss the half-lives, the summed GT strengths, and the GT strength distributions in the whole range of excitation energies. Sec. IV contains the main conclusions.
II Brief description of the formalism
The theoretical formalism used to describe the GT strength distributions has been already shown elsewhere [14]. Here we only summarize the basic ingredients of the method and discuss our choice of interactions and parameters. The method starts from a self-consistent deformed Hartree-Fock mean field calculation with effective two-body density-dependent Skyrme interactions including pairing correlations in BCS approximation. In this paper we consider the force SLy4 [16], which has been specially designed to improve the isospin properties of nuclei away from beta stability and therefore, it may be more adequate to describe the neutron-deficient Hg, Pb, and Po under study in this work. Comparison with other widely used Skyrme forces like Sk3 [19] and SG2 [20] was done in the past [13, 14] concluding that the main characteristics of the -decay patterns are not significantly changed when using different forces.
In this work we have restricted our study to axially deformed nuclear shapes. The single-particle wave functions are then expanded in terms of the eigenstates of an axially symmetric harmonic oscillator in cylindrical coordinates, using eleven major shells. This simple picture is validated from triaxial calculations [3, 6, 8], which show at most slight triaxiality () only in very few cases. However, the triaxial barriers are not in general sufficiently high to fully support the axial symmetry assumption and it would be interesting to consider these effects in future works.
The method also includes pairing between like nucleons in the BCS approximation with fixed gap parameters for protons and neutrons , which are determined phenomenologically from the odd-even mass differences through a symmetric five term formula involving the experimental binding energies [21]. When the experimental masses are not known we use the expression MeV for protons and neutrons. Occupation probabilities are determined at each Hartree-Fock iteration by solving the corresponding gap and number equations. The energy curves as a function of deformation are calculated performing constrained HF calculations with quadrupole constraints [22], minimizing the HF energy for each nuclear deformation.
We add to the mean field a separable spin-isospin residual interaction to describe GT transitions. The advantage of using separable forces is that the QRPA energy eigenvalue problem is reduced to find the roots of an algebraic equation. The residual interaction contains two parts, particle-hole () and particle-particle (). The part
| (1) |
is responsible for the position and the general structure of the GT resonance [14, 23, 24]. The usual procedure to determine the coupling strength is to reproduce the energy of the resonance [24]. In this work we use the same value of for all the isotopes considered in this mass region. The value is fixed by comparison of the calculations in 208Pb to the experimental GT strength resonance observed at an energy of 19.2 MeV, relative to the parent nucleus, from charge exchange reactions [25]. In this way, we reproduce the energy of the resonance with MeV.
The particle-particle residual interaction is a neutron-proton pairing force in the coupling channel. We introduce this interaction as a separable force in the usual way [24, 26]
| (2) |
Once the value of the spin-isospin residual force has been established, the coupling strength is usually adjusted to reproduce the measured half-lives [24, 26] because the peak of the GT resonance is almost insensitive to the force. In our case, as explained in Ref. [13] we have found that the calculated half-lives as a function of are very little dependent on this parameter and we use MeV, which is compatible with the parametrization of Ref. [24], obtained from a systematic fitting procedure over the nuclear chart.
For even-even nuclei, the Gamow-Teller strength in the laboratory frame for a transition can be obtained as
| (3) |
in units of and in terms of the intrinsic amplitudes calculated in QRPA[14]. To obtain this expression we have used the initial and final states in the laboratory frame expressed in terms of the intrinsic states , using the Bohr-Mottelson factorization [27].
The -decay half-life is obtained by summing up all the allowed transition probabilities, weighed with phase space factors, up to states in the daughter nucleus with excitation energies lying within the -window,
| (4) |
where s. We include the standard effective factor
| (5) |
In this work we use experimental values because as it was discussed in Ref. [13] the -values calculated from the binding energies of parent and daughter nuclei are quite similar for the various shapes and are close to the corresponding experimental values. In decay, consists of two parts, positron emission and electron capture. We have computed them numerically for each value of the energy. The Fermi integrals are given by
| (6) |
with
| (7) |
where ; ; is the fine structure constant and the nuclear radius. is the total energy of the particle, is the total energy available in units, and is the momentum in units. In the numerical calculation, we have included screening and finite size effects as explained in Ref. [28]. The electron capture rates have also been included following Ref. [28]:
| (8) |
where denotes the atomic subshell from which the electron is captured, is the neutrino energy, is the radial component of the bound state electron wave function at the nucleus, and stands for other exchange and overlap corrections [28].
III Results and discussion
In this section we present the results obtained for the -decay patterns of the neutron-deficient 180-192Hg, 184-194Pb and 198-206Po even isotopes. First, we discuss the energy surfaces and shape coexistence expected in these isotopes. Then, we present the results obtained for the Gamow-Teller strength distributions with special attention to their dependence on the nuclear shape and discuss their relevance as signatures of deformation to be explored experimentally. Finally, we discuss the half-lives and the summed GT strengths both within the and in the whole energy range.
A Equilibrium deformations
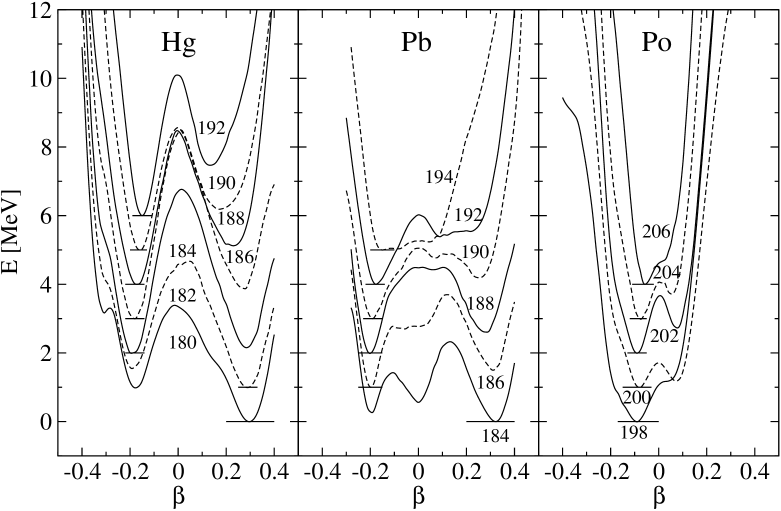
We show in Fig. 1 the HF energies calculated with the Skyrme force SLy4 and pairing correlations treated in the fixed gap approach. We show the results for Hg (left), Pb (middle), and Po (right) isotopes as a function of the quadrupole deformation parameter calculated as , which is defined in terms of the proton quadrupole moment and charge r.m.s. radius . The curves have been scaled to the energy of their ground states and have been shifted by 1 MeV from one isotope to the next one, starting from the lightest one.
In the case of Hg isotopes we get prolate and oblate minima in all the isotopes from up to . The ground state is prolate for 180Hg and 182Hg and oblate for 184-192Hg isotopes. Comparable results were also obtained in RMF calculations [12], where oblate ground states where obtained at with prolate minima close in energy at . This is in qualitative agreement with experiment, where it is observed that a weakly oblate ground-state band is crossed in the vicinity of by a deformed band associated with a prolate energy minimum. The prolate states minimize their energies for , although they still lie above the ground state. We get qualitative agreement although the details of the energy minima depend much on the effective Skyrme force and pairing treatment used in the calculations. In the case of Pb isotopes we obtain a prolate ground state for 184Pb and oblate ground states for 186-194Pb isotopes. As we can see in the figure, prolate and oblate minima are always present from to . Spherical local minima can be clearly seen also in and shallow profiles are found in other cases. For Po isotopes we find oblate ground states in all the isotopes considered 198-206Po. We also find prolate solutions, which are more prominent in isotopes.
In general, we observe that both oblate and prolate deformed minima occur at smaller deformation as the number of neutrons increases, approaching the closed shell. This is true in Hg, Pb, and Po isotopes and the effect is more pronounced in the prolate shapes. The oblate minima are rather stable at in Hg and Pb isotopes and at about in Po isotopes.
We get similar qualitative results for the Hg, Pb, Po isotopes considered when other Skyrme forces are used. More specifically, we obtain the same patterns of coexistence with minima at about the same deformations although the relative energies may change from one force to another. In the case of Hg and Pb isotopes the correspondence of the minima obtained with different forces is almost perfect. In the case of Po isotopes we find the deformation of the minima with SG2 and SLy4 almost coincident. Sk3 shows only one oblate minimum that corresponds quite well with the oblate minimum obtained with the other forces, but in the prolate region Sk3 shows only a small distortion of the curve without developing a minimum. In the case of 206Po, Sk3 and SG2 exhibit only a flat minimum centered at the spherical shape.
In general, our results agree with experiment in the sense that we find different coexisting shapes in this mass region, but in some cases they are at variance with experiment in the predicted shape of the ground state. This is especially true with respect to Pb isotopes. This discrepancy, also found in different theoretical frameworks [5, 9], was discussed in [13], where we demonstrated on some examples the sensitivity of the energy curves to fine details of the two-body interactions, showing that the deformation minima remain at about the same deformation values but their relative energies may change considerably.
B Gamow-Teller strength distributions
In this subsection we study the energy distribution of the Gamow-Teller strengths calculated at the equilibrium shapes that minimize the energy of the nucleus.
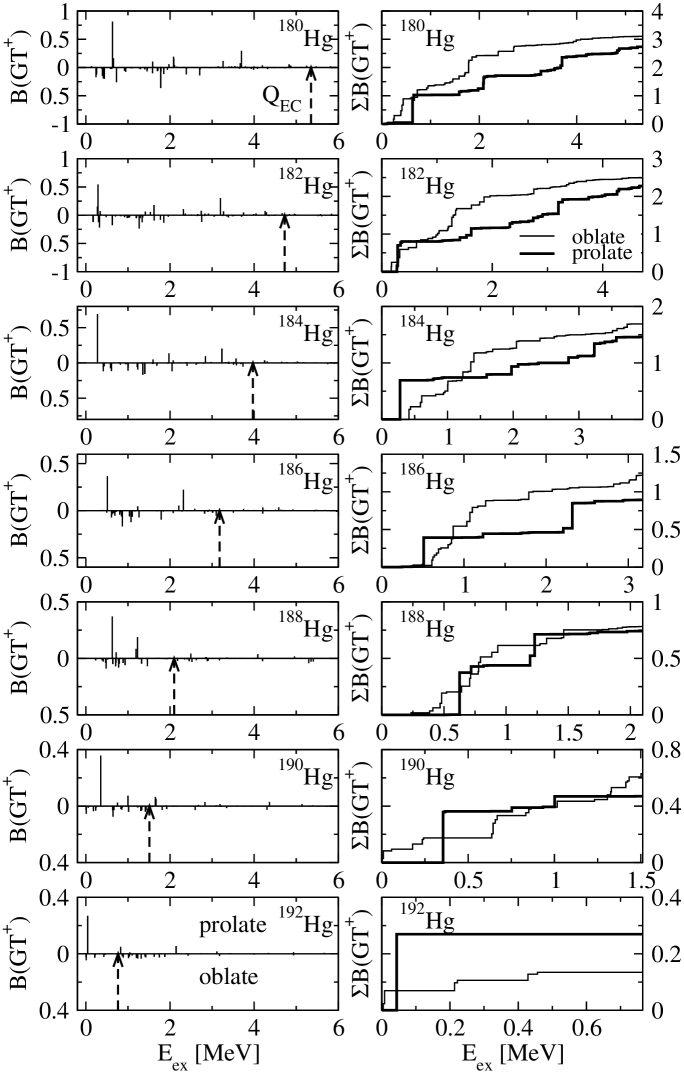
In Fig. 2 we show the GT strength distributions in () units as a function of the excitation energy in the daughter nucleus for the Hg isotopes under study. The results correspond to QRPA with the force SLy4, fixed pairing gaps obtained from experimental masses and residual separable interactions and with coupling strengths given by MeV and MeV, respectively. The left panels contain the discrete strengths for both prolate (upward) and oblate (downward) equilibrium deformations. The dashed arrows indicate the experimental values of the decay. We have used the same energy scale to appreciate better the differences as we increase the number of neutrons. The scale of energies is 6 MeV, enough to include all the energies, whose maximum value is MeV in 180Hg. The right panels contain the accumulated GT strength for prolate (thick lines) and oblate (thin lines) deformations. In this case the energy axis is extended up to the value in order to observe directly the allowed energy window and the total GT strength expected in the decay. Although such kind of accumulated plots contain in principle the same information as the pure spectrum, it offers a more global and appealing view, which is sometimes preferable. One should also notice that in figures 2-7 the quenching factor (see Eq.(5)) is not included and therefore, one should consider a reduction of this strength by a factor of about two when comparing to experiment.
From Fig. 2 one can see that prolate and oblate nuclear shapes give rise to GT strength distributions whose patterns can be clearly distinguished from each other. The oblate strength appears in all cases very fragmented over the whole -window, which induces a straight increasing of the strength in the accumulated plot. On the other hand, the distributions in the prolate cases show a concentration of the GT strength in a single strong peak located at very low excitation energy (below 0.7 MeV in all the isotopes). This single excitation carries practically the whole strength contained in the -window in the isotopes and about half of it in . The accumulated plots are then characterized by the successive appearance of large vertical steps followed by large flat regions, in contrast to the oblate case. With the help of the accumulated plots we can also observe immediately that although the total strength contained within the energy is quite similar for oblate and prolate shapes, the distribution of this strength along the energy axis is very different.
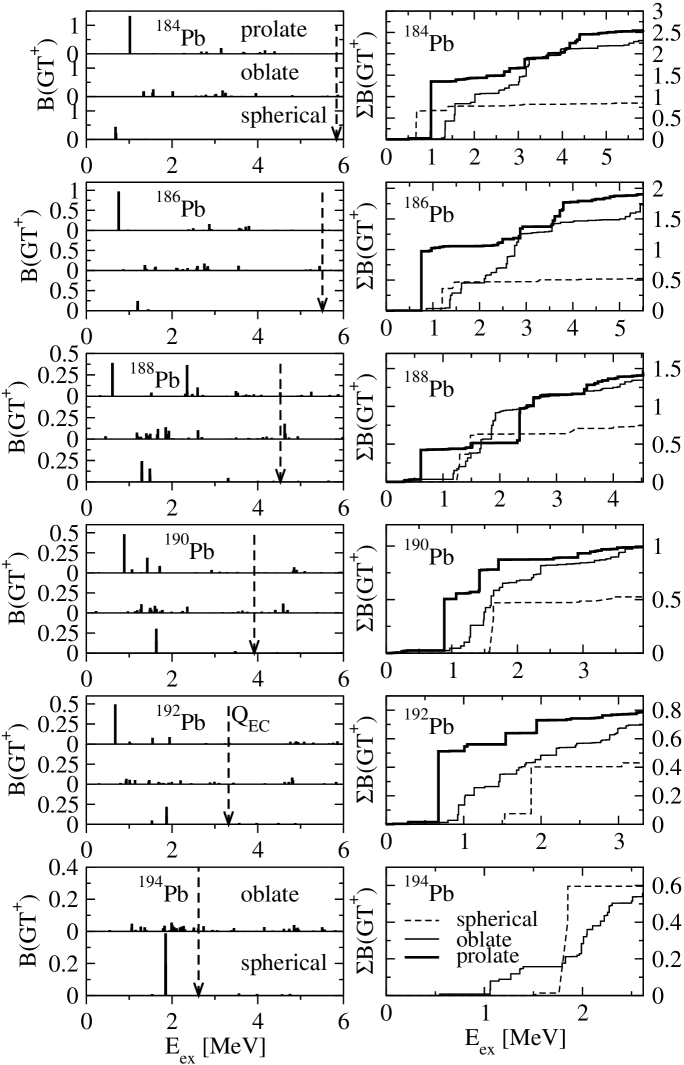
Fig. 3 contains the same information as Fig. 2 but for Pb isotopes. In this case we also include results for spherical shapes in such a way that the left panels contain the results from prolate shapes (upper plots), oblate shapes (middle plots) and spherical shapes (lower plots), except in the isotope where we only have two shapes. Similarly, the right panels contain three lines, thick line for prolate, thin for oblate, and dashed for spherical shapes. As in the case of Hg isotopes, the signature of the prolate shapes is a strong isolated peak at low excitation energies (there is a second strong peak in ). This makes again the accumulated plots to appear as big steps. The oblate distributions show a very fragmented structure, starting at higher energies than the strong prolate peak. This produces an accumulated pattern which increases in a steady way, starting at higher energy than the prolate pattern. In the spherical case, the strength is practically collected in a single peak, which corresponds to the transition. This excitation carries less strength than the prolate case and occurs in all the isotopes except in at an energy higher than the prolate peaks. It is also worth noticing that oblate and prolate shapes generate practically the same total GT strength within the window although the internal distribution of this strength is in general very different. The total strength in the spherical case is always clearly below the prolate or oblate strength, except in the isotope , where the small strength and makes it not very relevant.
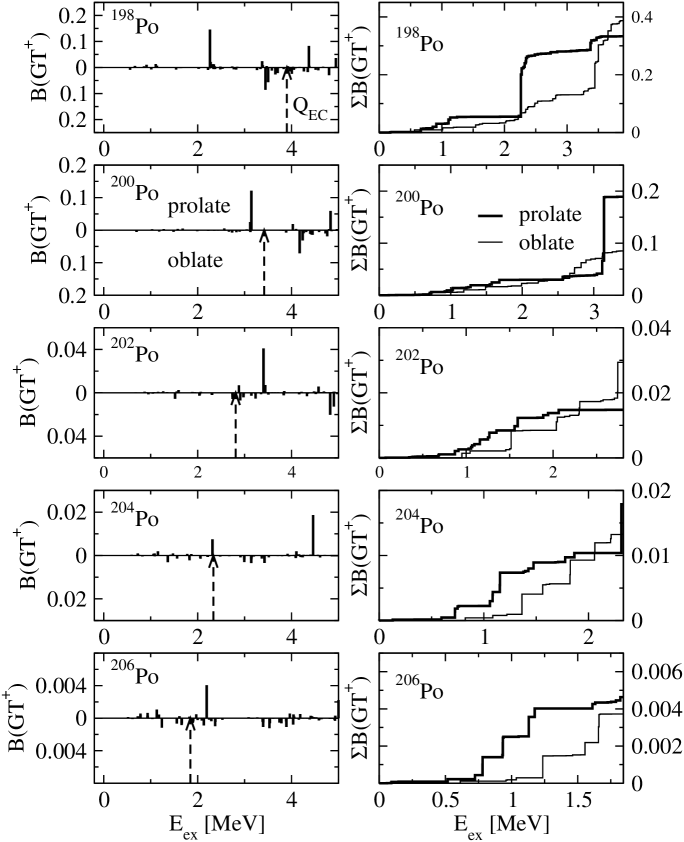
Fig. 4 shows the same results as in Fig. 2 for Po isotopes. In the cases of we find in the prolate case below a strong single peak carrying most of the strength, while again the oblate shapes produce a very fragmented distribution. In the other cases, , the strength below is insignificant and could not tell much to distinguish the shapes.
In general, we observe that the GT strength distributions corresponding to prolate shapes in both Hg and Pb isotopes are characterized by the appearance of a strong excitation below 1 MeV that collects a large amount of the total strength contained in the whole region below the energy. On the other hand, the GT strength distributions corresponding to oblate shapes are always very fragmented and are extended over the whole window. In the case of the Pb isotopes this strength is located at excitation energies higher than the prolate peak. For Pb isotopes the GT strength distributions corresponding to spherical shapes appear as single peaks carrying all the strength below and also at higher energies than the prolate peak. These features are in agreement with the conclusions in Ref. [13] using the force Sk3. The most noticeable difference with respect to the results obtained from Sk3 force [13] appears in the spherical case, where the GT strength obtained with Sk3 is displaced to higher energies as compared to the strength obtained with SLy4. The origin of the shift in the excitation energy can be traced back to the predicted energies for the and spherical shells. The main contribution to the GT strength at low energies comes from the transition connecting the almost fully occupied shell with the partially unoccupied shell, and the relative position of the two shells determines the GT excitation energy. The effect of deformation is to allow for multiple transitions fragmenting the strength and smoothing the differences caused by the forces.
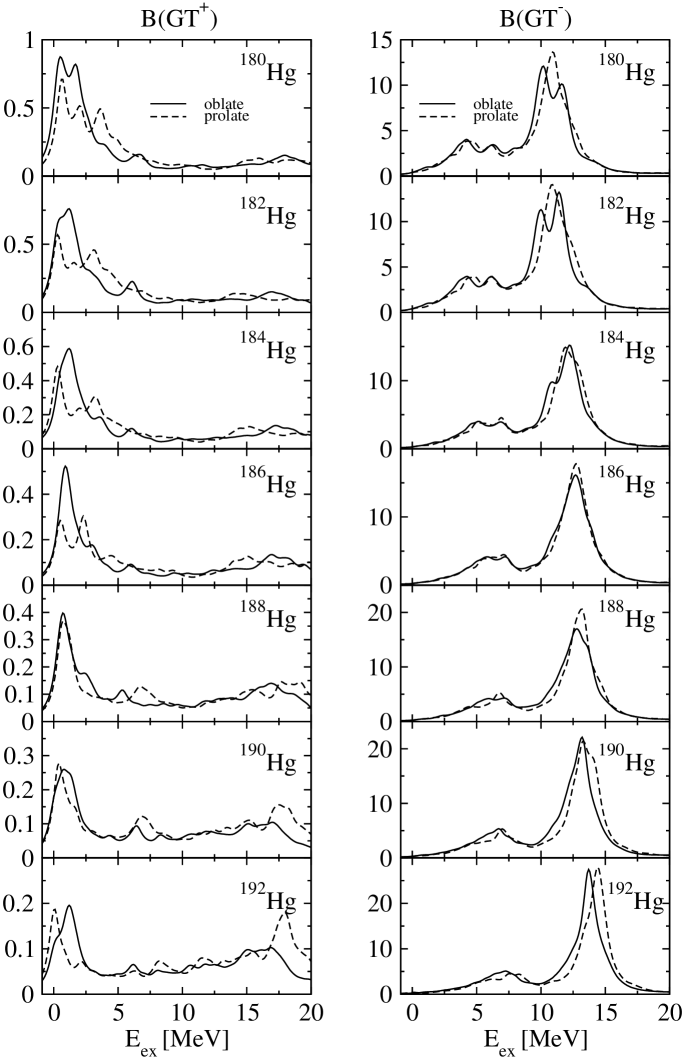
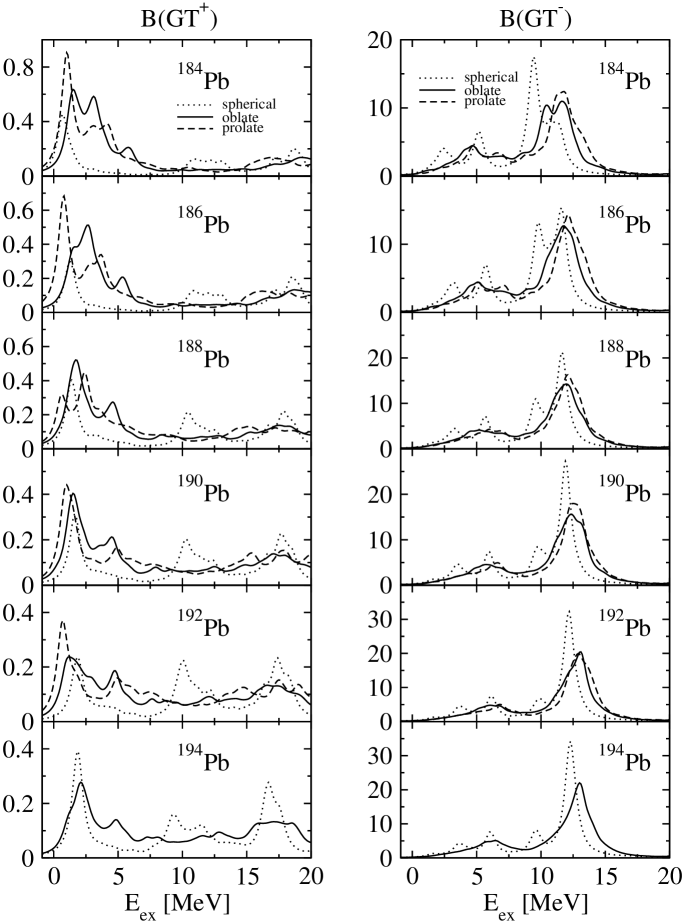
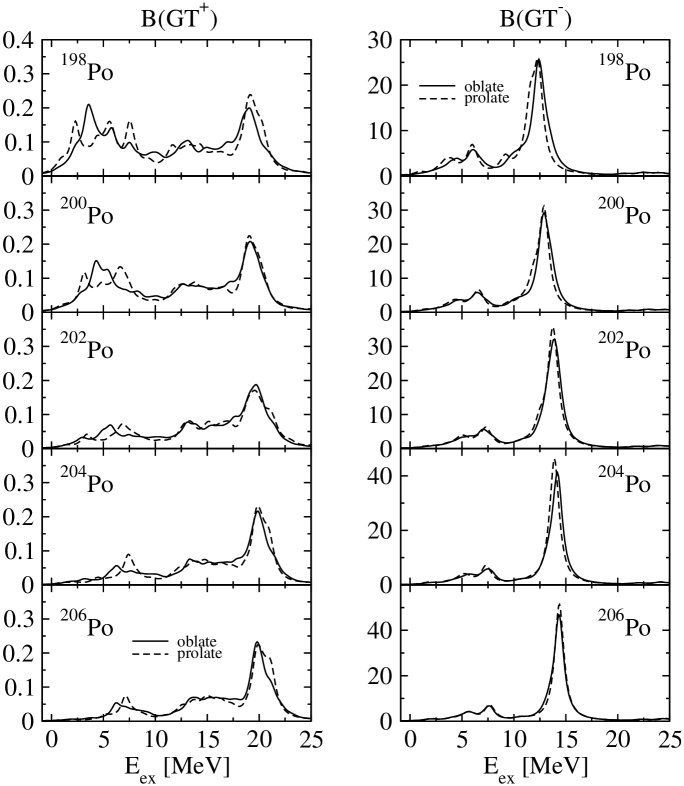
In Figs. 5-7 we show the strength distributions in the Hg, Pb and Po isotopes. We plot continuous distributions resulting from a folding procedure using MeV width gaussians on the discrete spectrum. The energy range of excitation energies in the daughter nucleus is extended up to 20 MeV in order to cover all the strength. We find the strength beyond 20 MeV to be insignificant, except for Po isotopes where we extend the scale up to 25 MeV. The interest of these figures, not limited by the energies, is to show the whole strength distributions that could be explored from charge exchange reactions such as and or similar reactions. The strength on the right panels is much stronger than the corresponding strength on the left panels, as it should be according to the Ikeda sum rule , which is fulfilled in all our calculations up to a small few percent discrepancy. Ikeda sum rule ranges from in 180Hg up to in 206Po. We can see in the last three columns of Tables 1, 2, and 3 the total sums of the , , and the percentage of the Ikeda sum rule fulfilled in the calculation for Hg, Pb, and Po isotopes, respectively.
In Fig. 5, the profiles of the strength show a first bump, which for the lightest isotopes considered is a double bump, moving from 4 MeV in up to 7 MeV in . We can also see a big resonance at higher energies, that moves from 11 MeV in up to 14 MeV in . In any case, the profiles obtained from oblate and prolate shapes are quite similar and then, it will be very difficult to use this information to distinguish between one shape or another. In the case of the strength, there is a resonance at low energy below 2 MeV, which is rather constant in all the isotopes. As we have seen in more detail in Fig. 2, it is in this region below where the shape dependence could be exploited because prolate and oblate shapes produce distinguishable distributions of the GT strength.
Fig. 6 is similar to Fig. 5 for Pb isotopes. Again we see in the profiles of the strength on the right panels a small bump between 5 and 6 MeV and a resonance centered at 12-13 MeV. The nuclear shapes can hardly be identified looking at the strength distributions. The strengths show also a resonance at low energies, which corresponds to the analysis made in Fig. 3. Fig. 7 for Po isotopes shows once more the small bump in the distribution at 6-7 MeV and the big resonance at 12-14 MeV with similar characteristics in all the isotopes and shapes. The strength shows in this case a resonance at high energy around 20 MeV and the low energy distributions that were studied in Fig.4.
C Half-lives and summed strengths
It is also interesting to calculate integral magnitudes from the GT strength distributions that characterize them in a single quantity. This is the case of the total half-lives and total GT strength contained in the energy range available in the -decay. These magnitudes depend differently on the GT strength distribution, one of them is simply a sum and the other one is a weighted sum (see Eq.(4)). While the total GT strength involved in the -decays are not measured yet, there is experimental information on the half-lives[21] that allows to contrast our calculations and to check that there is no substantial disagreement with experiment. We can see the results in Tables 1, 2, and 3 for Hg, Pb, and Po isotopes, respectively. The first column in Tables 1-3 contains the experimental energies [21]. Since the decay mode competes in this mass region with -decay, we show in the second column of the tables the percentage of the total decay assigned to [21]. The third column contains the total experimental half-lives [21] and within brackets the corresponding half-lives extracted from the percentage in the second column. The next columns contain theoretical results calculated at the equilibrium shapes obtained with the force SLy4. We can see first the half-lives calculated with quenching factors (5) and experimental values, as discussed in Ref. [13]. Next, we can see the strength summed up to the energies, the total and sums and the percentage of the Ikeda sum rule fulfilled.
In Table 1 one can see that the half-lives obtained for Hg isotopes agree in general with experiment within a factor of 2. Only the most stable isotope deviates considerably from this agreement, but this case is not very relevant because of the small energy window allowed for the decay MeV and because of the small strength involved, which makes it meaningless. A factor of 2 is perfectly acceptable in this type of calculations taking into account the uncertainties coming from the forces used, the level of approximations, the quenching factors and the energies. For instance, reasonable quenching factors could change the half-lives within a effect and varying values within 1 MeV range could change the half-lives by a factor of two. Another source of uncertainty in the half-lives is induced by the determination of the pairing gaps from the experimental binding energies. Through variations of below and above the adopted proton and neutron pairing gap values, we obtain half-lives which in general do not differ by more than from the original results. We also find that in the spherical cases the half-lives are more sensitive to these uncertainties than in the deformed cases. Nevertheless, as we have discussed, this does not rule out the conclusions extracted based on the patterns shown by the GT strength distributions. We also include in the table the strength contained below the energy that could be measured in -decay experiments [17]. We should keep in mind that in contrast to the calculation of the half-lives, we do not include quenching factors in the summed strengths and thus, a reduction of about of the values written in the tables are expected when comparing to experiment. The sums over the whole energy region of the and strengths show that the total is much stronger than as it should happen in order to fulfill Ikeda sum rule, as it was discussed above. In the case of Hg isotopes we can see that the half-lives from prolate deformations are in general larger than those from oblate ones with the already mentioned exception of . The summed strengths are practically the same no matter what the deformation is.
The same general comments can be applied also to Table 2 for Pb isotopes. We get in general half-lives that agree with experiment within a factor 2-3 . This is also true when we consider other Skyrme forces. In particular, the half-lives obtained with the forces Sk3 and SG2 are very similar to the corresponding SLy4 ones shown in the tables. The only disagreement appears in the spherical cases. We find in the spherical case differences up to factors of 4-5 in the half-lives obtained from various forces. As we have already discussed above, this is due to the different predicted energies of the spherical shell gaps. If we compare the half-lives from different deformations, we can see that the half-lives from the spherical shapes are larger than those corresponding to the deformed shapes, and the prolate shapes give always lower half-lives than the oblate ones. In the case of SLy4, the half-lives from the spherical shapes agree with experiment at the same qualitative level as the half-lives from deformed shapes. This is at variance with what we found in Ref. [13] using Sk3 and SG2 forces, in the sense that there, we only found agreement with experimental half-lives with deformed shapes. The strengths summed up to are very close to each other for oblate and prolate deformations and are much larger than the corresponding strength for the spherical case.
In Table 3 we have the results for Po isotopes. In this case the total GT strength involved in the decay is very small in all the cases and therefore the half-lives are large and not very meaningful. Only in the two more unstable isotopes this comparison makes sense and we can see that again the half-lives agree with experiment within a factor of two. The oblate half-lives are larger than the corresponding prolate ones.
Although the deformation does not show up in the total GT strengths, it does in the internal distribution of the GT strength, specially in the at low excitation energy where the -decay is sensitive. The only purpose of showing half-lives and summed strengths is to contrast the validity of the calculation against some measured quantities in the case of half-lives or to predict the expected total strength coming into play in the other case.
IV Summary and Conclusions
We have studied the energy distribution of the Gamow-Teller strength in the neutron-deficient 180-192Hg, 184-194Pb, and 198-206Po isotopes. We use a deformed pnQRPA formalism with spin-isospin and separable residual interactions. The coupling strength is fixed to reproduce the energy of the GT resonance in 208Pb. The coupling strength is taken from existing global parametrizations, although we find our results to be quite insensitive to this value. The quasiparticle mean field is generated from a deformed HF approach with the two-body Skyrme effective interaction SLy4. It includes pairing correlations in BCS approximation, using fixed gap parameters extracted from the experimental masses. The equilibrium deformation is derived self-consistently within the HF procedure.
An analysis of the energy deformation curves shows that oblate and prolate coexisting shapes are expected in the neutron-deficient Hg and Po isotopes. In the case of Pb isotopes we also get in some cases a spherical minimum giving rise to a triple shape coexistence. We should remark again that the relative energies of the minima in these calculations are very sensitive to the Skyrme force and type of pairing used and therefore the predicted shapes for the ground states can be altered depending on the choice of these forces. However, for a given isotope, the equilibrium deformations at which the minima occur are hardly shifted.
The GT strength distributions calculated at the equilibrium shapes show that the effect of the deformation is much stronger than the effects coming from the Skyrme or pairing forces used. As a general rule, we find that the GT strength distributions calculated from prolate shapes are characterized by strong single peaks at low excitation energies carrying a sizable amount of the total GT strength involved in the -decay. The small remaining GT strength is scattered over the energy interval up to . On the other hand, the signature of oblate shapes is a distribution spread all over the available -window energy. In the case of Pb isotopes, the GT strength distributions calculated from spherical shapes are characterized by single peaks that contain all the GT strength, which are in general located at higher energies than the prolate peaks. The detailed analysis performed allows us to identify good candidates to explore experimentally the signatures of deformation on the GT strength distributions. We find that the most interesting isotopes are 184-188Hg, 188-192Pb and 198,200Po.
We have also investigated the GT strength distributions in the whole range of excitation energies without the limitations imposed by the -decay. This analysis is worth as a prediction for the cross sections to be expected in charge exchange reactions.
The detailed analysis at low excitation energies in the distribution shows that the -decay process is the most sensitive to the nuclear shape.
The calculated total strength involved in the -decay shows little dependence on the nuclear shape, except in the case of the spherical shapes in Pb isotopes, where this strength is much smaller. The calculated half-lives agree with experiment within a factor of 2 or 3. In general we can conclude that neither the half-lives nor the summed strengths are good observables to study deformation effects, but the strength distributions are.
Acknowledgments
We are grateful to A. Algora and B. Rubio for useful discussions. This work was supported by Ministerio de Educación y Ciencia (Spain) under contract number FIS2005-00640. O.M. thanks Ministerio de Educación y Ciencia (Spain) for financial support. R.A.-R. thanks I3P Programme (CSIC, Spain) for financial support. We also acknowledge participation in the EXL-EURONS European Collaboration (RI3-506065).
REFERENCES
- [1] R. Julin, K. Helariutta and M. Muikku, J. Phys. G.: Nucl. Part. Phys. 27, R109 (2001).
- [2] A.N. Andreyev et al., Nature 405, 430 (2000).
- [3] R. Bengtsson and W. Nazarewicz, Z. Phys. A 334, 269 (1989); W. Nazarewicz, Phys. Lett. B 305, 195 (1993).
- [4] N.A. Smirnova, P.-H. Heenen and G. Neyens, Phys. Lett. B 569, 151 (2003).
- [5] T. Niksic, D. Vretenar, P. Ring and G.A. Lalazissis, Phys. Rev. C 65, 054320 (2002).
- [6] J. Libert, M. Girod and J.-P. Delaroche, Phys. Rev. C 60, 054301 (1999).
- [7] J.L. Egido, L.M. Robledo and R.R. Rodríguez-Guzmán, Phys. Rev. Lett. 93, 082502 (2004); R.R. Rodríguez-Guzmán, J.L. Egido and L.M. Robledo, Phys. Rev. C 69, 054319 (2004).
- [8] M. Bender, P. Bonche, T. Duguet and P.-H. Heenen, Phys. Rev. C 69, 064303 (2004).
- [9] N. Tajima, H. Flocard, P. Bonche, J. Dobaczewski and P.-H. Heenen, Nucl. Phys. A 551, 409 (1993).
- [10] S. Yoshida, S.K. Patra, N. Takigawa and C.R. Praharaj, Phys. Rev. C 50, 1398 (1994).
- [11] S. Yoshida and N. Takigawa, Phys. Rev. C 55, 1255 (1997).
- [12] G.A. Lalazissis, S. Raman, and P. Ring, Atomic Data and Nuclear data Tables 71, 1 (1999).
- [13] P. Sarriguren, O. Moreno, R. Álvarez-Rodríguez, and E. Moya de Guerra, Phys. rev. C 72, 054317 (2005).
- [14] P. Sarriguren, E. Moya de Guerra, A. Escuderos and A.C. Carrizo, Nucl. Phys. A 635, 55 (1998); P. Sarriguren, E. Moya de Guerra and A. Escuderos, Nucl. Phys. A 658, 13 (1999); Nucl. Phys. A 691, 631 (2001); Phys. Rev. C 64, 064306 (2001).
- [15] E. Poirier et al., Phys. Rev. C 69, 034307 (2004); E. Nácher et al., Phys. Rev. Lett. 92, 232501 (2004).
- [16] A. Chabanat, P. Bonche, P. Haensel, J. Meyer, and R. Schaeffer, Nucl. Phys. A 635, 231 (1998).
- [17] A. Algora, B. Rubio and W. Gelletly, private communication.
- [18] T.N. Taddeucci et al., Nucl. Phys. A 469, 125 (1987).
- [19] M. Beiner, H. Flocard, N. Van Giai and P. Quentin, Nucl. Phys. A 238, 29 (1975).
- [20] N. Van Giai and H. Sagawa, Phys. Lett. B 106, 379 (1981).
- [21] G. Audi, O. Bersillon, J. Blachot and A.H. Wapstra, Nucl. Phys. A 729, 3 (2003).
- [22] H. Flocard, P. Quentin, A.K. Kerman and D. Vautherin, Nucl. Phys. A 203, 433 (1973).
- [23] J. Krumlinde and P. Moeller, Nucl. Phys. A 417, 419 (1984); P. Moeller and J. Randrup, Nucl. Phys. A 514, 1 (1990).
- [24] H. Homma, E. Bender, M. Hirsch, K. Muto, H.V. Klapdor-Kleingrothaus and T. Oda, Phys. Rev. C 54, 2972 (1996).
- [25] C. Gaarde et al. Nucl. Phys. A 369, 258 (1981); ibid. 396, 127c (1983).
- [26] M. Hirsch, A. Staudt, K. Muto and H.V. Klapdor-Kleingrothaus, Nucl. Phys. A535, 62 (1991); K. Muto, E. Bender, T. Oda and H.V. Klapdor-Kleingrothaus, Z. Phys. A 341, 407 (1992).
- [27] A. Bohr and B. Mottelson, Nuclear Structure, (Benjamin, New York 1975).
- [28] N.B. Gove and M.J. Martin, Nucl. Data Tables 10, 205 (1971).
| isotope | % | % Ikeda | ||||||
|---|---|---|---|---|---|---|---|---|
| 180Hg, obl | 5.352 | 52 | 2.6 (4.9) | 3.0 | 3.10 | 4.63 | 64.20 | 99.28 |
| prol | 4.6 | 2.73 | 4.43 | 63.99 | 99.27 | |||
| 182Hg, obl | 4.725 | 86.2 | 10.8 (12.6) | 5.6 | 2.49 | 4.27 | 69.62 | 99.02 |
| prol | 7.5 | 2.28 | 4.18 | 69.51 | 98.98 | |||
| 184Hg, obl | 3.970 | 98.89 | 30.6 (30.9) | 17.5 | 1.71 | 3.06 | 74.46 | 99.17 |
| prol | 17.0 | 1.46 | 3.08 | 74.50 | 99.19 | |||
| 186Hg, obl | 3.176 | 100 | 82.8 (82.8) | 47.2 | 1.22 | 2.57 | 79.85 | 99.08 |
| prol | 68.4 | 0.89 | 2.46 | 79.76 | 99.10 | |||
| 188Hg, obl | 2.099 | 100 | 195 (195) | 185.1 | 0.78 | 2.51 | 85.64 | 98.96 |
| prol | 218.9 | 0.74 | 2.59 | 85.72 | 98.96 | |||
| 190Hg, obl | 1.511 | 100 | 1200 (1200) | 506.9 | 0.63 | 2.10 | 90.84 | 98.60 |
| prol | 493.8 | 0.47 | 2.27 | 91.35 | 98.98 | |||
| 192Hg, obl | 0.765 | 100 | 17460 (17460) | 5200 | 0.14 | 1.71 | 96.55 | 98.79 |
| prol | 1970 | 0.27 | 1.80 | 96.94 | 99.10 |
| isotope | % () | % | ||||||
|---|---|---|---|---|---|---|---|---|
| 184Pb, sph | 5.84 | 20 | 0.49 (2.45) | 5.6 | 0.85 | 1.95 | 61.65 | 99.50 |
| obl | 5.6 | 2.31 | 3.61 | 63.31 | 99.50 | |||
| prol | 3.3 | 2.55 | 4.01 | 63.70 | 99.48 | |||
| 186Pb, sph | 5.51 | 60 | 4.82 (8.03) | 16.3 | 0.54 | 1.65 | 67.28 | 99.44 |
| obl | 10.7 | 1.73 | 2.91 | 68.58 | 99.50 | |||
| prol | 4.8 | 1.91 | 3.34 | 68.94 | 99.39 | |||
| 188Pb, sph | 4.53 | 90.7 | 25.5 (28.1) | 28.0 | 0.76 | 2.11 | 73.76 | 99.51 |
| obl | 20.3 | 1.35 | 3.05 | 74.72 | 99.54 | |||
| prol | 16.1 | 1.46 | 3.16 | 74.78 | 99.47 | |||
| 190Pb, sph | 3.92 | 99.6 | 71 (71) | 80.0 | 0.54 | 1.92 | 79.48 | 99.44 |
| obl | 41.7 | 0.99 | 2.67 | 80.26 | 99.47 | |||
| prol | 26.4 | 0.99 | 2.89 | 80.32 | 99.27 | |||
| 192Pb, sph | 3.32 | 100 | 210 (210) | 251.7 | 0.41 | 1.90 | 85.57 | 99.61 |
| obl | 93.4 | 0.70 | 2.44 | 86.12 | 99.62 | |||
| prol | 45.6 | 0.79 | 2.70 | 86.26 | 99.48 | |||
| 194Pb, sph | 2.62 | 100 | 720 (720) | 655.8 | 0.62 | 2.02 | 90.70 | 98.53 |
| obl | 482.5 | 0.56 | 2.32 | 90.99 | 98.52 |
| isotope | % () | % | ||||||
|---|---|---|---|---|---|---|---|---|
| 198Po, obl | 3.900 | 43 | 106 (247) | 342 | 0.387 | 2.23 | 91.13 | 98.78 |
| prol | 160 | 0.333 | 2.24 | 91.25 | 98.90 | |||
| 200Po, obl | 3.416 | 88.9 | 690 (776) | 1390 | 0.085 | 1.82 | 96.64 | 98.77 |
| prol | 1066 | 0.189 | 1.82 | 96.76 | 98.90 | |||
| 202Po, obl | 2.809 | 98.08 | 2682 (2735) | 8799 | 0.029 | 1.42 | 102.9 | 99.46 |
| prol | 5341 | 0.015 | 1.41 | 102.88 | 99.48 | |||
| 204Po, obl | 2.334 | 99.34 | 12708 (12729) | 29788 | 0.013 | 1.32 | 108.88 | 99.59 |
| prol | 12167 | 0.018 | 1.31 | 108.90 | 99.62 | |||
| 206Po, obl | 1.846 | 94.55 | 760320 (804145) | 256650 | 0.0037 | 1.25 | 114.78 | 99.59 |
| prol | 55352 | 0.0046 | 1.24 | 114.72 | 99.54 |