Hadron production in central nucleus-nucleus collisions at chemical freeze-out
Abstract
We analyze the experimental hadron yield ratios for central nucleus-nucleus collisions in terms of thermal model calculations over a broad energy range, =2.7-200 GeV. The fits of the experimental data with the model calculations provide the thermal parameters, temperature and baryo-chemical potential at chemical freeze-out. We compare our results with the values obtained in other studies and also investigate more technical aspects such as a potential bias in the fits when fitting particle ratios or yields. Using parametrizations of the temperature and baryonic chemical potential as a function of energy, we compare the model calculations with data for a large variety of hadron yield ratios. We provide quantitative predictions for experiments at LHC energy, as well as for the low RHIC energy of 62.4 GeV. The relation of the determined parameters with the QCD phase boundary is discussed.
keywords:
hadron production , statistical model , QCD phase diagram, ,
1 Introduction
The success of the statistical (thermal) model [1] in describing the ratios of hadron yields produced in nucleus-nucleus collisions is remarkable. The thermal model was initially used for the AGS and SPS data [2] and was subsequently employed to describe data at SIS [3, 4], SPS [5] and more recently at RHIC [6, 7, 8, 9]. An analysis of the energy dependence of the thermal parameters extracted from fits of the experimental data, temperature () and baryo-chemical potential (), established the ”line of chemical freeze-out” [10]. These data were subsequently interpreted in terms of an universal condition for chemical freeze-out [11]. Remarkably, it appears that at the top SPS energy the (,) values reach the phase boundary between the hadronic world and the quark-gluon plasma (QGP) [1, 10], as calculated solving Quantum Chromo-Dynamics (QCD) on the lattice [12, 13, 14]. In this context, it has been argued that the QGP itself and the ”deus ex machina” of phase space filling during hadronization are playing the crucial roles in achieving thermalization in high energy nucleus-nucleus collisions [15]. More recently it was demonstrated that passing through the phase transition leads to multiparticle scattering of Goldstone bosons which drives even (multi)strange baryons rapidly into equilibration [16], providing a natural explanation for the observation that the chemical freeze-out line reaches the phase boundary for small values of . The situation is less well understood for 400 MeV and needs further investigation.
Despite its simplicity, the thermal model allows to extract essential properties of the hot and dense fireball produced in high energy nucleus-nucleus collisions at a given stage in its evolution, namely when the inelastic collisions cease (chemical freeze-out). This makes the model a unique tool in the attempt to quantify from the experimental side the features of the phase diagram of hadronic matter [17, 18, 19]. Recent analyses over a broad energy range [20, 21] have contributed in the on-going efforts to understand the chemical freeze-out criteria [1, 10, 11, 22, 23, 24] in the phase diagram. It has been pointed out within a thermal model analysis that scanning the energy one encounters a transition from baryon- to meson-dominated freeze-out [25], with its associated fingerprint on the characteristics of hadron yields, also evidenced earlier [26].
![[Uncaptioned image]](/html/nucl-th/0511071/assets/x1.png)
|
|
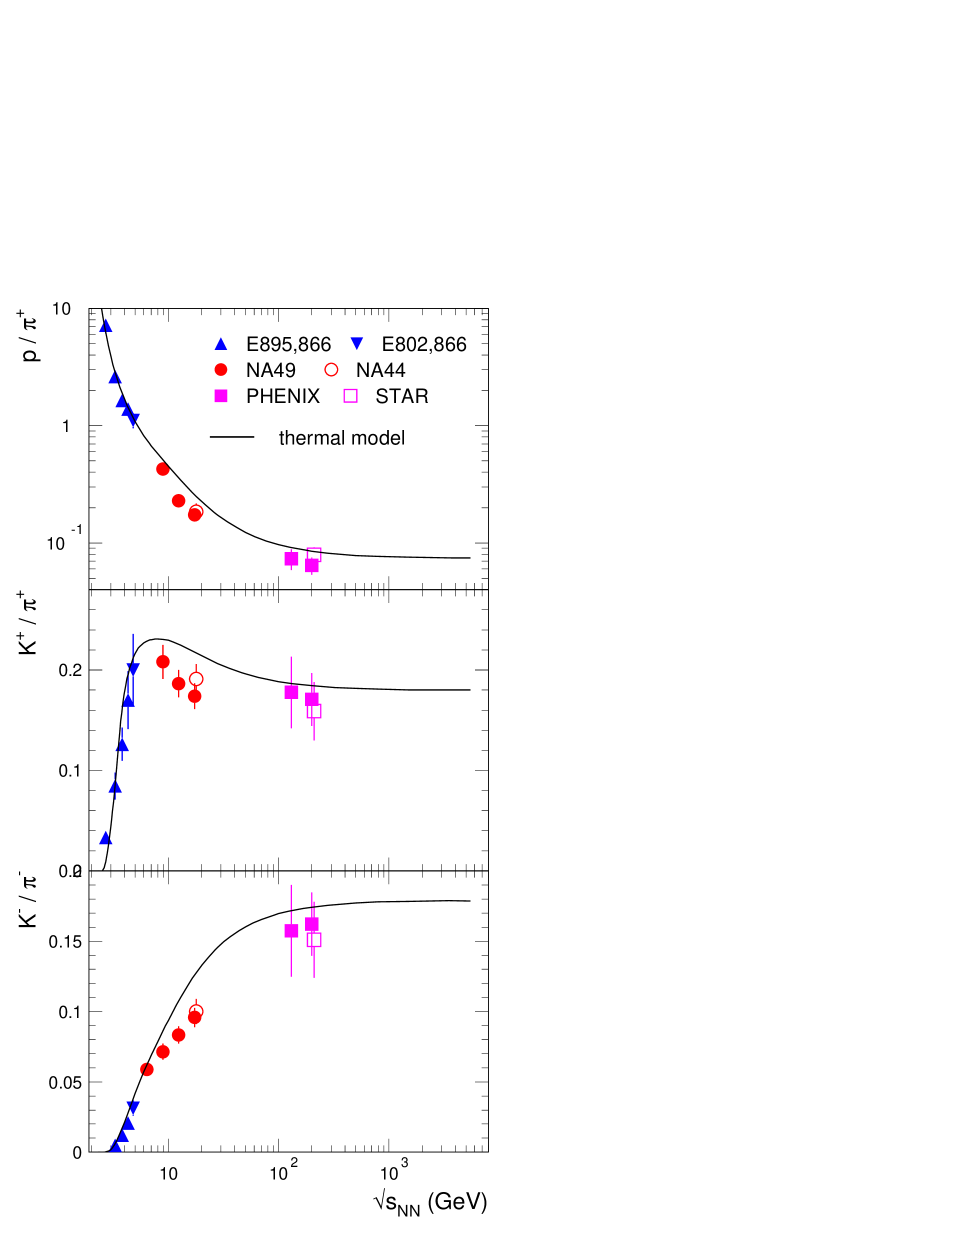
It is important to emphasize that experimental data on hadron yields are now available over a broad collision energy range and for a large sample of hadron species. A compilation of measurements of yields at mid-rapidity for the most abundant hadron species is shown in Fig. 1 for central nucleus-nucleus (Au-Au or Pb-Pb) collisions. As the centrality selection differs between various measurements, we have scaled the data at the same number of participating nucleons, =350. The contribution from feeding due to weak decays has been removed whenever the case (see Section 3). The main properties concerning the chemical composition of the fireball (at mid-rapidity) can be derived from the yields plotted in Fig. 1 without the need of any model. At lower energies (5 GeV), measured at Brookhaven’s Alternating Gradient Synchrotron (AGS), the fireball is dominated by the incoming nucleons, while the yield of the produced pions, with a strong energy dependence, dominates at larger energies. The importance of isospin at lower energies is reflected in the different yields of and . The decreasing yield of protons points to an increasing transparency of the incoming nuclei as a function of energy. Beyond 100 GeV, the newly produced protons become dominant. The yield of strange hadrons shows a sharp rise at AGS energies, with characteristic features for various species, determined by their quark content. The yields of and (both with only the strange quark newly produced) are larger compared to , which has two newly produced quarks. The remarkable similarity of the yields of and , despite their large mass difference, is determined chiefly by their (anti)strange quark content, leading to their associated production, and less by the abundant presence of light quarks from stopped incoming nucleons. The yield of antiprotons and antihyperons (containing three newly produced quarks) is very similar and with a strong energy dependence (onset of production) at energies of CERN’s Super Proton Synchrotron (SPS). At the Relativistic Heavy Ion Collider (RHIC), due to a rather small net baryon content of the fireball, these differences almost disappear. The data are further discussed in Section 3 in comparison with thermal model calculations. We notice here that, in general, there is good consistency between overlapping data sets measured by different experiments. One exception are the hyperon yields at SPS energies, illustrated for hyperons in Fig. 1.
In view of these considerations it is important to assess with precision potential uncertainties in the extraction of thermal parameters with a consistent, 2nd generation, analysis of all available experimental data over a broad range of collision energies (=2.7-200 GeV). This includes a comparison of the results from fits of hadron yield ratios and from absolute yields and a discussion on the influence of systematic errors on the fit parameters. The next section contains a brief description of the model. In Section 3 we perform fits of model calculations to the data. We discuss the energy dependence of the resulting and parameters, along with a critical assessment of various sources of uncertainties, in Section 4. Section 5 is devoted to the comparison of model and data in terms of excitation functions of various hadron yield ratios, which we extend up to the LHC energy. The relation of the extracted parameters with the predicted QCD phase boundary, calculated solving QCD on the lattice [12, 13, 14], is discussed in Section 6. The Appendix contains a discussion of more technical aspects in the fit procedures.
2 Model description
We restrict ourselves here to the basic features and essential results of the statistical model approach. A complete survey of the assumptions and results, as well as of the relevant references, is available in ref. [1].
The basic quantity required to compute the thermal composition of hadron yields measured in heavy ion collisions is the partition function . In the grand canonical (GC) ensemble, the partition function for species is ():
| (1) |
from which the density is then calculated according to:
| (2) |
where is the spin degeneracy factor, is the temperature and is the total energy. The (+) sign is for fermions and (–) is for bosons. For hadron of baryon number , third component of the isospin , strangeness , and charmness , the chemical potential is . The chemical potentials related to baryon number (), isospin (), strangeness () and charm () ensure the conservation (on average) of the respective quantum numbers: i) baryon number: ; ii) isospin: ; iii) strangeness: ; iv) charm: . The (net) baryon number and the total isospin of the system are input values which need to be specified according to the colliding nuclei studied. The degree of stopping of the colliding nuclei, which is energy dependent and cannot be precisely determined experimentally, brings some uncertainty in the choice of and . In our case, as we study central collisions of heavy nuclei (Au or Pb), but focus on data at mid-rapidity, we have chosen =200 and =-20. The sensitivity of the hadron ratios, which are the calculated ”observables” to be compared with the experimental data, on and is rather small. Taking into account the conservation laws i)-iv), and the baryo-chemical potential are the only parameters of the model, which will be obtained from fits to experimental data. When fitting hadron yields rather than ratios of yields, the fireball volume appears as additional parameter. We discuss its physical significance in Section 4 and in the Appendix.
We want to emphasize that our model does not contain any strangeness suppression factor, , as used e.g. in ref. [20, 21]. Whenever is used in thermal model calculations111We recall that the usage of implies that the thermal density of any given hadron carrying strangeness has a ”suppression” factor for every strange or antistrange quark., it is meant to account for non-equilibration in the strangeness sector. Departure from equilibrium is expected for elementary collisions or for peripheral nucleus-nucleus collisions (as well as for light nuclei). The introduction of a factor is an attempt to model this situation (see e.g. [27, 20]). It is established that for central collisions at RHIC [8, 9]. At the lower end of the energy range, namely at SIS energies (up to 2 AGeV), there are indications [3] that is not needed either. As we investigate central Au-Au or Pb-Pb collisions we prefer to stay within the thermodynamically well defined equilibrium model. Nevertheless we investigate, in the Appendix, the influence on our results as well as the statistical significance of the introduction of into the fit procedure. This leads to the conclusion that our main results, i.e. the determination of and from fits of ratios of yields at mid-rapidity, are little changed by this additional fit parameter.
The following hadrons are included in the calculations: i) mesons: non-strange (37), strange (28), charm (15), bottom (16); ii) baryons: non-strange (30), strange (33), charm (10); iii) ”composites” (nuclei up to 4He and -clusters [28], 18). The corresponding anti-particles are of course also included. Their characteristics, including a rather complete set of decay channels, (all strong decays and a suitable fraction of the weak decays contribution matching the experimental conditions) are implemented according to the most recent PDG compilation [29]. Studies of QCD thermodynamics using lattice results have demonstrated that the partition function of a hadron and resonance gas model, which is a sum over all individual partition functions (Eq. 1), describes the lattice QCD data after suitably rescaling hadron masses to match lattice QCD [30].
We have used vacuum masses for all hadrons. The effect of hadron mass (and width) modification was analyzed in the context of the thermal model for the top SPS energy in ref. [31]. The conclusion is that at SPS a 10% reduction of masses leads to a slightly better thermal fit, with a corresponding 10% reduction of the resulting and , A thermal analysis of the RHIC data using hadron masses derived from chiral models [32] found no preference for any scenario of in-medium masses compared to the non-interacting gas model. Note that at AGS (Si+Au) the nominal masses are preferred [1]. It was argued [33, 34] that changes of masses in-medium in connection to chiral symmetry restoration can lead to larger values of the chemical potentials at lower energies.
The finite widths of resonances are taken into account in the density calculation by an additional integration, over the particle mass, with a Breit-Wigner distribution as a weight:
| (3) |
where is the nominal mass and is the width of particle . The energy is then calculated for every value of in the integration step, . Here, is the normalization of the Breit-Wigner distribution and is the threshold for the dominant decay channel. As this procedure significantly increases the computing time, for the fits it was used only for the AGS energies (see below), where in particular the widths of nucleon resonances are expected to play a significant role [35]. At higher energies the width of the resonances plays little role in the determination of the thermal parameters.
The interaction of hadrons and resonances is usually included by implementing a hard core repulsion of Van der Waals–type via an excluded volume correction. This is implemented in an iterative procedure according to ref. [36, 37]:
| (4) |
where is calculated for a radius of 0.3 fm, considered identical for all hadrons [5]. This correction influences the particle densities, but has little (5%) effect on ratios. The effect on absolute densities is very significant, however: at top SPS energies and above the excluded volume procedure leads to a reduction in densities by about a factor of 2, leading to a corrspondingly larger volume at chemical freeze-out.
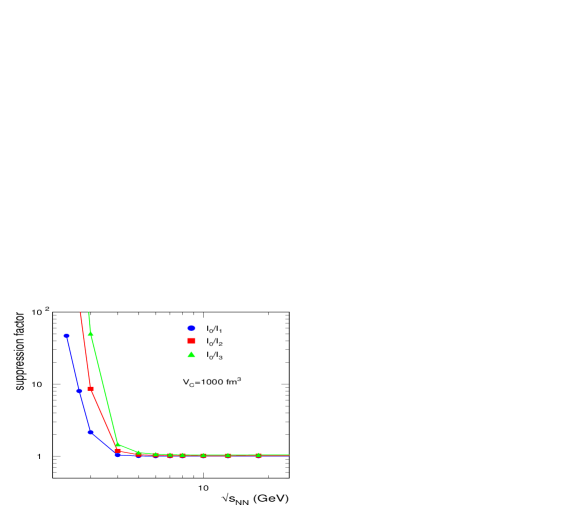
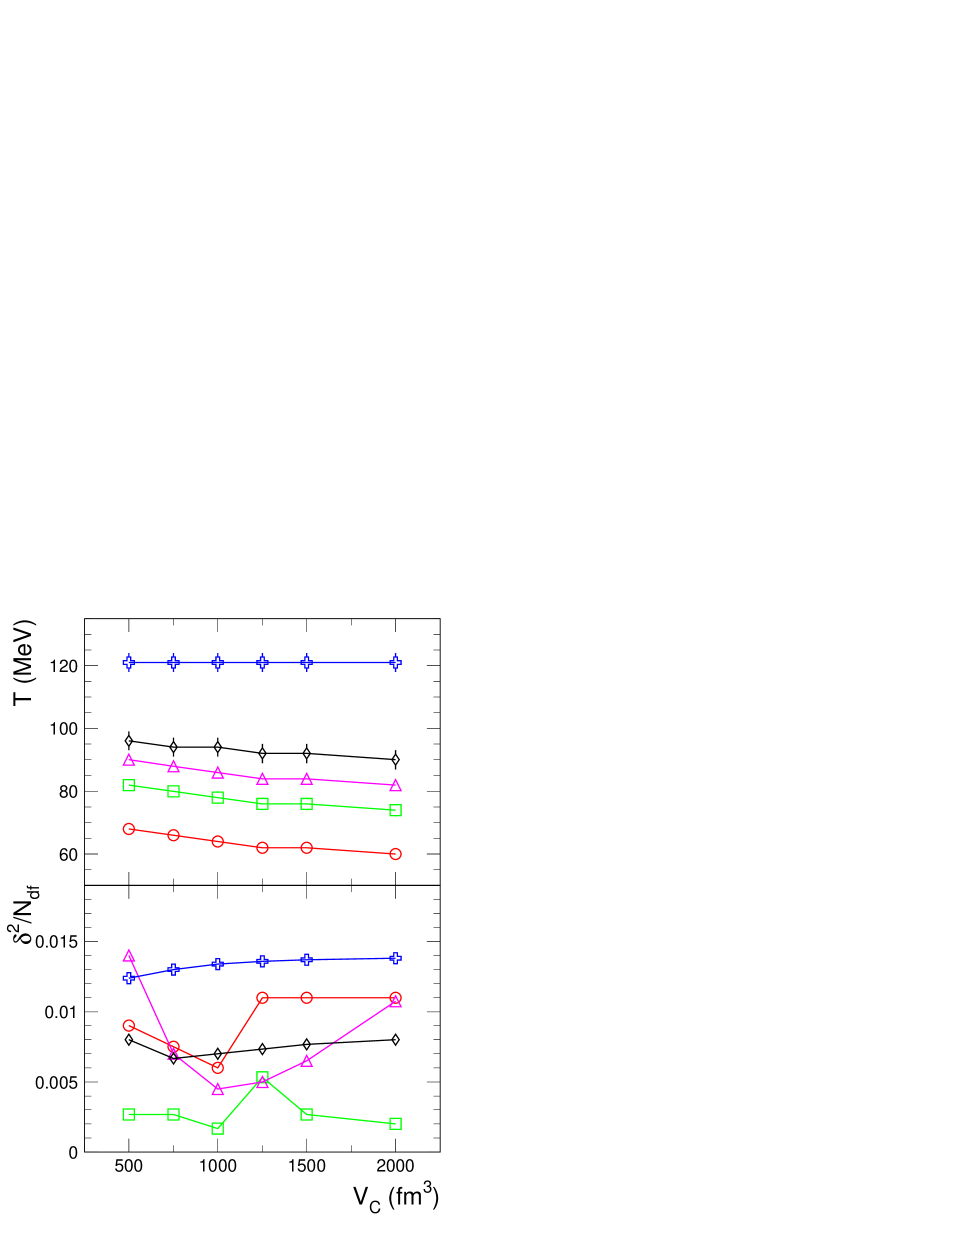
The grand canonical ensemble is the simplest realization of a statistical approach and is suited for systems with a large number of produced hadrons. However, for small systems (or peripheral nucleus-nucleus collisions) and for low energies in case of strangeness production, a canonical ensemble (C) treatment is mandatory [38]. It leads to a phase space reduction for particle production (so-called “canonical suppression”). It has been shown [39, 1] that the density of particle with strangeness calculated in the canonical approach, , is with a good approximation related to the grand canonical value, , as: , with . The argument of the Bessel function of order is the total yield of strange and antistrange hadrons. The suppression factor is shown in Fig. 2 for a canonical volume =1000 fm3, which we employ in our calculations (see next section). In this case, the canonical suppression is negligible for all strange hadron species already for the highest AGS energy (5 GeV) but is sizeable for the lower energies. Whenever the canonical suppression is needed, , becomes another parameter of the model and needs to be evaluated carefully (see below).
3 Fits to experimental data
To extract the parameters of the model we perform fits of the experimental data with model calculations. In order to employ a minimal number of model parameters, namely and , the temperature and the baryonic chemical potential at chemical freeze-out (ceasing of inelastic collisions), a common practice is to fit hadron yield ratios [1, 7, 8, 9]. It is important to recognize that one is faced with a choice when selecting statistically independent ratios from the total number of ratios which can be constructed from experimentally measured hadron yields. Although the number of independent hadron yields is typically rather large (10) one may argue that fitting a particular choice of (statistically independent) particle ratios may introduce a bias for the extracted and whenever a given experimental yield used in several ratios is subject to a systematic error . To minimize such a possible bias, we use ratios constructed from all measured hadron species avoiding, as much as possible, the repetition of any particular yield. Another possibility is to fit the measured hadron yields [20, 21], which implies an extra parameter, the fireball volume. This method is free of the bias discussed above, but is subject of another bias, arising, for instance, whenever two measured yields (i.e. of a particle and its antiparticle) have a similar systematic error, which is cancelled in the ratio. Also, ratios typically have a smaller systematic error than absolute yields. Based on this, our main analysis focusses on ratios of hadron yields. As mentioned in Section 4 and demonstrated in detail in the Appendix, the difference of fit parameters resulting from the two different fit procedures is always smaller than the uncertainty in the overall method, given the current status of measured yields and corresponding errors.
We briefly discuss below the fit procedures. The best fit is obtained by minimizing the distribution of . To get an estimate of the systematic error of the fits, we additionally consider the quadratic deviation, . The two quantities are defined as:
| (5) |
where is the measured value of either the yield or the ratio of hadron yields222We denote a yield ratio of two particles by the ratio of their respective symbols. with its uncertainty and is the value from the model calculations. For the experimental errors we have quadratically added the statistical and the systematic errors of the measured yields. When the systematic errors of the measurements were not available we have assigned values of 10%, unless otherwise stated. The sum runs over the number of hadron ratios available experimentally. We focus on central collisions of Au or Pb nuclei. Ratios are calculated from the measured hadron yields. Whenever needed, we scale the measured yields with the number of participants [43] to account for different centrality classes.
We focus on mid-rapidity data (), for which the bulk of the published hadron yields is available, but we also analyze data integrated over the full solid angle whenever available. While at low energies the consideration of hadron yields integrated over 4 is optimal, this changes as, with increasing beam energy, the nuclei become transparent and, besides a central fireball, fragmentation regions develop. Once the stopping is not complete, necessarily the baryo-chemical potential depends on rapidity and a consideration of 4 data with one value of would not be appropriate. In that case the statistical model should be compared to data over a central region near mid-rapidity. One may consider in separate analyses more forward or backward fireballs with different parameters. The possible presence of a finite net strangeness at mid-rapidity, as suggested by a recent transport model calculation [44], could pose a special difficulty; this is not accounted for in our model. However, the effect is expected to be small enough to not cause a systematic bias of the extracted thermal parameters.
An important aspect in the comparison of calculations with measurements is the contribution of feed-down from weak decays, mainly in the yields of pions and (anti)protons. In our model, the fraction of those hadrons originating from weak decays is adjusted. In general, this contribution is subtracted in the experiments, either explicitly (via simulations) or implicitly (due to specific reconstruction methods). We have tried to model in detail the contributions from weak decays, following the information in the relevant experimental papers. In the Appendix we demonstrate the importance to determine as precisely as possible the size of this contribution.
3.1 AGS
At the AGS, collisions of Au nuclei at beam kinetic energies of 2 to 10.7 AGeV, corresponding to =2.70-4.85 GeV were studied. For the beam energies of 2, 4, 6, and 8 AGeV, the yields of protons [45, 46], pions [47, 48] and kaons [48] are available (there are no data at 2 AGeV). The yields are only available integrated over 4 [49] and for the energy of 6 AGeV the integrated yield was also measured [50]. In these cases we have derived the mid-rapidity values assuming the same ratio between 4 and as for protons [45].
|
|
|---|---|
|
|
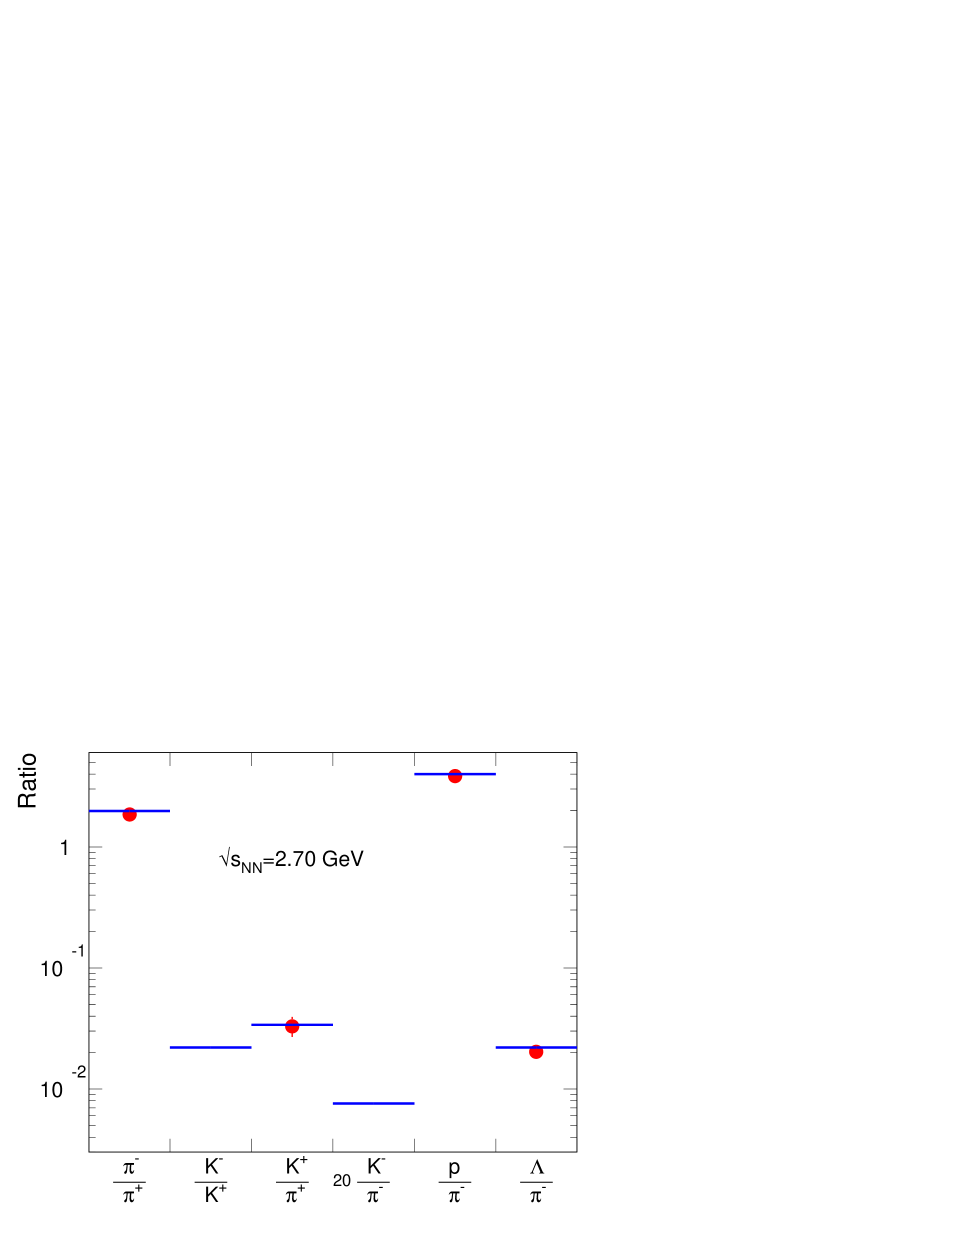
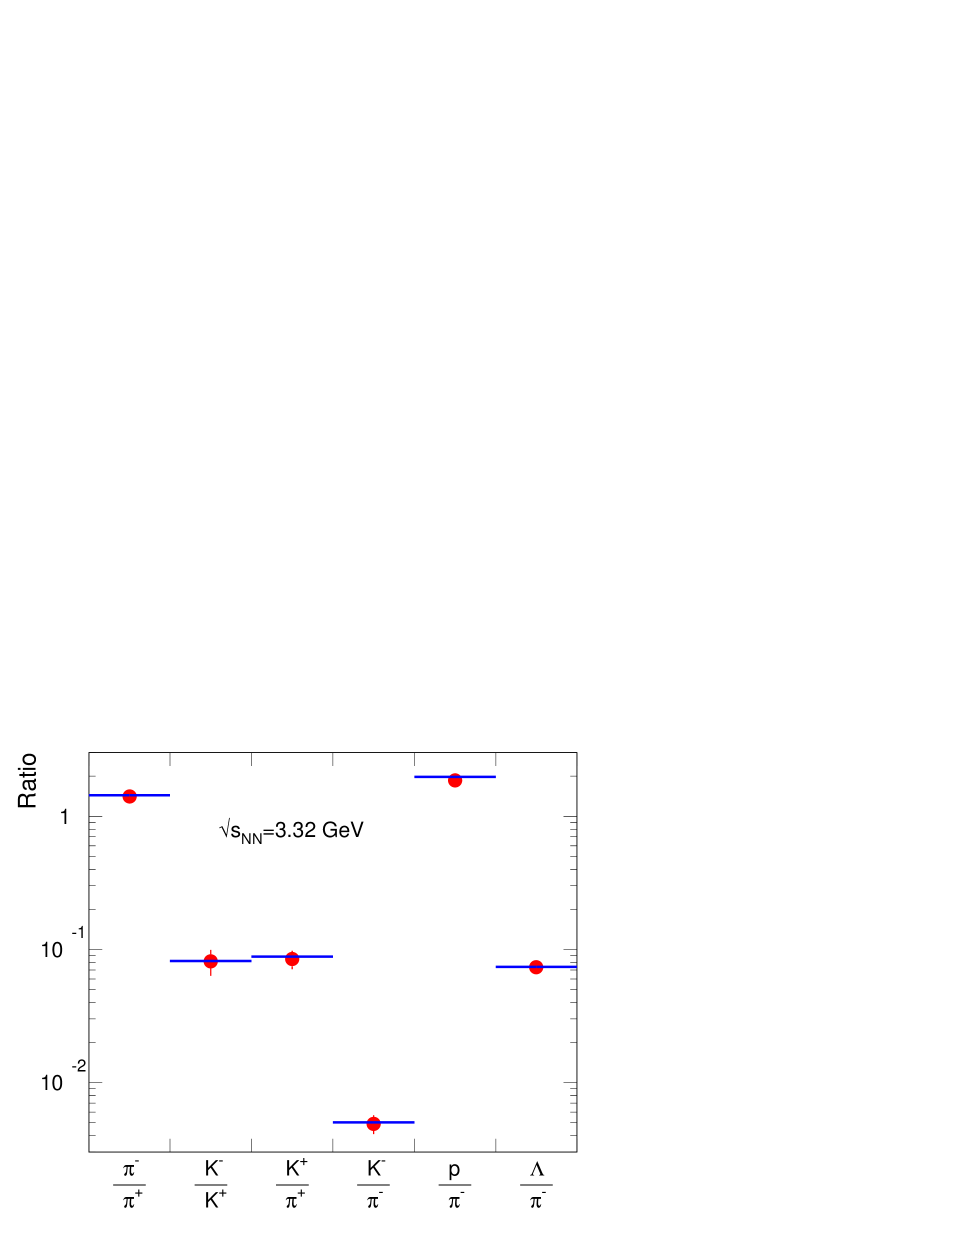
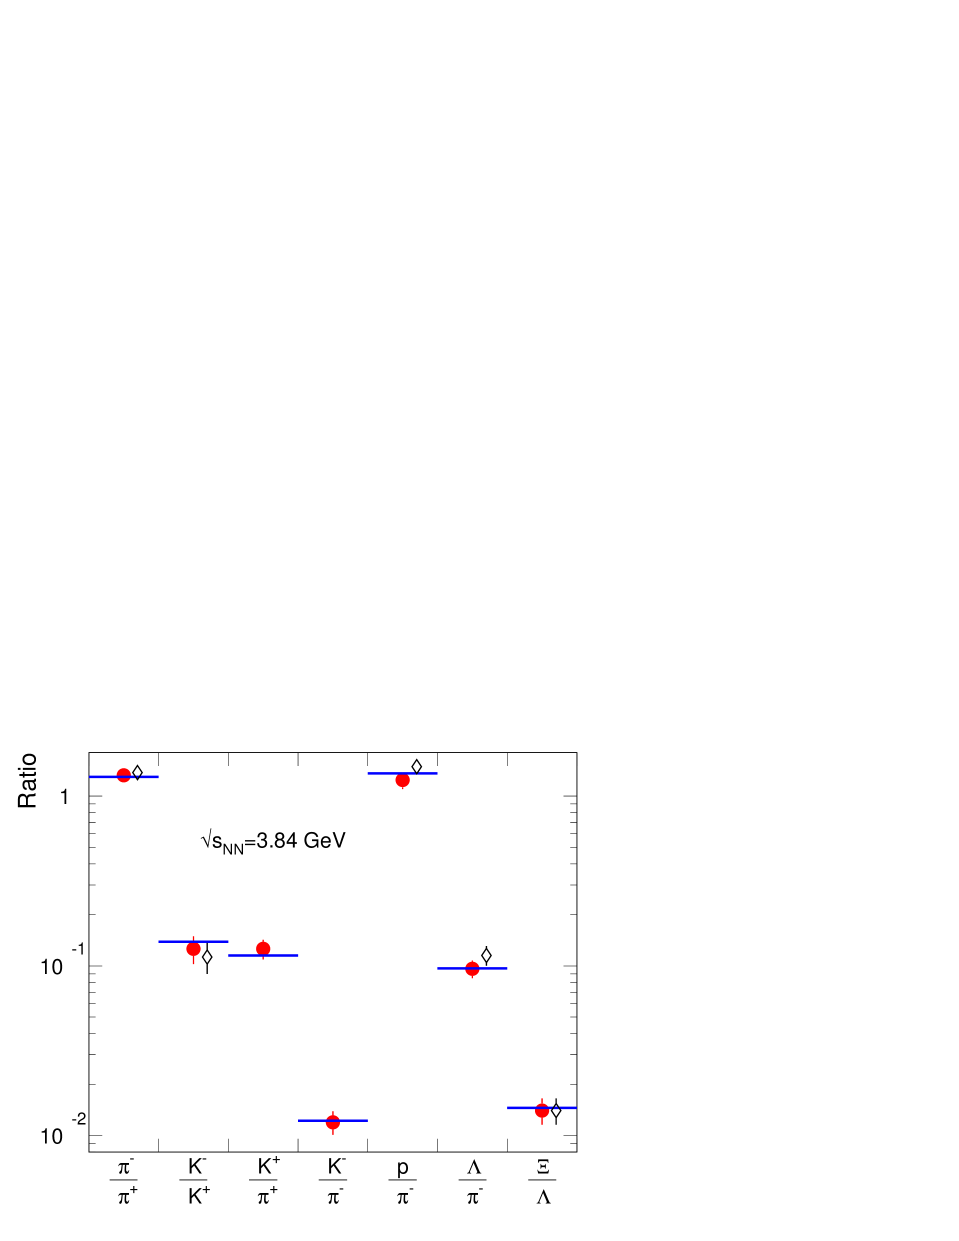
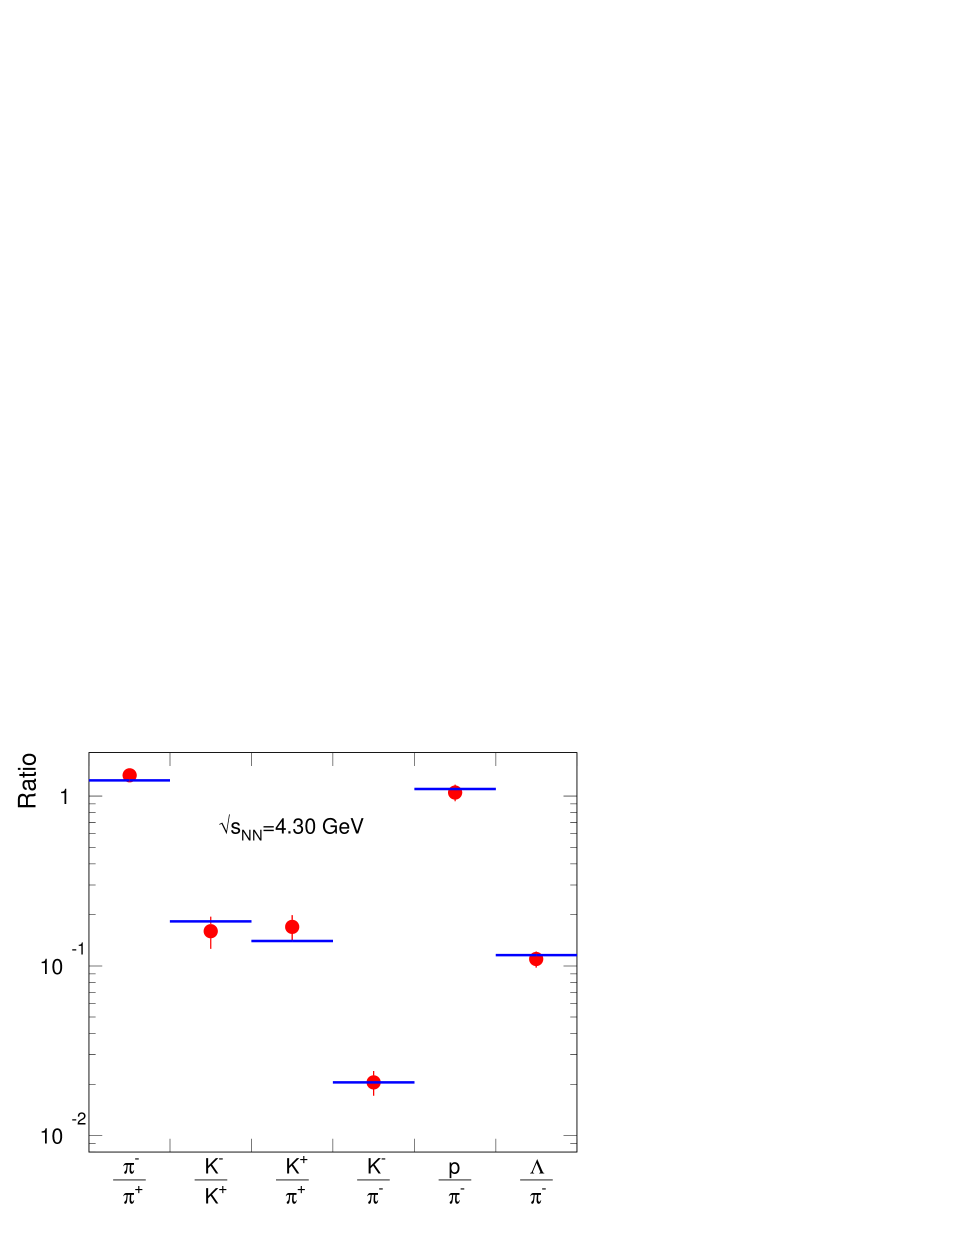
The comparison of the measured and calculated ratios for the best fit ( minimization) is presented in Fig. 3 for the four energies. Here and in the following plots we show both the and the ratios, but in the fit either one or the other is included (as only one is statistically independent from the ratios and ), depending on the minimum value of . The resulting values of and are between 64 and 93 MeV and 760 and 580 MeV, respectively. The model describes the data very well; the values per number of degrees of freedom, are 1.0/2, 0.43/3, 1.15/4, 1.14/3 for 2, 4, 6, and 8 AGeV, respectively. Although this could be accidental, as the number of data points in the fits is very small, these low values could imply that the systematic errors of the measurements are actually overestimated. We mention that if we do not include in the calculations the finite widths of resonances the corresponding values of are slightly worse, but the values of and change only marginally. For both cases, the distributions are narrow around the minimum and there is no correlation between and as is observed for higher energies (see below). In some cases, close-by minima are identified and we have included this feature into the errors of the parameters.
|
|
|
|
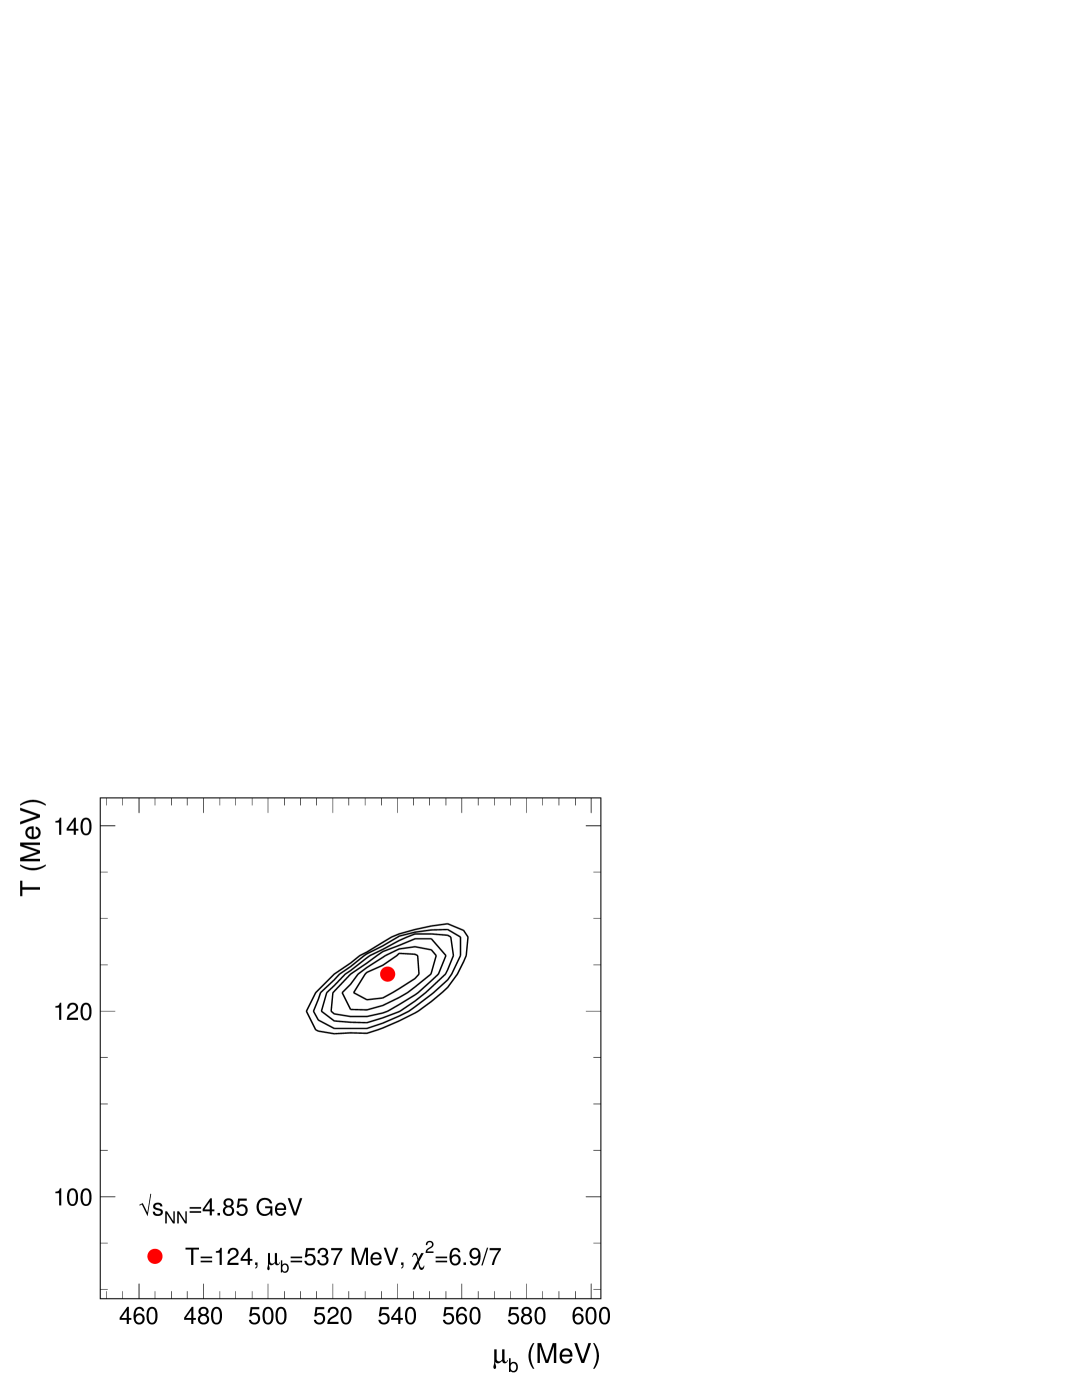
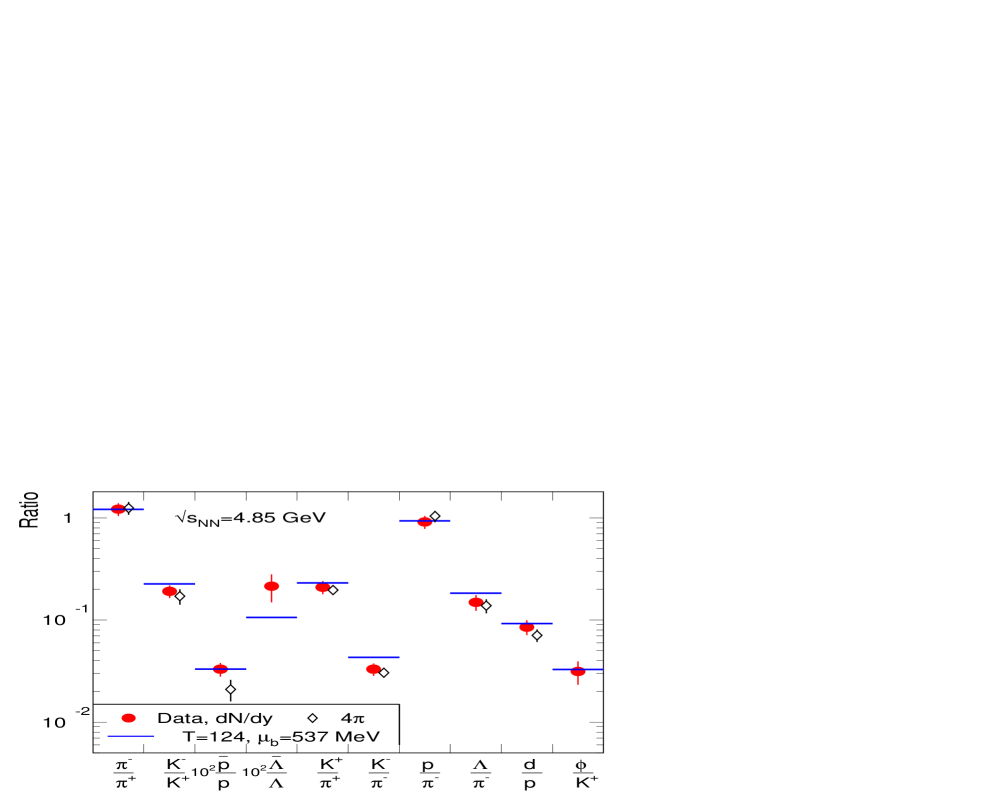
At the top AGS beam kinetic energy of 10.7 AGeV (=4.85 GeV) there is a large set of hadron yields experimentally available: [51, 52, 46], [52], [51, 48], [48, 53], [54], [55], [56]. The thermal fit to the data yields MeV and MeV, corresponding to a minimum of =6.9/7 (the errors correspond to 1 ). The model fits the data very well, as evident from the narrow distribution and from the comparison of the ratios shown in Fig. 4. Not included in the fit is the ratio ,which is not statistically independent from the ratios already included in the fit. The ratio deviates from the model calculations substantially ( ”anomaly” [56]). The experimental is a factor of 2 higher than the model value and as such has a significant contribution to the (if is not included in the fit, the resulting values are: MeV, MeV, =4.0/6).
The fit without the ratios , , , and gives , MeV, with =1.3/3. We note that, in this case, and are not anymore correlated (as seen in Fig. 4), but rather loosely anticorrelated. We have performed this fit to test a possible bias in the extracted thermal parameters at the lower energies due to the smaller number of ratios experimentally available. We estimate in this way that the extracted temperature can be biased by up to 15%, while for the bias can be up to 3%. These systematic (upper limits) errors are used in the following.
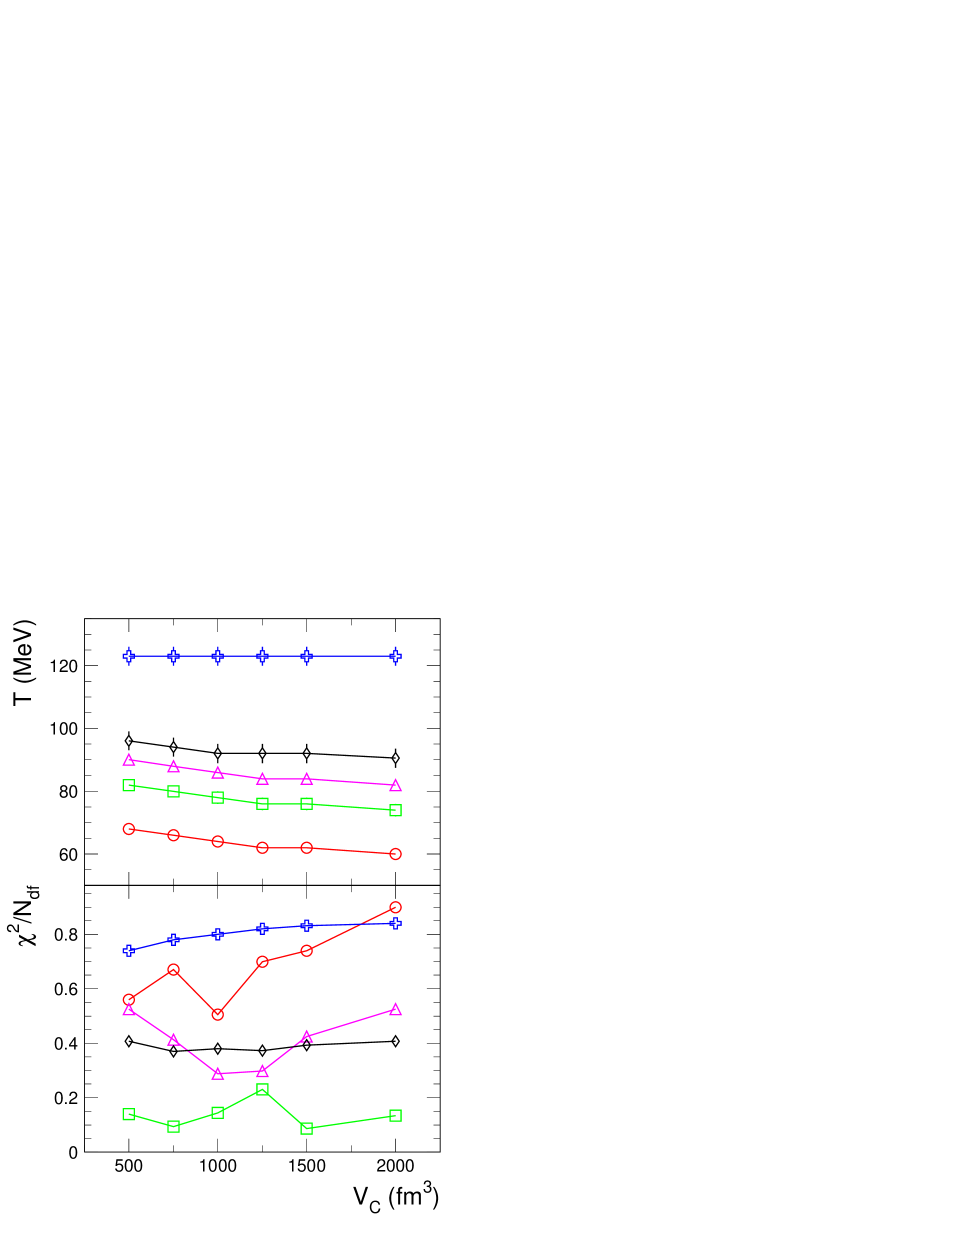
To investigate the sensitivity of the extracted (,) values on the canonical volume (which enters via the canonical suppression factor), we have performed the fits for all AGS energies for a range of values. The results are presented in Fig. 5, where we show the dependence of on the canonical volume parameter for two cases: minimizing and . Both cases result in very similar freeze-out temperatures. As expected, slightly grows with decreasing . The effect is gradually reduced towards higher energies and totally vanishes at the top AGS energy. Based on the dependence of and on (also shown in Fig. 5) one cannot constrain the canonical volume parameter. As a consequence, and since the canonical volume dependence is a rather small effect, we have chosen the value =1000 fm3. We mention that is unaffected by the canonical volume choice.
3.2 SPS
At the CERN SPS Pb-Pb collisions are measured in fixed target experiments, with beam momenta (energies) of 20 to 158 AGeV (=6.27-17.3 GeV). For the time being only the data collected at 40, 80 and 158 AGeV are final. The mid-rapidity yields of pions, kaons and (anti)protons and deuterons [57, 58, 59, 60] are available for these energies. The yields of the complete set of strange (anti)hyperons [61, 62, 63, 64, 65] and of [66] are published for the top energy and at 40 AGeV. Since the deuteron yield is measured over a reduced range in momentum, we have decided to not include the deuterons in the fitting procedure for all the SPS energies, although the ratio will be shown in the following plots. Also shown in the plots are the ratios and , which are not included in the fits because they are not independent from the ratios and , respectively, which are used because they result in a better fit.
|
|
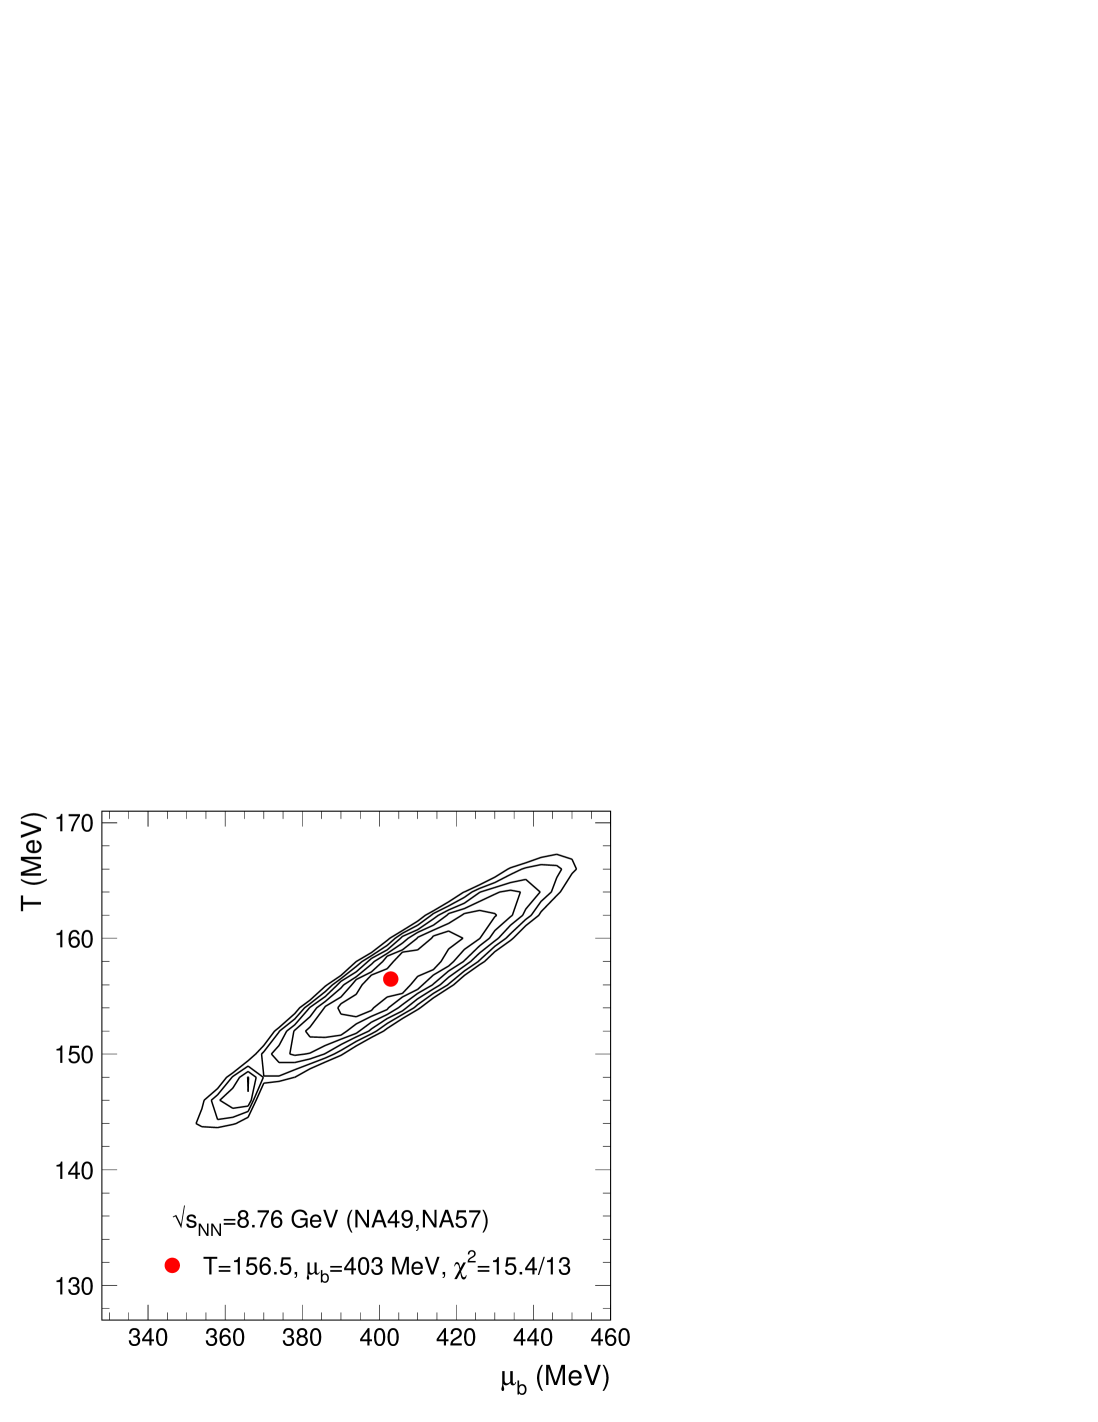
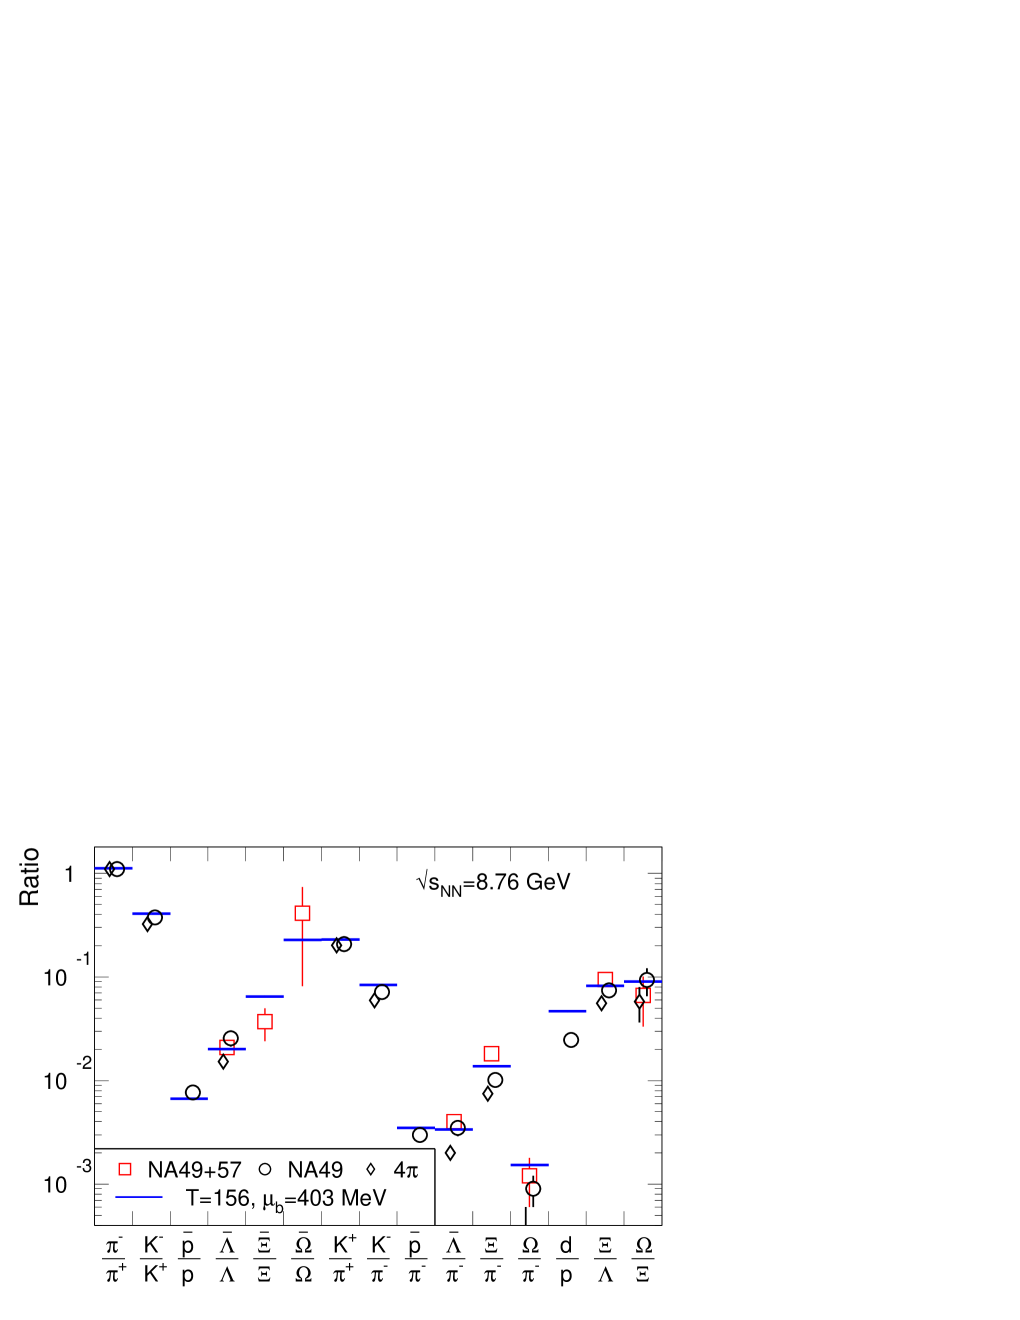
At the beam energy of 40 AGeV (=8.76 GeV), a combined fit to all data gives =156 MeV, =403 MeV, with =15.4/13 (from the quadratic deviation analysis, =166 MeV, =434 MeV, =0.58). The distribution and the comparison of the measured and calculated ratios for the best fit are shown in Fig. 6. A fit of NA49 data alone leads to =1662 MeV, =4387 MeV, with =6.2/7 (=162 MeV, =414 MeV, =0.10).
|
|
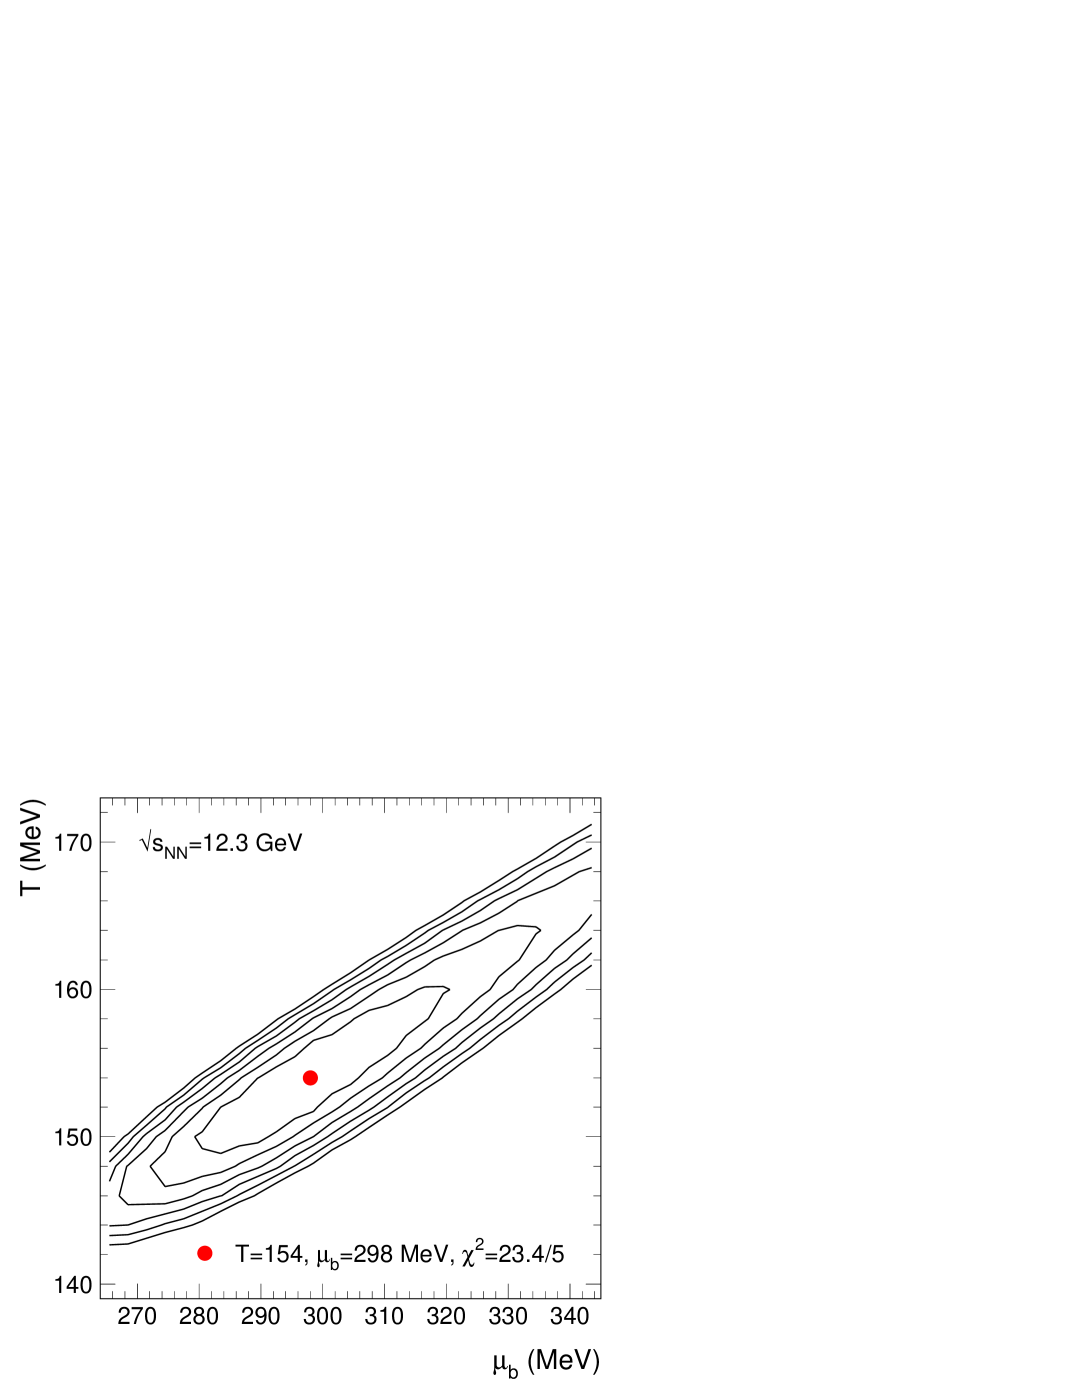
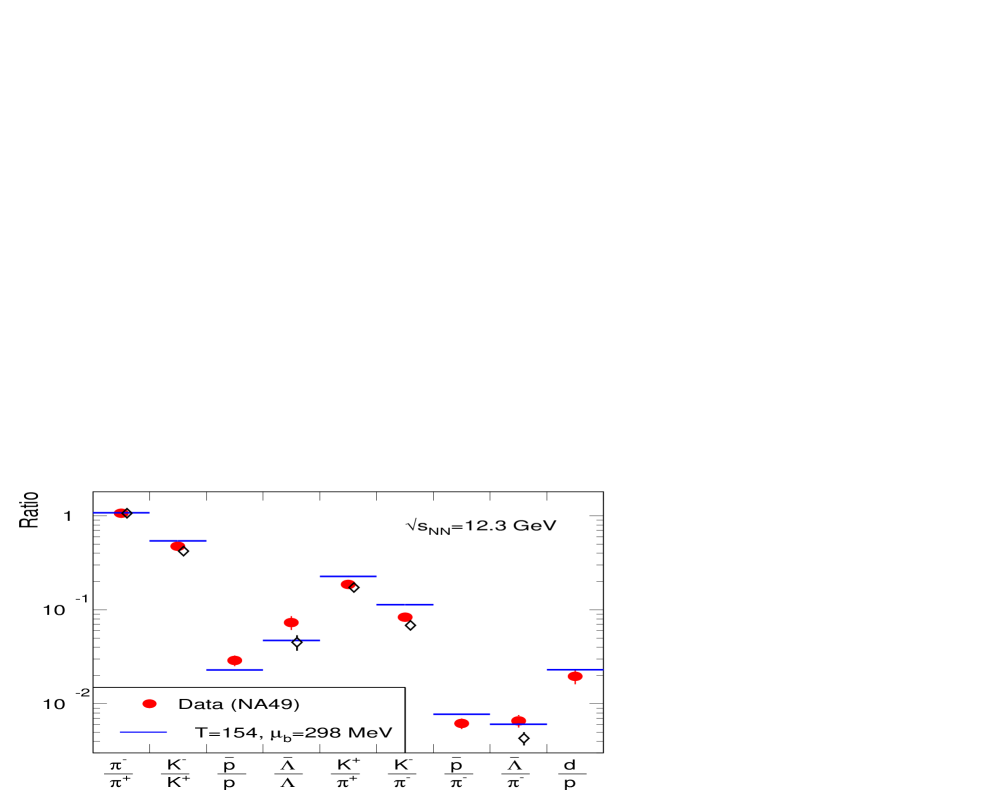
The distribution and the comparison of the measured and calculated ratios for the beam energy of 80 AGeV (=12.3 GeV) are shown in Fig. 7. The best fit is achieved for =154 MeV, =298 MeV, with 1 errors of 6 and 20 MeV, respectively (=152 MeV, =271 MeV, with minimum =0.23). The quality of the fit is not good, as seen from the value of =23.4/5. We have noticed that the outcome of the fit is sensitive to the inclusion of different (statistically equivalent) hadron ratios. For instance, if the ratios and are considered instead of and the resulting temperature from minimization is lower by about 10 MeV, while the temperature from minimization is unchanged. This shows the effect of the errors on the outcome of the minimization and indicates that the errors of the data are not entirely consistent. We have incorporated these results into the systematic errors of the thermal parameters.
For the top SPS energy of 158 AGeV (=17.3 GeV), there are mid-rapidity measurements available from the experiments NA49 [58, 59, 61, 62, 63], NA57 [64, 65] (hyperons and ) and NA44 [57] (, , ). Note that the NA44 pion yields are not explicitly corrected for the contribution from weak decays, but this is estimated to be small if one takes into account the reconstruction procedure in the NA44 spectrometer [67]. We have assumed an efficiency of reconstruction of 40% for pions from (considered the average yield of and measured by NA44) and of 20% from (considered the average of the NA57 and NA49 yields) decays. In this way, 5.9 and 7.8 () are estimated to originate from weak decays.
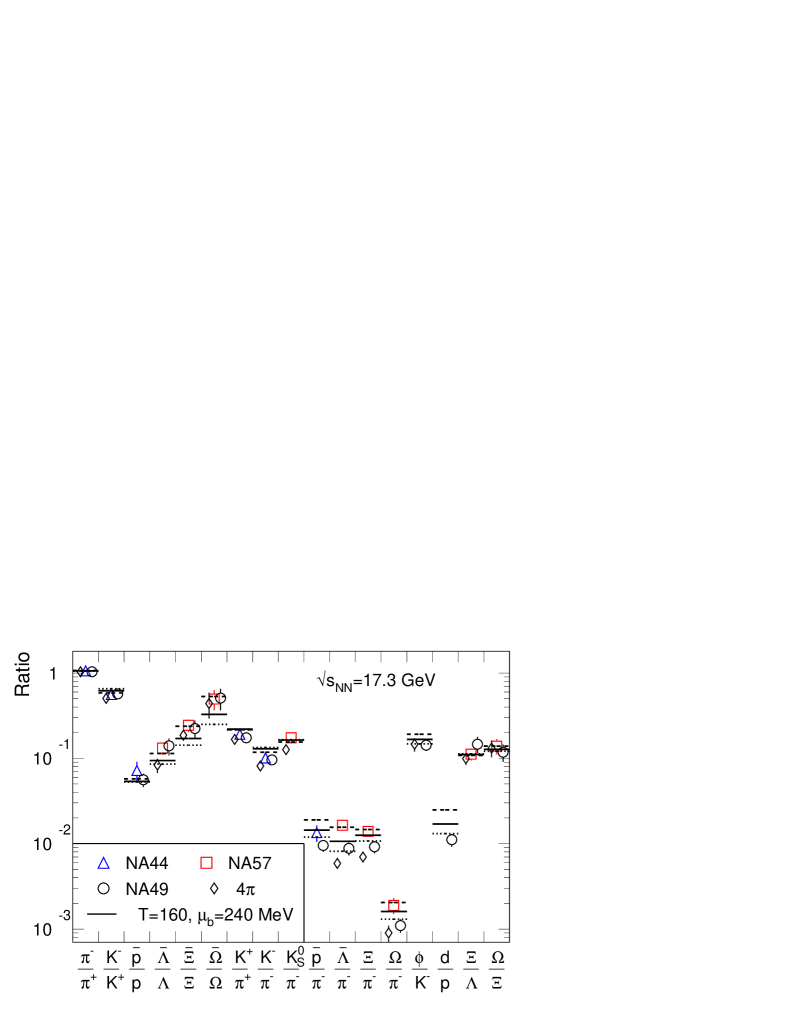
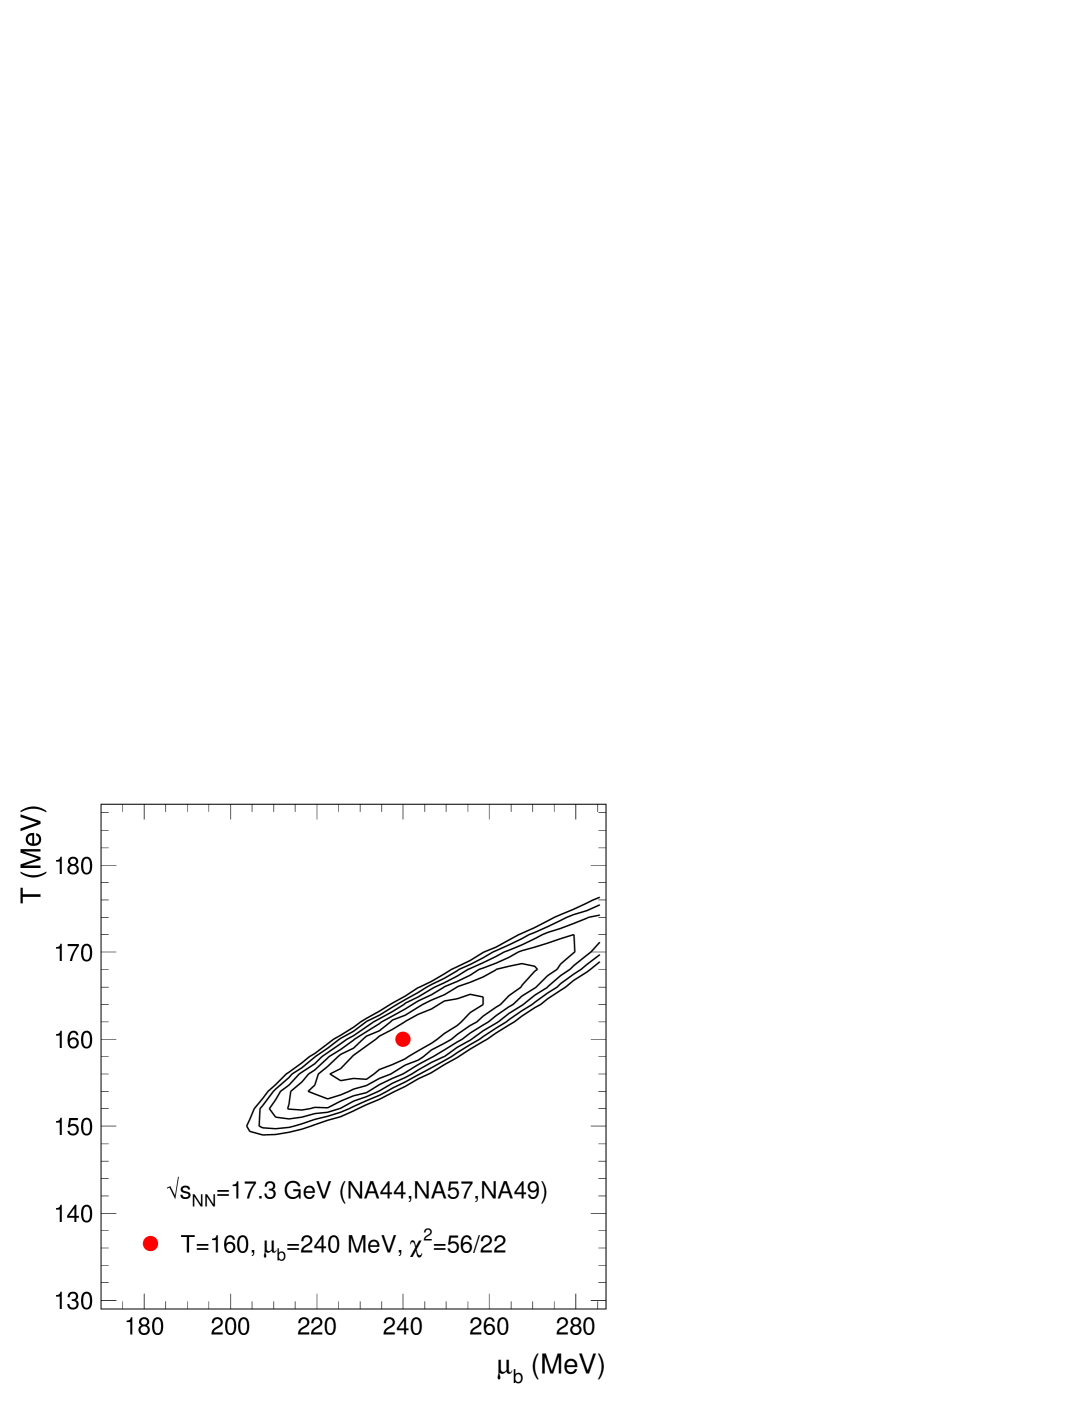
We have used in the fits the ratios and . This choice leads to better values of compared to the case when using the ratios and instead. The ratio was not included in the fits. The measured and calculated ratios for the best fit are shown in Fig. 8. A fit to all the combined NA49, NA57 and NA44 data gives MeV and MeV, with =56/22 (from the least square deviation minimization, =172 MeV, =243 MeV, =0.86). For instance, if the ratios and are considered instead of and , MeV and MeV, with =63/22 (=170 MeV, =237 MeV, =1.03).
|
|
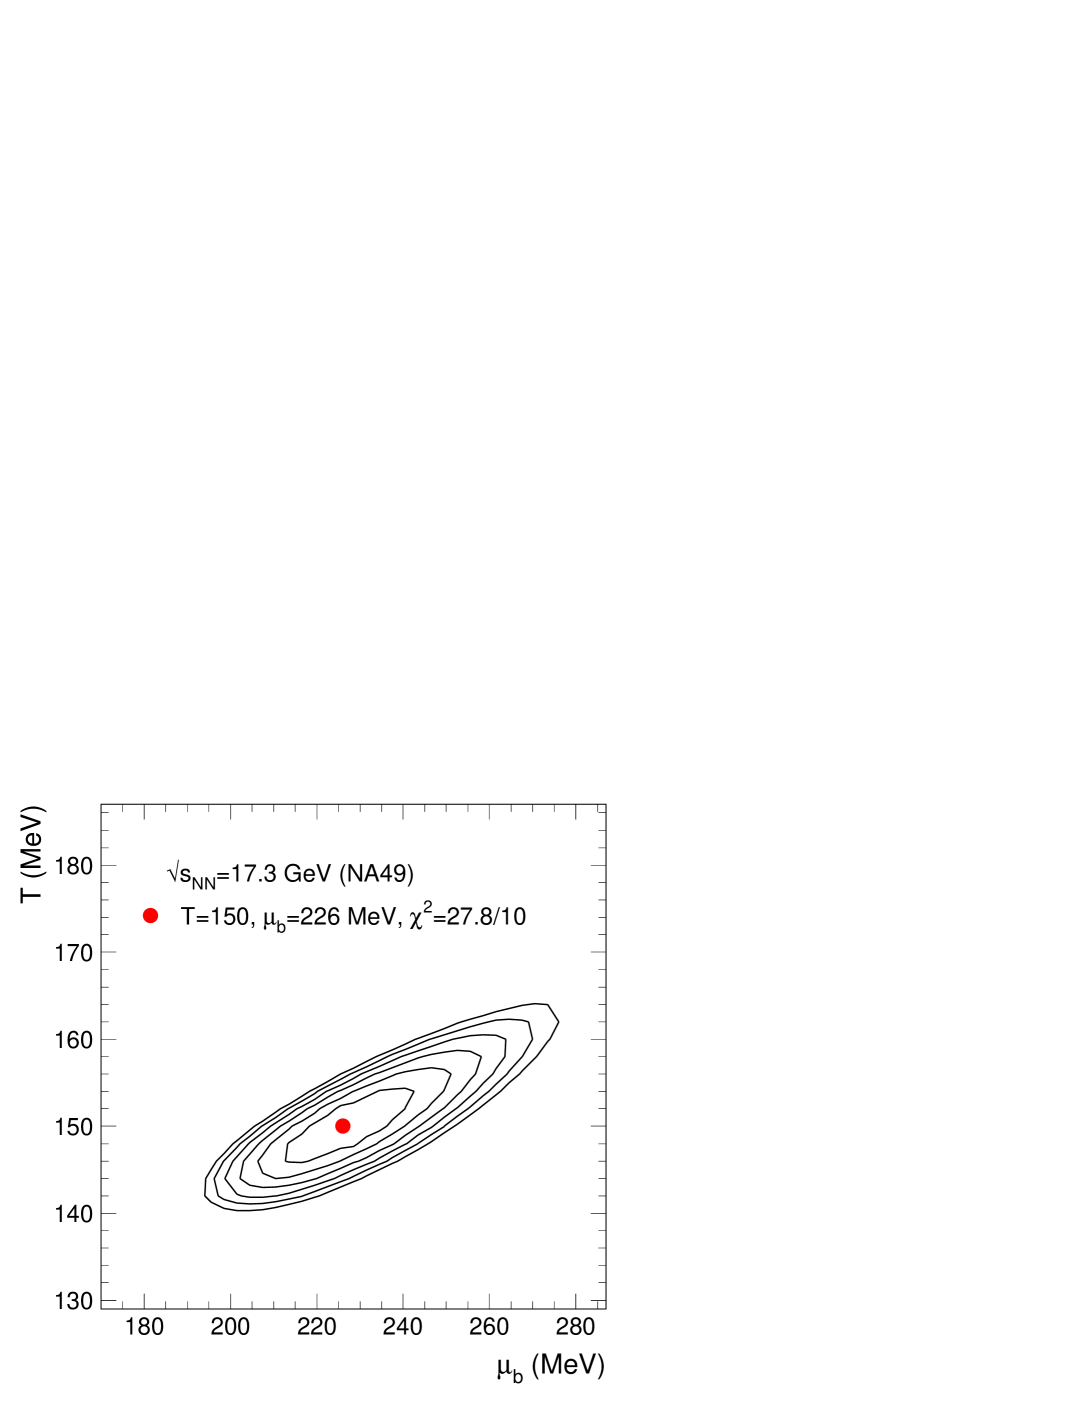
|
To investigate the contribution to these large values of ,
we have considered separatly two sets of hadron ratios:
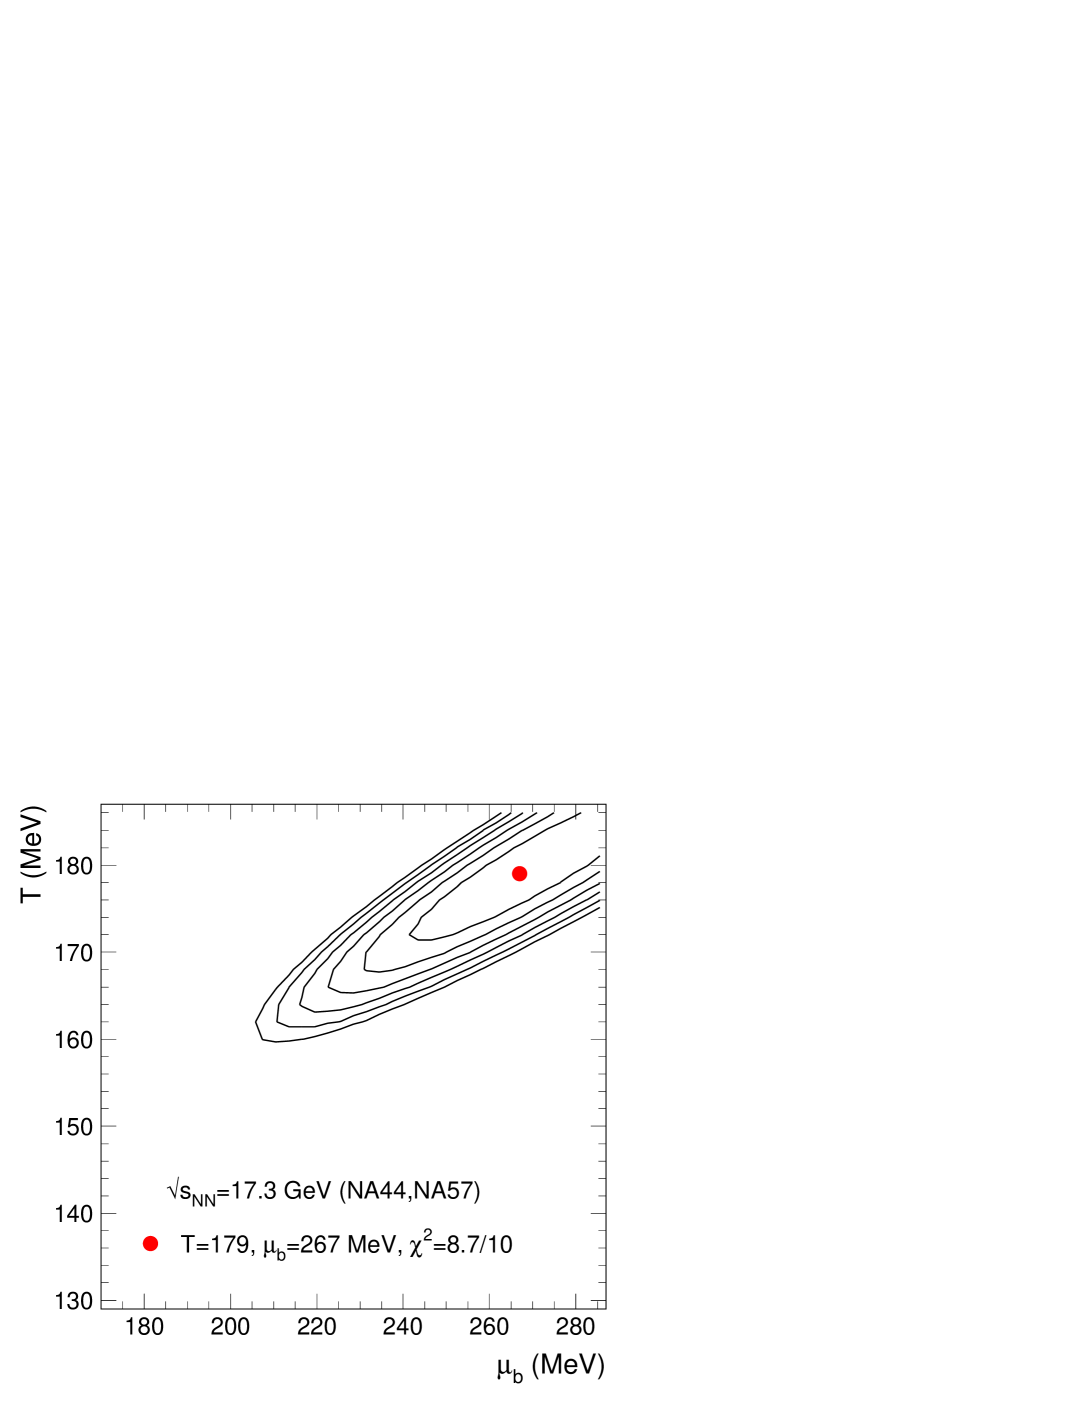
i) the combined NA57 and NA44 data333
In combining data from different experiments we neglect the possible
difference in centralities at the same quoted fraction of the inelastic
cross section which may arise from different centrality measures.
give MeV and MeV.
With =8.7/10, the fit quality is good.
ii) using the NA49 data we extract
MeV, MeV, with =27.8/10.
The fit quality is much worse compared to the NA57 and NA44 data set.
The contours for the combined fit and for the two separate data sets are shown in Fig. 9. The outcome of the fits is summarized in Table 1. While is compatible within the errors for all the three cases, the value of the temperature differs significantly, well beyond the errors, between the NA49 and the NA44+NA57 data sets. This discrepancy imposes large systematic errors for the extracted thermal parameters (see next section). Remarkably, the values extracted from the minimization are very similar for all three cases, 170 MeV, 240 MeV. This indicates that the outcome of the combined fit is driven by the NA49 data and in particular by their small errors. Although unsatisfactory thermal fits may signal a possible change in physics in connection to the critical (end)point of a first order phase transition from hadrons to QGP [68], the experimental situation just discussed allows unfortunately no conclusion on this issue. The apparent inconsistency of the results obtained using two independent data sets is not alleviated if one uses in the fit hadron yields instead of ratios. The results for this case (presented in Table 4 in the Appendix) show a similar pattern as in case of the fits using ratios. We note that poor quality of the fits at SPS energies characterizes other recent analyses within the thermal model [20, 69].
| data set | (MeV) | (MeV) | (MeV) | (MeV) | ||
|---|---|---|---|---|---|---|
| NA44+NA57 | 1797.5 | 26726 | 8.7/10 | 174 | 243 | 0.15 |
| NA49 | 1504.5 | 22615 | 27.8/10 | 168 | 240 | 0.66 |
| combined | 1605 | 24018 | 56/22 | 172 | 243 | 0.86 |
3.3 RHIC
|
|
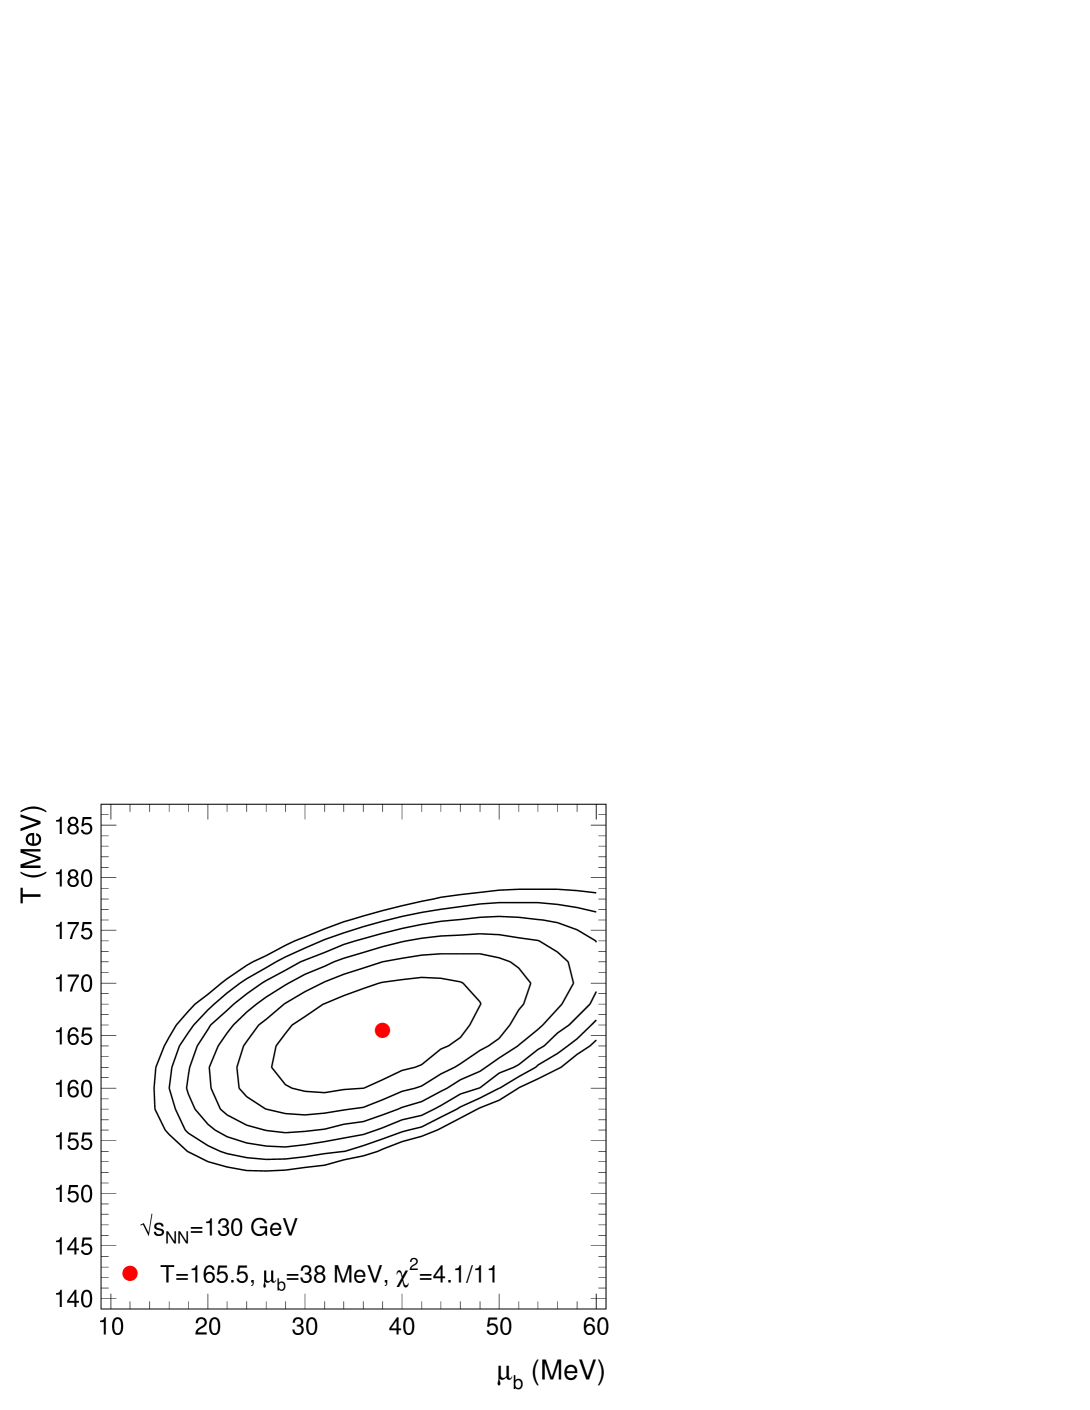
A complete set of final data for Au-Au collisions at RHIC is available
at =130 GeV.
We use for our analysis the yields of pions, kaons, (anti)protons [70]
and , [71]
measured by PHENIX, while for the other hadron species,
, [72, 73], [74],
[75], the data are from STAR.
Most of the available data are not corrected for feed-down from weak decays,
but these contributions are properly taken into account in the model
calculations.
One exception are the pions, for which the weak decay feed-down contribution
is not clearly specified by the experiment (PHENIX).We have considered three cases:
i) Assuming that all the pions from feed-down are included in the data,
the values of the thermal parameters are MeV and
MeV, with a minimum value of 3.6/11.
ii) At the other extreme, if one considers that the pion data do not contain
any contribution from weak decays, the resulting values are
MeV, MeV, =4.6/11.
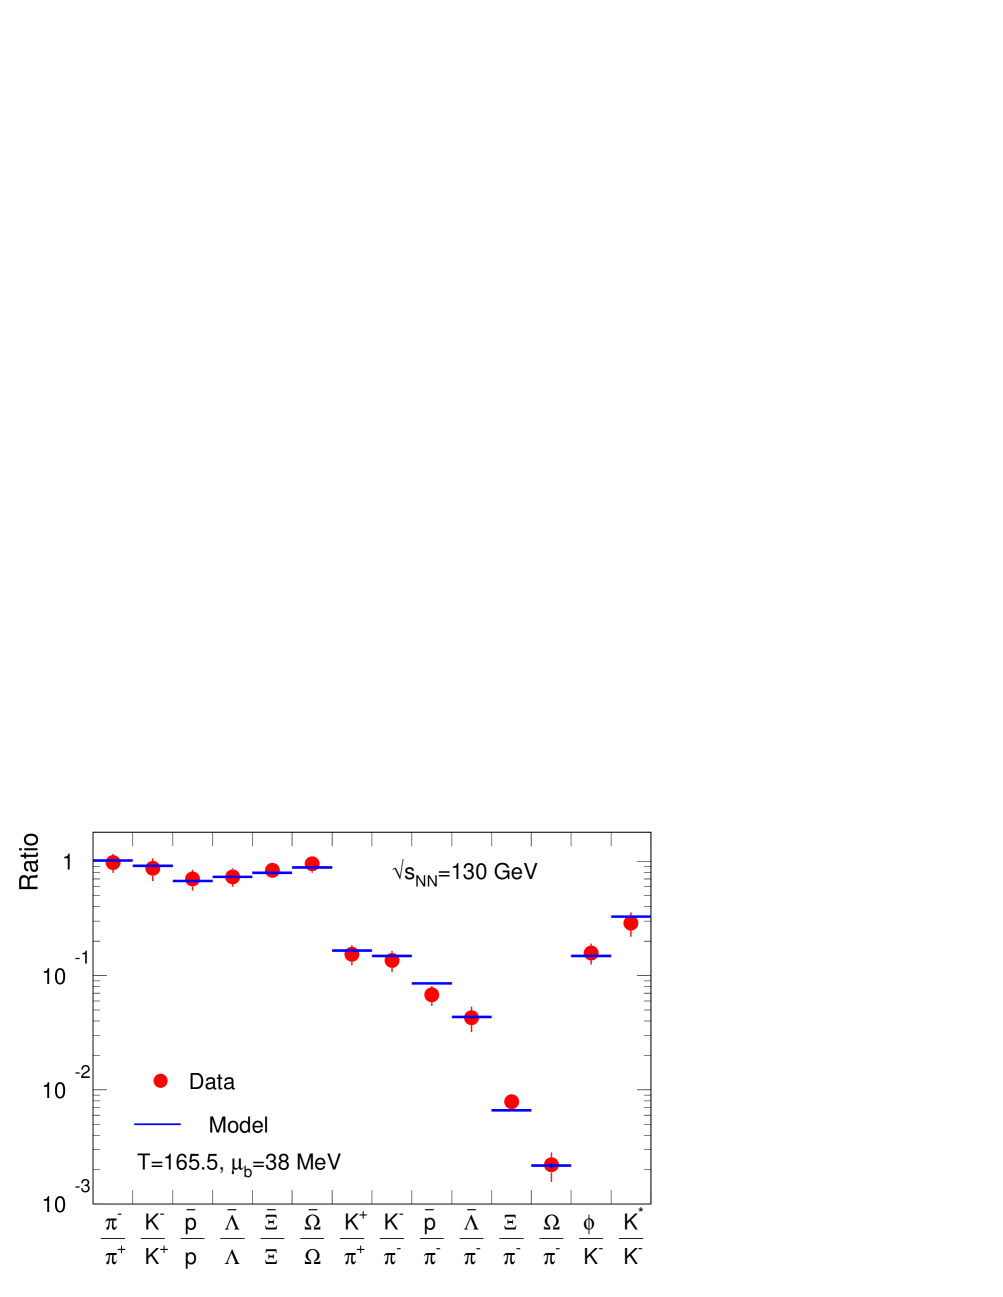
iii) Assuming that the data contain 30% of the pions from weak decays,
MeV, MeV, =4.1/11.
Although the fit is good for all cases (and even if the minimal is obtained for case i), we consider the intermediate case iii) as the most likely situation, as it could be an implicit result of the reconstruction in the experiment. The outcome of the fit is shown in Fig. 10. The very good fit is also apparent in the comparison of the hadron ratios: essentially all the experimental ratios are well reproduced by the model, including those involving and resonances.
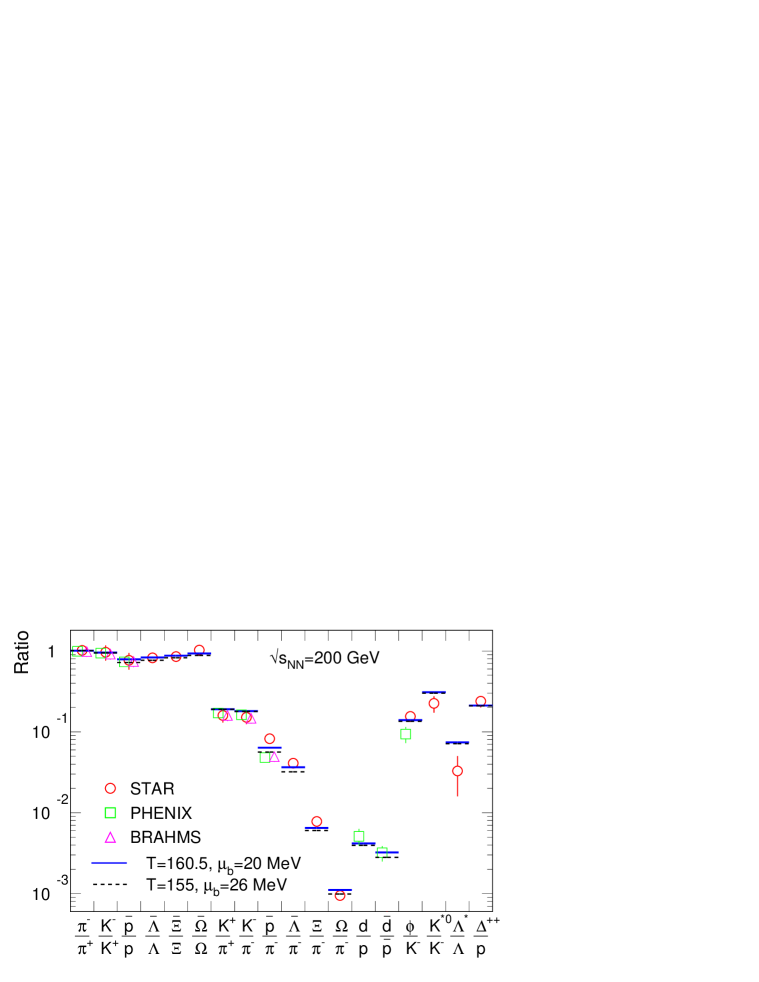
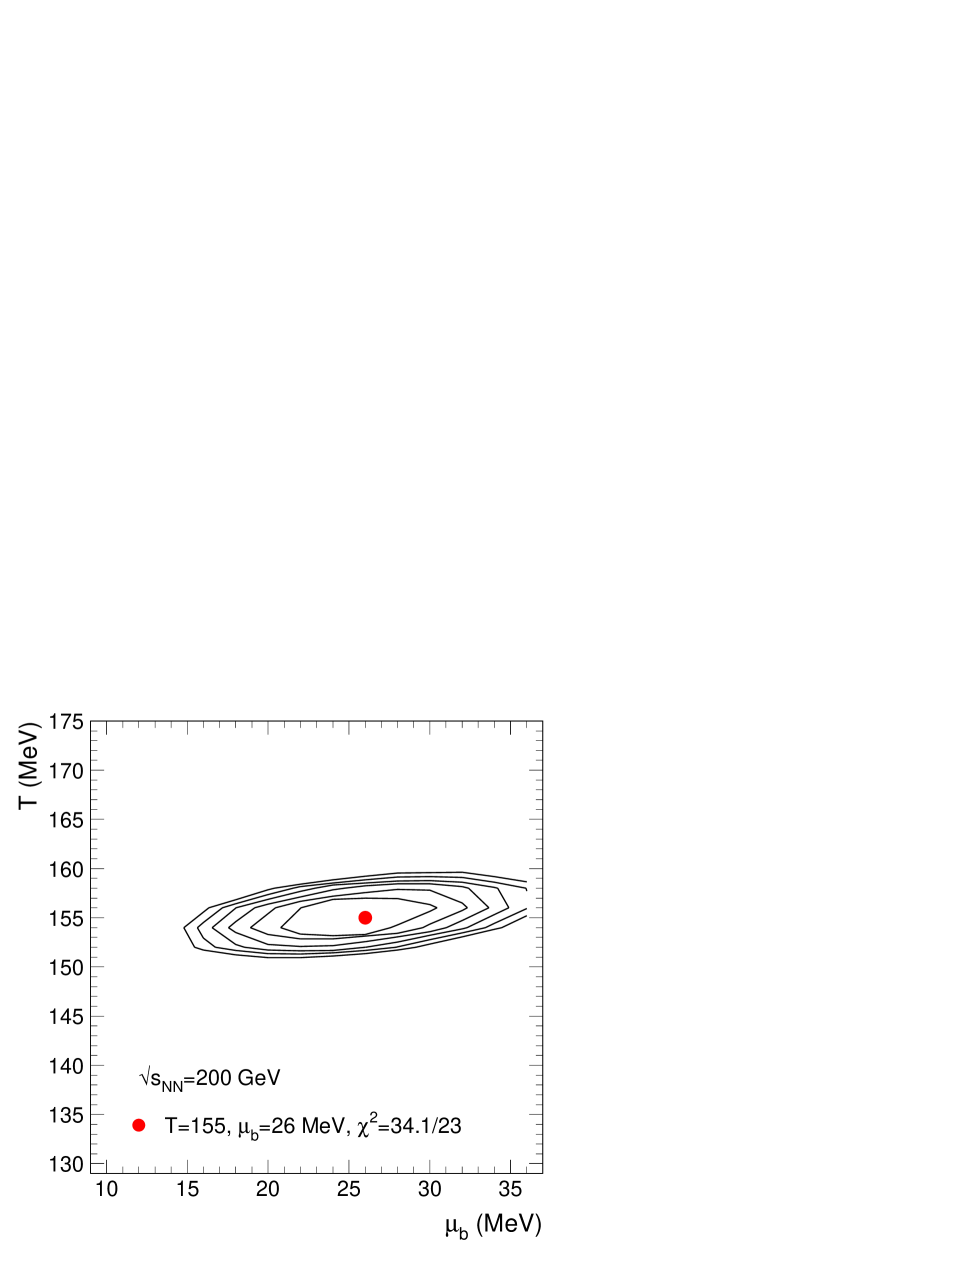
At =200 GeV only a limited set of yields of identified hadrons is available to date. The yields of , , , and are published by PHENIX [76], STAR [77], and BRAHMS [78] and the values agree within the quoted systematic errors. In addition, available are the yields of [79, 80], [81], and [82]. We use the hadron ratios with the corresponding errors whenever provided by the experiments [76, 79, 80, 81] or otherwise calculate the ratios using the published yields quoted above. Further ratios are available as preliminary data on strange hyperon ratios [83], [84], , , , , and [85]. Unless specified, our fits do not include the ratios involving resonances (, , and ).
We consider the following cases for the fits:
i) a combined fit of all available data, with the exception of strongly
decaying resonances:
MeV, MeV,
(with minimization: =164 MeV, =24 MeV, =0.40).
If we include in the fit the three ratios involving resonances
(, , and ),
the results are the same within the errors, MeV,
MeV, but with a worse
(=162 MeV, =22 MeV, =0.82).
ii) as i), but excluding from the fit the ratios and
from PHENIX. The resulting parameters are: MeV,
MeV, with =16.0/21
(=166 MeV, =26 MeV, =0.19).
Including the resonances the outcome of the fit is identical,
MeV, MeV, with a reasonable
(=164 MeV, =20 MeV, =0.61).
|

|
Obviously, the outcome of the fit (lower ) for case i) is determined by two contributions: a) the 6% systematic error assigned by PHENIX to the ratio , which is much smaller than the values 14% and 18% which we calculate from the systematic errors of the absolute yields in case of BRAHMS and STAR data, respectively; b) the ratio from PHENIX [80], which is much lower compared to the value from STAR [79]. Using all data from STAR (without resonances) and the and ratios from PHENIX gives MeV, MeV, with (from minimization: =166 MeV, =22 MeV, =0.17). Taking into account that, for all cases, the minimization results lead to 160 MeV, and despite the fact that the is reasonable even for the global fit, we consider the fit without the ratios and from PHENIX (case ii) as the nominal case for =200 GeV. The systematic errors are then estimated as the differences to the case when all measured hadrons (but no resonances) are included in the fit and to the values from the minimization.
The experimental ratios and the best fit calculations for the two cases, i) and ii) are shown in Fig. 11. Their respective distributions are shown in Fig. 12. We note that, comparing the resonances, only the ratio is clearly deviating from the model fits in our case, at variance with other claims in this respect [86]. Despite this deviation, which needs further support from the experimental side, our results on resonances do not point to a sizeable hadronic rescattering effect after chemical freeze-out [86].
|
|
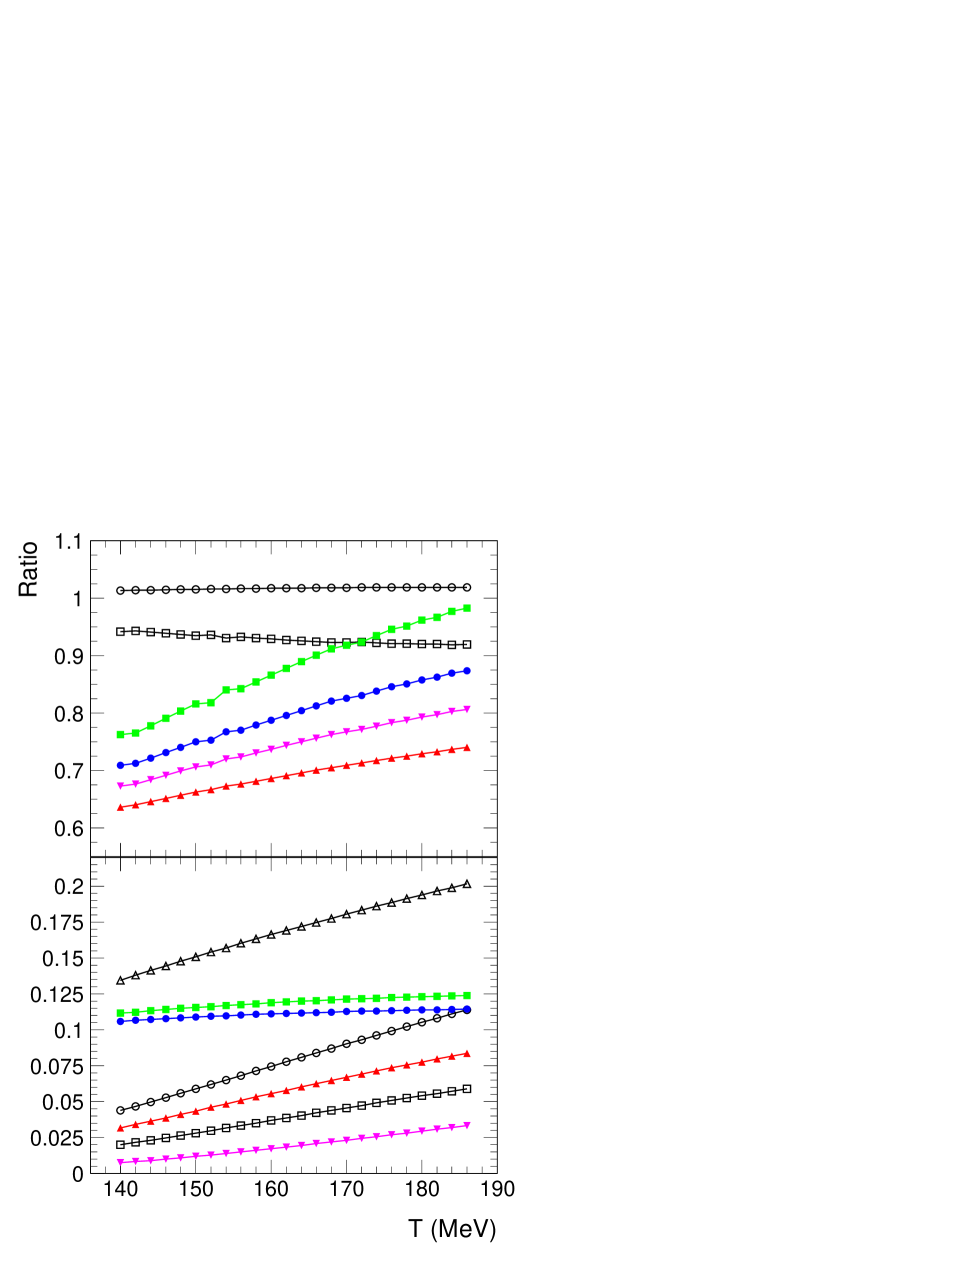
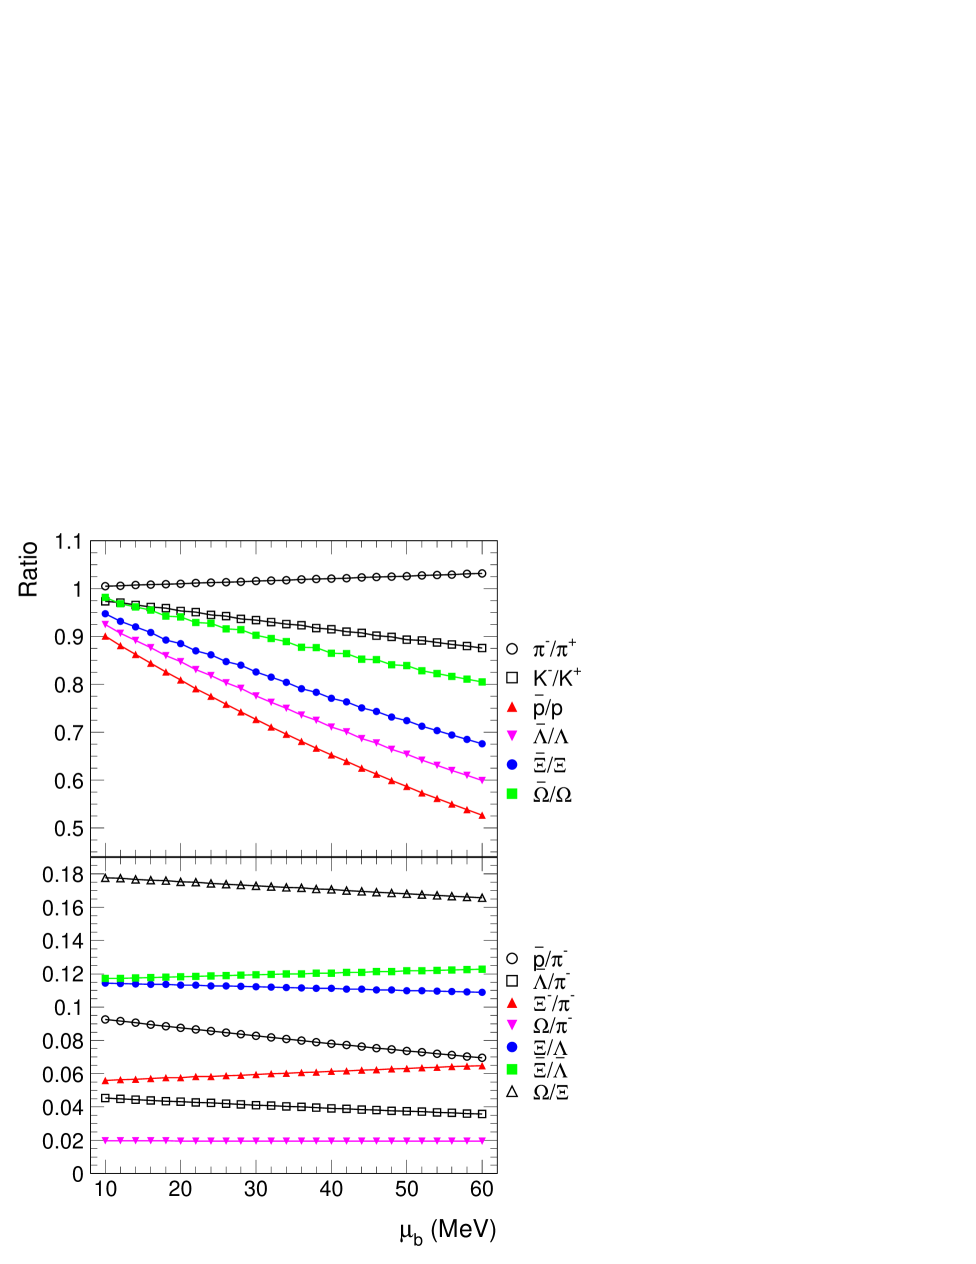
In Fig. 13 we show the sensitivity of various hadron ratios on and for the range of values relevant for the RHIC energies [6]. The importance of particular ratios in constraining and/or is evident. The antihyperon to hyperon ratios as well as the ratios of heavy hadrons to pions are of special value in this respect.
We note that thermal models have also been used to describe hadron production in e+e- and hadron-hadron collisions [38, 27], leading to temperature parameters in the range 160-170 MeV. We mention that our model does not fit well the e+e- data. Our fits to the data at =29 GeV compiled in ref. [27] were performed constraining =0 and with three free parameters: the temperature, , the strangeness suppression factor, , and the volume, (used to calculate the canonical suppression factor). The fits yield MeV, and fm3, with a =56/11. Obviously, the fit quality is very poor. For comparison, in the analysis of ref. [27] MeV, , =29.3/12. Both and are compatible within the errors, but our fit shows a much worse quality. This may be due to the approximations concerning canonical strangeness suppression which are employed in the present approach. However, even with the appropriate canonical treatment as done in ref. [27], the quality of the fits (both in e+e- and in hadron-hadron collisions) is not good, raising questions about the applicability of the statistical model for elementary collisions.
4 Energy dependence of the thermal parameters
Our results for the best fits are summarized in Table 2. The upper part in Table 2 shows the results of the fits using mid-rapidity data, the lower part is for the data integrated over 4. One notices that in general is close to (and often below) unity, being significantly above unity only for the SPS energies. The fits 4-integrated data result in comparable temperature values as for the mid-rapidity data in case of the AGS energies and sizably lower values for the SPS energies. For the higher SPS energies, the fits of 4 data are characterized by even poorer values. We would like to stress that, although we have performed the fits of 4 data up to the top SPS energy (in order to compare to similar analyses in other works), we consider the extracted thermal parameters in this case adequate only up to the energy of 40 AGeV. Also included in Table 2 are the results of the minimization, which differ sometimes from those obtained from the minimization. The central values used in the following are those from the minimization.
| (GeV) | (MeV) | (MeV) | ||||||
|---|---|---|---|---|---|---|---|---|
| 2.70 | 641 | 76020 | 1.0/2 | 64 | 760 | 0.012 | +10,-2 | 23 |
| 3.32 | 782 | 67016 | 0.43/3 | 78 | 670 | 0.005 | +12,-3 | 20 |
| 3.84 | 862 | 6158 | 1.15/4 | 86 | 615 | 0.018 | +13,-3 | 19 |
| 4.30 | 933 | 58011 | 1.14/3 | 94 | 580 | 0.021 | +14,-3 | 17 |
| 4.85 | 1243 | 53710 | 6.9/7 | 130 | 540 | 0.34 | 7 | 12 |
| 8.76 | 156 | 403 | 15.4/13 | 166 | 434 | 0.61 | 11 | 32 |
| 12.3 | 1546 | 29819 | 23.4/5 | 152 | 271 | 0.23 | 12 | 33 |
| 17.3 | 1605 | 24018 | 55/22 | 172 | 243 | 0.86 | +19,-12 | 24 |
| 130 | 165.55.5 | 3811 | 4.1/11 | 168 | 42 | 0.12 | 6 | 11 |
| 200 | 160.5 2 | 204 | 16.0/21 | 166 | 22 | 0.19 | 6 | 7 |
| 3.84 | 86.52 | 63111 | 6.7/4 | 88 | 640 | 0.14 | 12 | 19 |
| 4.85 | 1154 | 53511 | 9.0/5 | 116 | 530 | 0.15 | 5 | 15 |
| 6.27 | 132.53 | 51815 | 4.4/4 | 136 | 516 | 0.13 | 5 | 16 |
| 7.62 | 1383 | 45912 | 22/4 | 140 | 449 | 0.22 | 7 | 19 |
| 8.76 | 1355 | 38019 | 32/5 | 142 | 387 | 0.21 | 9 | 22 |
| 12.3 | 146.53.3 | 31617 | 30/4 | 144 | 277 | 0.13 | 4 | 39 |
| 17.3 | 1519 | 25641 | 36/9 | 170 | 285 | 0.39 | +18,-5 | 41 |
The ”systematic” errors and shown in Table 2 are obtained by quadratically adding the 1 error from the minimization with the difference between the values obtained by and minimization . Whenever redundant sets of data are available from different experiments, which is the case at top SPS and top RHIC energies, our ”nominal” values are those resulting from the combined fit of all data. We have assigned as systematic error the quadratic sum of 1 fit errors and the deviation between the (,) values of this case and those resulting from the fit of the data which results in the smallest value of (see previous section and Table 2). For the SPS energy of 80 AGeV (=12.4 GeV) the systematic errors are evaluated based on the sensitivity of the fit on the inclusion of different hadron ratios. As discussed in the previous section, for lower AGS beam energies of 2-8 AGeV, we have estimated 14% and 3% systematic errors for and , respectively, based on the sensitivity of the fit using ratios at top AGS energy. For the AGS energy of 6 AGeV, we have used the available 4 yields of pions [47], protons [45], and [49]. We note that, at this energy, there are no and yields measured in full phase space. Based on a comparison of the ratio at mid-rapidity and in 4 at top AGS energy [53], we have assumed that at 6 AGeV the ratio in 4 is 10% smaller than at mid-rapidity. At the top AGS energy, some of the 4 yields do not correspond to complete coverage [53]; also, the ratio is obtained with a rather large extrapolation.
|
|
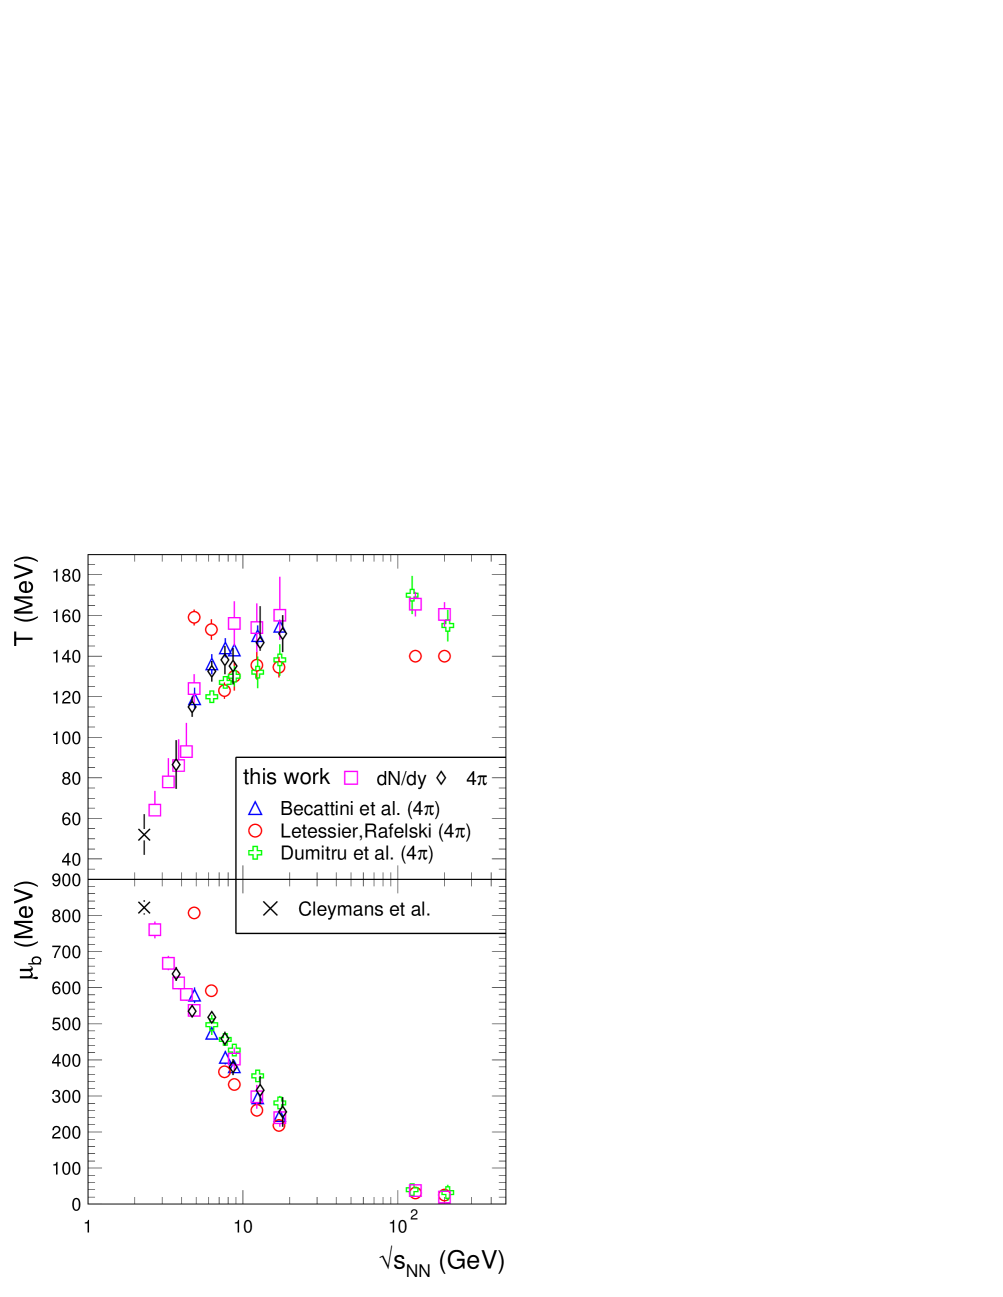
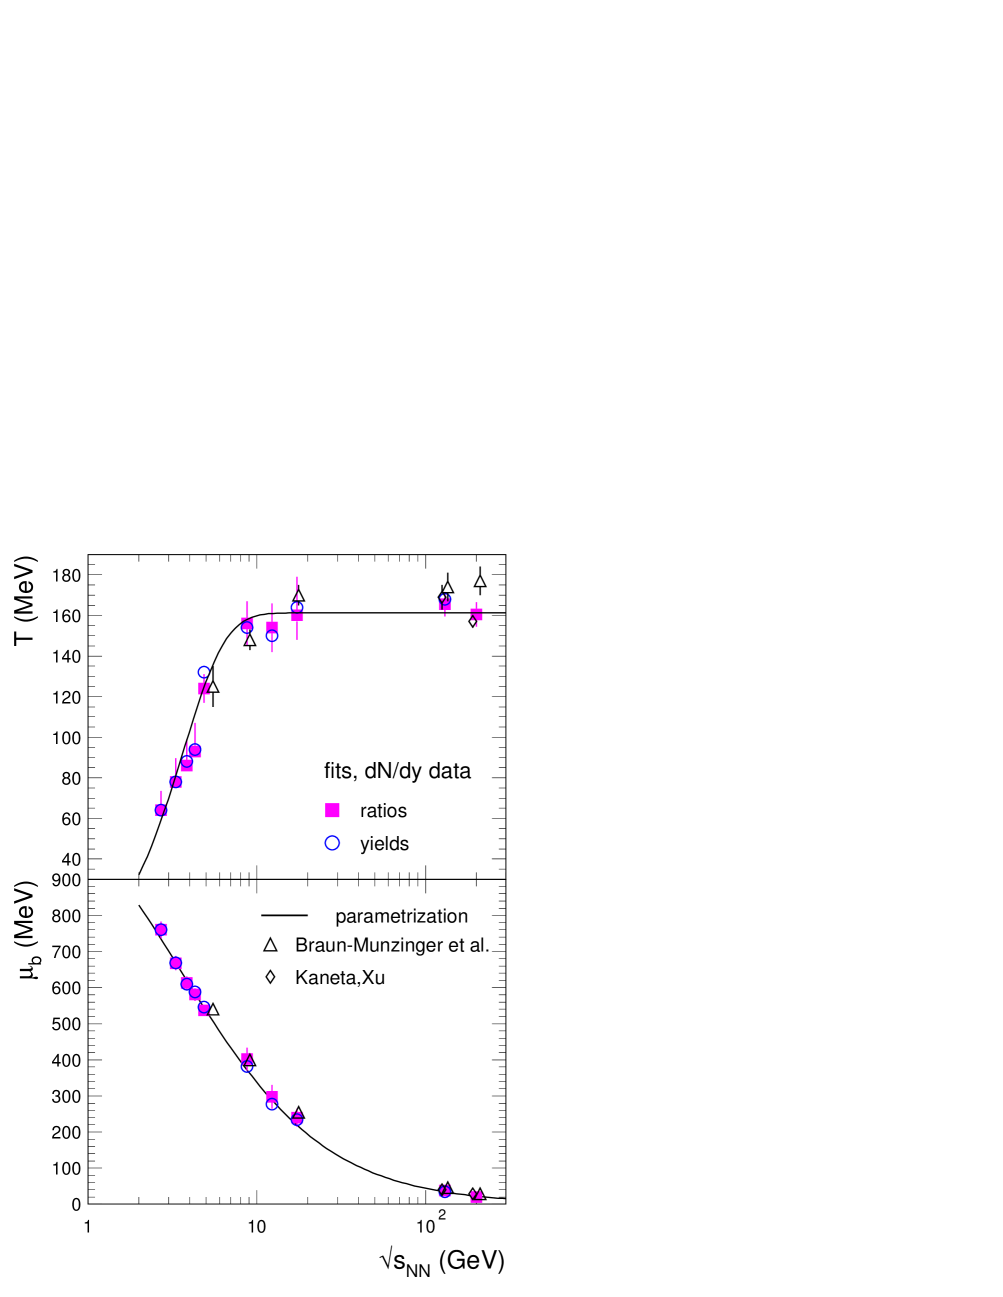
In Fig. 14 we show the energy dependence of and extracted from our thermal fits. The temperature exhibits a sharp rise up to 7-8 GeV, while sharply decreases all the way up to RHIC energies. Our results are compared with results from other studies [1, 3, 8, 20, 21, 69], which exhibit similar trends. One notable exception are the results of Letessier and Rafelski [21]; in this case, the observed difference may arise from the usage in their work of seven free parameters, including, besides strangeness fugacity and suppression factor (), a light quark occupancy factor () and an isospin fugacity. The non-monotonic change in and as a function of energy determines the temperature extracted in ref. [21]. To alleviate the poor quality of the fits at SPS energies, the model of Dumitru et al. [69], introducing an inhomogeneous freeze-out scenario, goes beyond other thermal models.
Not surprisingly, our results support those obtained earlier within the same model implementation [1]. In detail, there are differences between our results and the rest of the other results. Our values for the analysis of the 4 data are significantly different from those of Becattini et al. [20], obtained within a model employing the strangeness suppression factor. A remarkable agreement between our results and the analyses in ref. [6, 8] is seen in case of the RHIC data, in particular at =130 GeV. The results at =200 GeV [8, 9] are also in agreement with our values. The higher value at =200 GeV in ref. [6] is due to preliminary data.
We have parametrized our results from the fits of mid-rapidity data (left panel in Fig. 14 and Table 2) as a function of (in GeV) with the following expressions:
| (6) |
| (7) |
where the parameters 120 MeV and 0.049 GeV-1 are the results of a fit (=0.48/8). Our parametrization is the one proposed in ref. [26], but with different parameters to better fit the newly obtained values of the present analysis. In Eq. 6 we assume a ”limiting” temperature , which was obtained by fitting the five points for the highest energies (SPS and RHIC). The result of the fit is MeV, with =0.3/3.
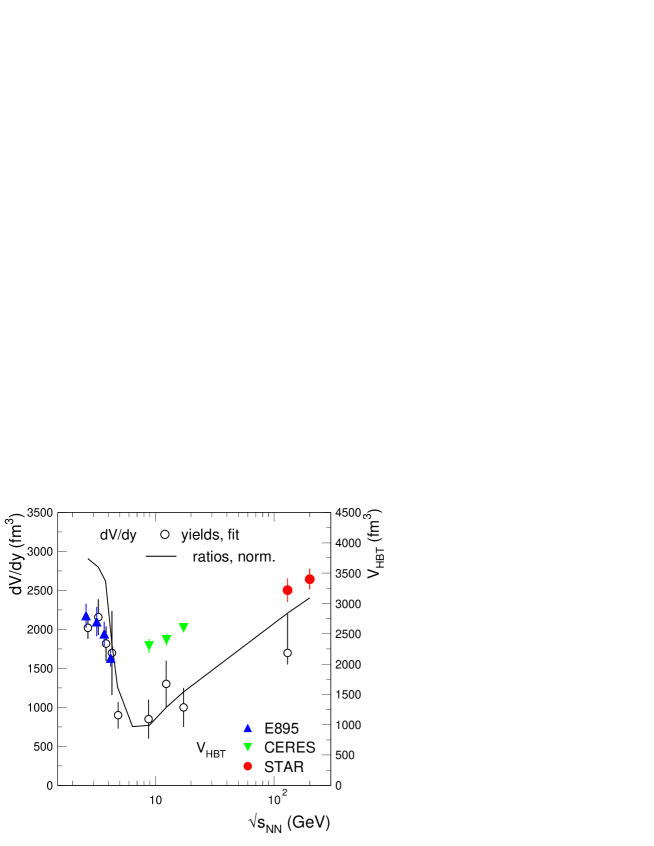
We now briefly turn to another interesting parameter which is (either implicitly or explicitly) determined in the course of thermal model analyses. The volume at chemical freeze-out (corresponding to a slice of one unit of rapidity, ) is shown in Fig. 15 as a function of energy. The values extracted directly from the fits of particle yields (see Appendix) are compared to the values obtained by dividing measured charged particle yields with calculated densities (based on the above parametrization of and ; note that for the AGS energies of 2-8 AGeV the values of corresponding to the upper limit of the systematic error were used instead). As expected, the two methods give identical results, with the exception of a small discrepancy for the lowest energies. The chemical freeze-out volume is compared to the kinetic freeze-out volume extracted from Hanbury Brown and Twiss (HBT) measurements, [87]. We note here (see also the Appendix) that to determine a volume from thermal model analyses one needs to know absolute densities. This implies an explicit dependence of the volume on whether or not excluded volumes are implemented in the calculations, and, if included, on details of the implementation. We follow here the procedure developed in [5].
While the bias towards unphysically large volumes seen at the energies of 2-8 AGeV (see Appendix) is not completely understood, it is clear that the volume at kinetic freeze-out should not be exceeded. Note that, to relate quantitatively the magnitude of the rapidity density of the chemical freeze-out volume to the volume at kinetic freeze-out determined from HBT measurements, one needs to map rapidity onto space (see the discussion in [87]). Here we are mainly interested in the energy dependence of the two volumes. It appears that the volume at chemical freeze-out does exhibit a similar non-monotonic behavior as the volume at kinetic freeze-out, a remarkable result considering that the latter is determined by a completely different procedure. A minimum is observed for the top AGS energy, followed by a logarithmic increase as a function of .
5 The energy dependence of hadron ratios
Using the parametrizations of the chemical freeze-out parameters derived from the fits of experimental data at mid-rapidity, as shown in Eq. 6 and 7, we calculate the energy dependence of various hadron ratios. No contribution from weak decay feed-down is included in the model calculations as the published data are mostly corrected in this respect. Whenever not the case, the measurements are scaled appropriately (see below). The finite widths of resonances are taken into account in the model. This contributes about 10% of pions at low energies and 4% at higher energies. Within the smoothing hypothesis implied by the parametrizations of Eq. 6 and 7, the model has interpolative and extrapolative predictive power. In this sense, we can provide quantitative predictions for LHC energy, as well as for the low RHIC energy of 62.4 GeV, for which the experimental data are becoming available [88]. This also applies to the low energy SPS data [89].
|
|
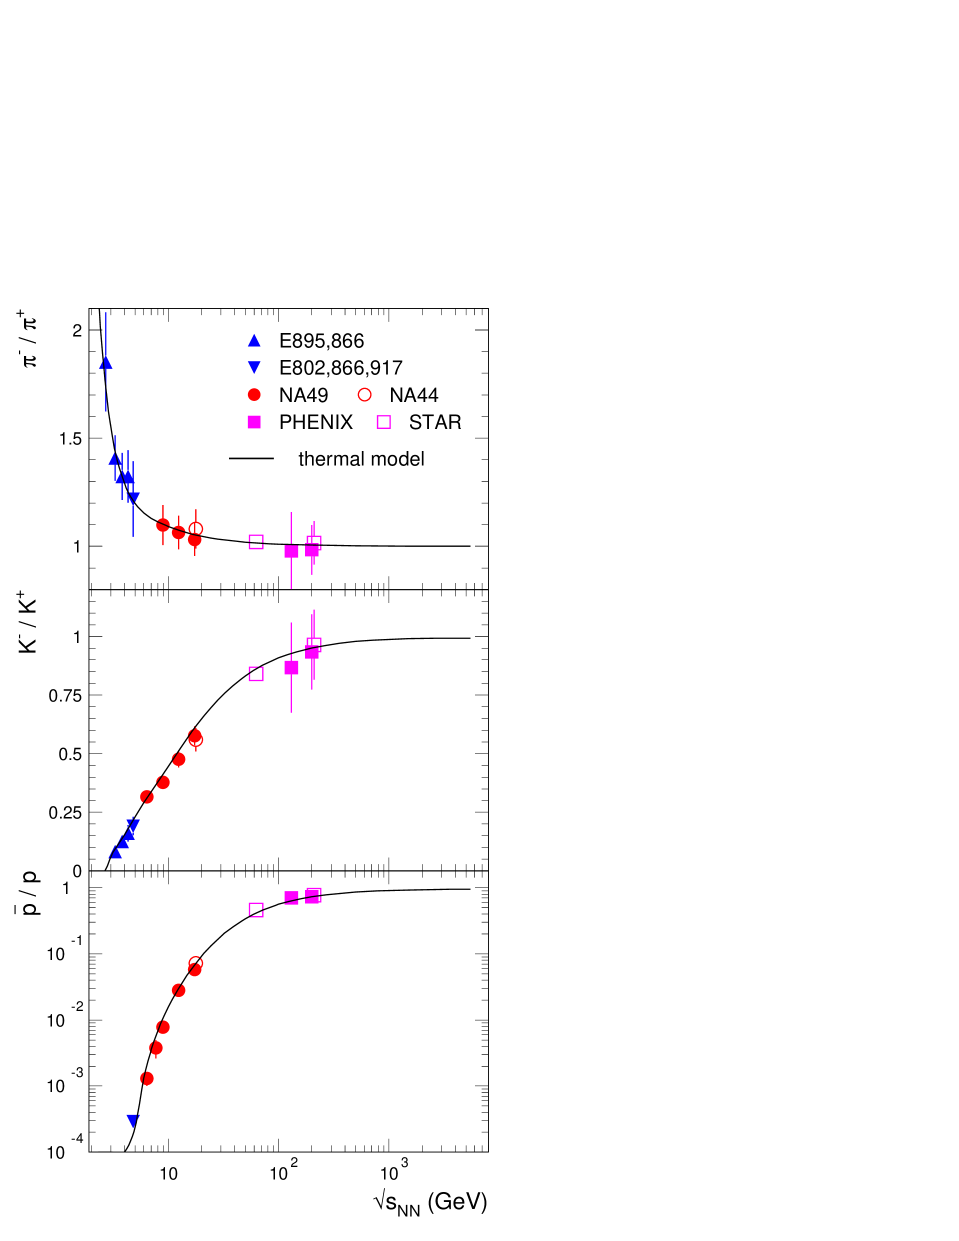
In Fig. 16 we show the energy dependence of antiparticle to particle ratios. Calculations employing the global and from Eq. 6 and 7 reproduce very well all these experimental ratios, including the preliminary values for =62.4 GeV [88]. The , , and ratios illustrate the decreasing importance of isospin, the increasing importance of strangeness production and the dramatic evolution as a function of energy of the balance between the incoming and newly produced protons. The ratio has the steepest dependence on energy. From the lowest measured value of 3 at AGS, it reaches a value of about 0.7 at RHIC and is predicted to reach 0.95 at LHC. The dominance of the initial nucleons at low energies changes to the newly created hadrons at RHIC and beyond. At LHC, it is expected that the fireball will consist practically completely of created hadrons (1 MeV).
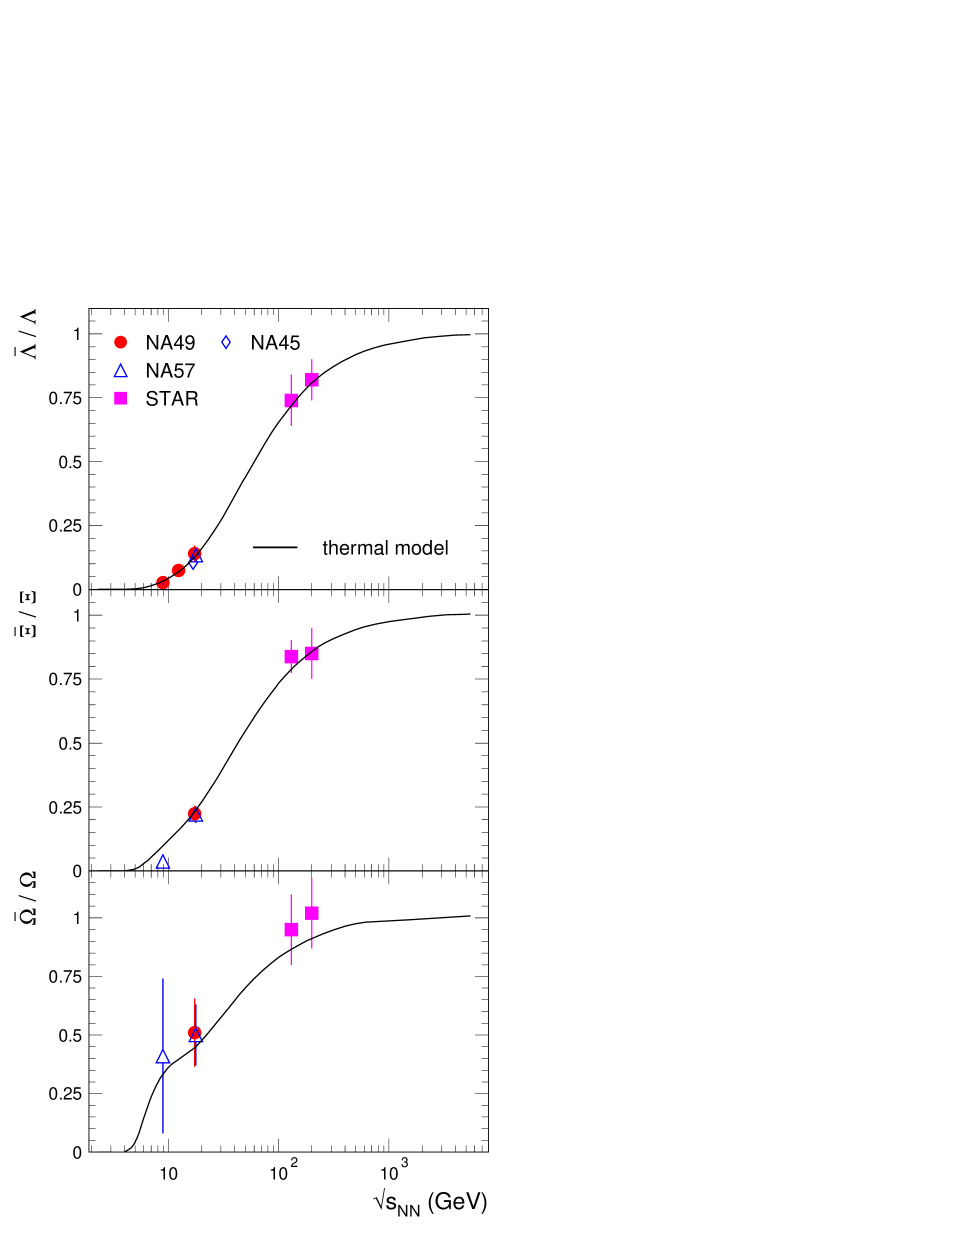
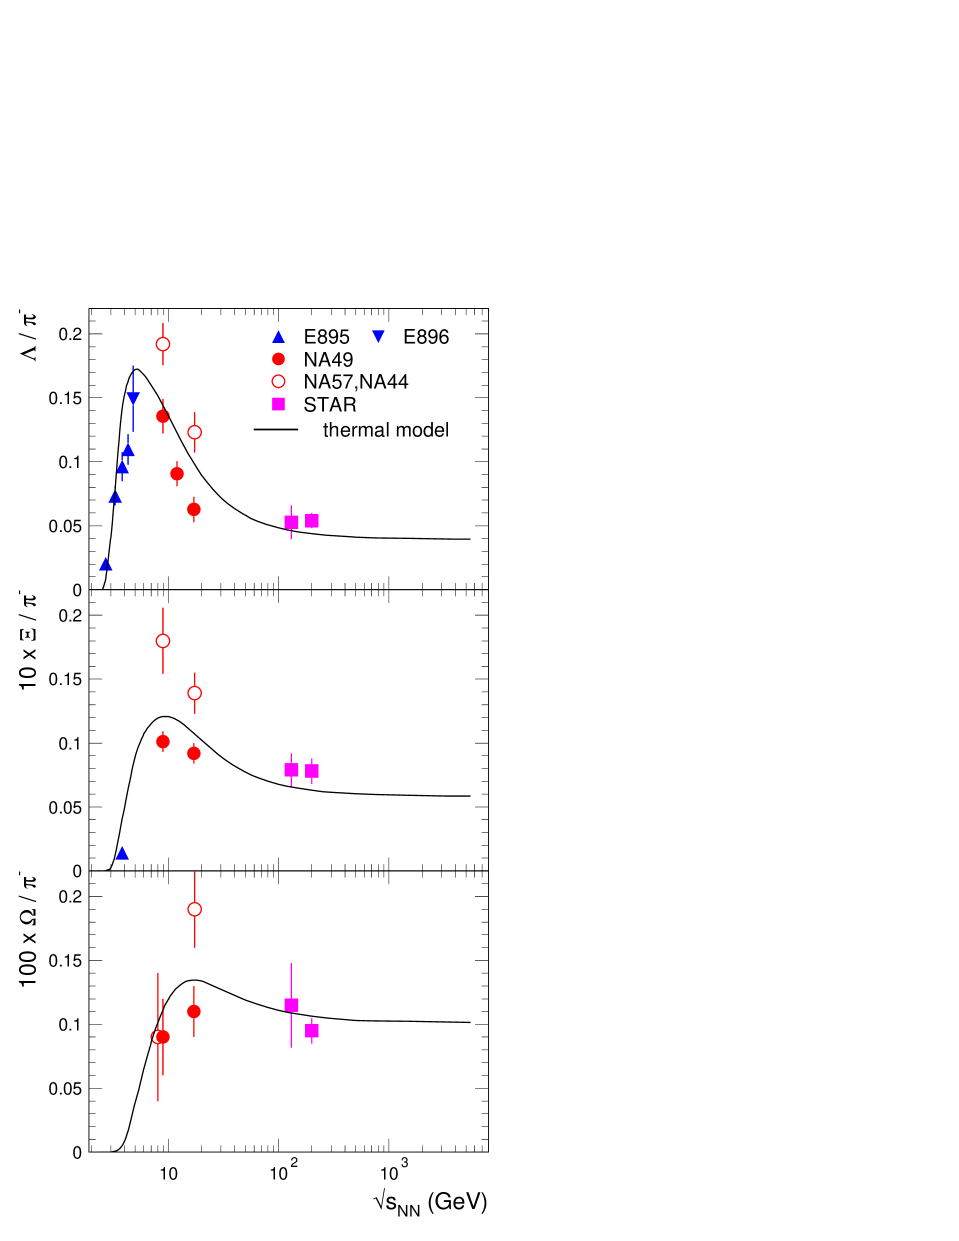
The energy dependence of antihyperon/hyperon ratios (right panel in Fig. 16) follows a mass hierarchy: the saturation value of 1 is achieved the earlier the more massive the hyperon species. This is a fingerprint of the preferred abundance of hyperons over antihyperons containing 2 () or 1 () light valence quarks, which may be remnants from the incoming nucleons, while in case of , all valence quarks are newly produced.444 The small structure of the excitation function at =10-20 GeV, most prominently seen in Fig. 16 for the ratio , but also for , is an artifact of our parametrization of . Remarkably, as already seen in Fig. 8, there is a very good agreement between the NA49 [61, 62, 63] and the NA57 [64] data. The ratio from the NA45 (CERES) experiment [90] is as well in agreement. The generally poor quality of thermal fits at SPS energies is not caused by ratios involving (multi)strange baryons.
|
|
The comparison of the measured and calculated excitation functions for hadron abundances with respect to pions is shown in Fig. 17. For a consistent comparison to the other measurements and to the calculations, the measured pion yield at =130 GeV [70] was scaled assuming that 30% of the weak decays contribution was contained in the data (see above). The ratios shown in Fig. 17 have a very different energy dependence compared to those in Fig. 16, reflecting the evolution of the fireball composition at freeze-out as a function of energy. The steep decrease of the ratio directly reflects the decrease as a function of energy of stopping of the incoming protons, implying a decrease of . The increase of pion production also plays a role in this ratio. Beyond 100 GeV, the flattening is a consequence of the dominance of newly created baryons. The steep variation of the and ratios at the lowest energies reflects the threshold for strangeness production, determined in the model by the steep increase of the temperature. The canonical suppression plays an important role as well. While the ratio shows a monotonic increase with energy, followed by a saturation, essentially determined by the temperature (as both particles are newly created), the ratio , which is much discussed as a signature for the onset of QGP [91, 92, 93, 94], shows a characteristic broad peak around 8 GeV. As the contains a valence quark, which may come from the initial nucleons, its yield is the convolution of two competing contributions as a function of energy: i) the decreasing net light quark content and ii) the increasing production of quark-antiquark pairs. The peak in the ratio occurs naturally in the thermal model [26, 25], but is broader and has to be seen in the context of other strange hadron yields [25] (right panel of Fig 17). It appears that, at the SPS energies of 80 and 158 AGeV, the yields of kaons and protons relative to pions are systematically below the thermal model predictions. We note that recent transport model calculations [93] grossly deviate from the measured ratio, while earlier results reproduced the data well [95]. We emphasize the good agreement between the two data sets (NA49 [58] and NA44 [57]) available at the top SPS energy.
The energy dependence of the relative hyperon yields, , and , shown in the right panel of Fig. 17, reveals the presence of characteristic peak structures, already noted in [26]. Their strength and location follows a mass hierarchy, recently discussed by Cleymans et al. [25]. The peaks are less pronounced and located at larger energies ( 5, 10 and 20 GeV) the more massive the hyperon species. This results from an interplay between the baryochemical potential (presence of the light quarks from the initial nucleons) and temperature. The agreement between the model and the data is good at AGS and RHIC energies, while at SPS the situation is more complex. The two available sets of data, NA49 [61, 62, 63] and NA57 [64], are in a clear disagreement: generally, the NA49 data are below the NA57 data. As a consequence of our adopted fitting procedure (see above) the model prediction is between the two data sets. We notice that the discrepancy of the data is manifest in the absolute yields: for instance, of at top SPS (5% central collisions) for NA49 and NA57 are 11.01.6 and 18.52.2, respectively. The disagreement is well beyond the errors (statistical and systematic, added in quadrature) quoted by both experiments.
|
|
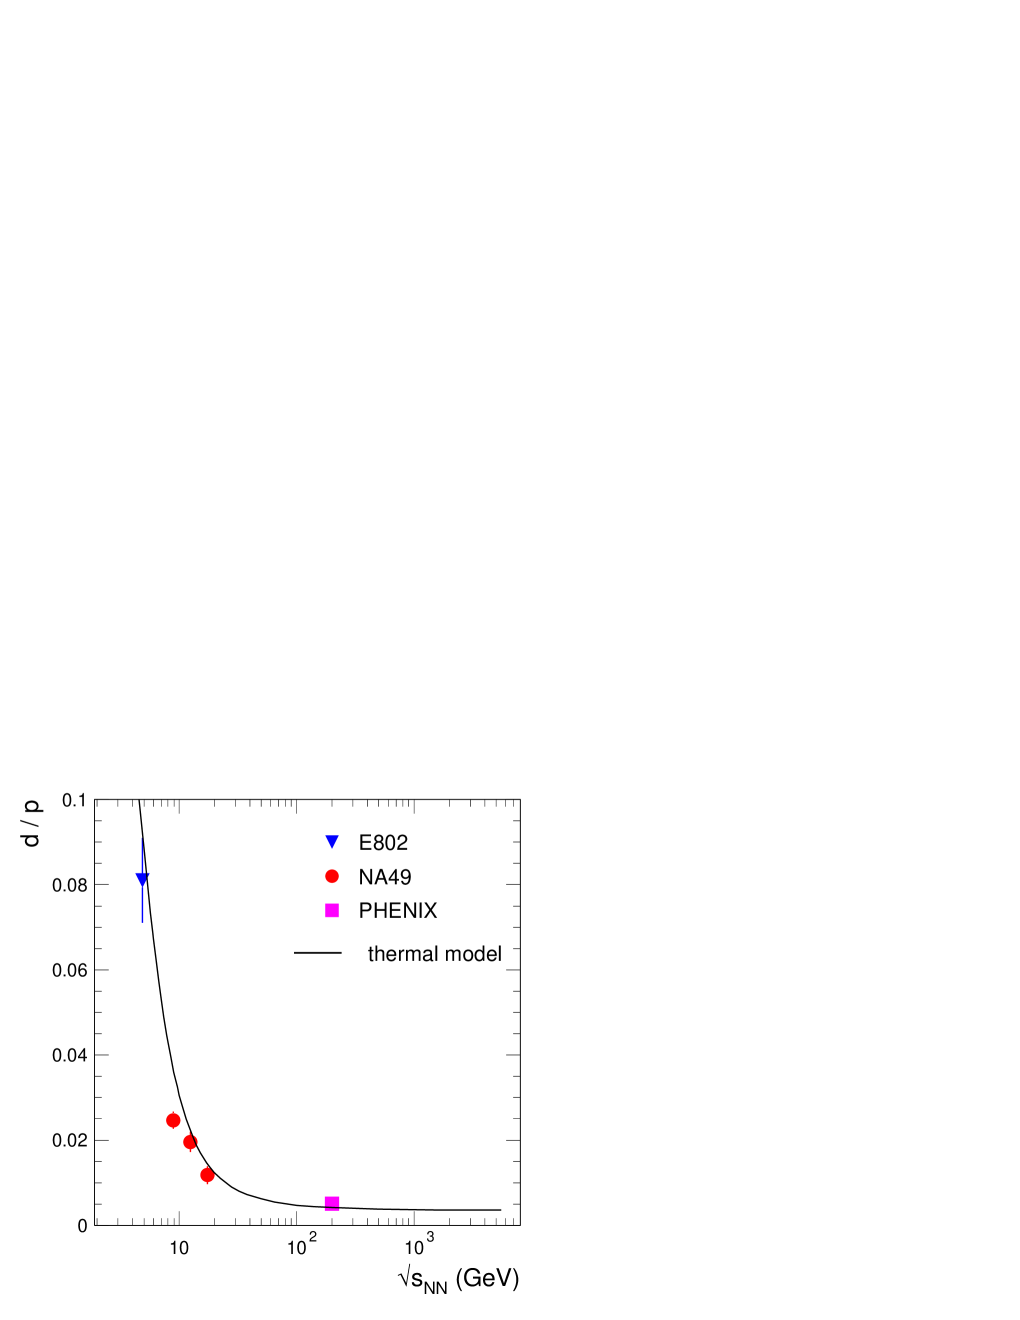
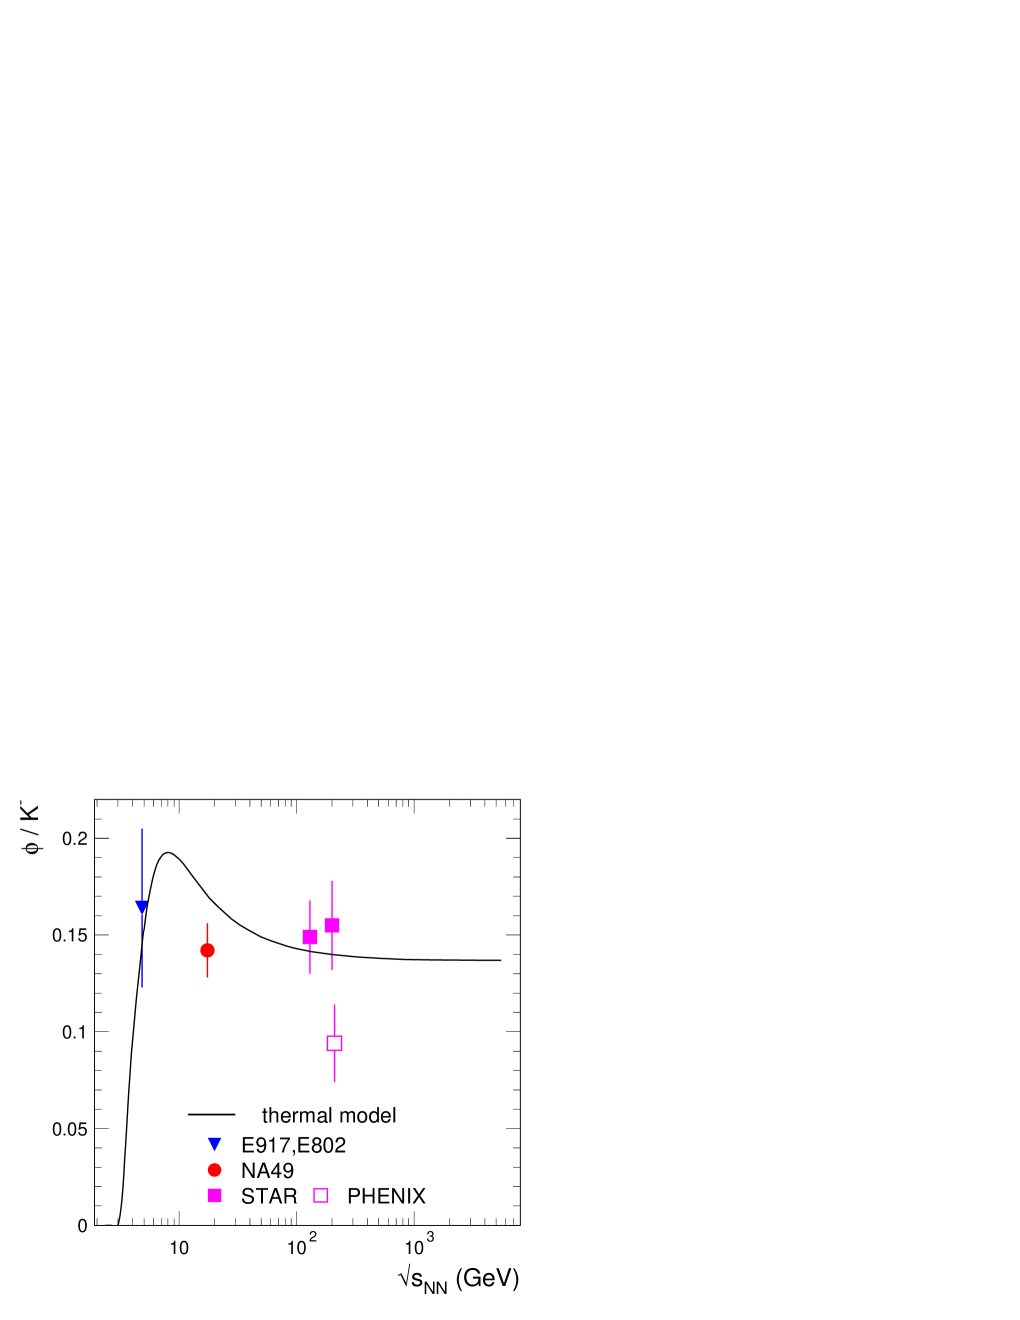
In Fig. 18 we show the excitation function of the ratios and . The ratio shows a monotonic decrease as a function of energy, well explained by the model. The ratio shows a peak in the calculations, centered in this case at 8 GeV. The model reproduces well the AGS measurement [55], while at SPS there is a disagreement. At RHIC the experimental situation is unclear; the model is in agreement with the STAR data.
Given the accuracy of the description of hadron ratios presented in the previous section, it is not surprising that, based on a parametrized energy dependence of and , the model does reproduce the experimental values well over a broad energy range. However, systematic discrepancies between the model calculations and data are evident for the SPS data, in particular concerning the ratios involving strange to non-strange hadrons.
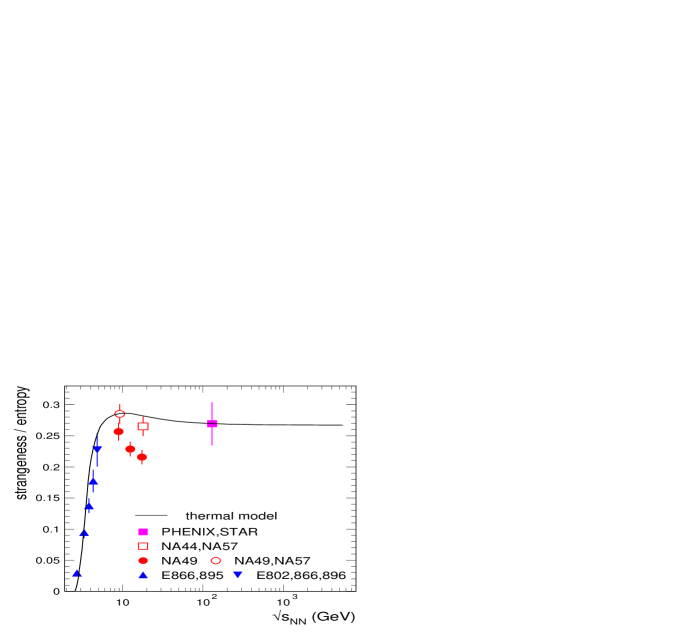
A more global way to represent the ratio of strange to non-strange hadrons is the strangeness () to entropy () ratio. Its excitation function is presented in Fig. 19. We adopt an experiment-oriented construction of the two quantities, which we consistently employ for the model as well, calculated from the yields at mid-rapidity as:
| (8) |
The strangeness has in principle to be complemented with the yields of , and (and and ), but, since the measurements for these yields are scarce (as seen in Fig. 17 and 18), we have chosen to leave them out for the strangeness count. The factor 2 multiplying the kaon yields takes into account , while the factor 1.54 for hyperons accounts for the contribution of and was deduced from the model calculations.555The yield of , which decays with 100% branching ratio into , is always included in the yield. The factor 1.5 for the pion yields accounts for the yield, while in case of yields the factor 2 is used to account for the produced protons. As expected from the individual particle ratios studied above, the ratio strangeness/entropy is well reproduced by the model, with the exception of the data at SPS, where the NA49 data exhibit a sharper peak than predicted by the model. This feature is not supported by the NA57 data, which are in agreement with the model.
| 1.00 | 0.99 | 0.95 | 1.00 | 1.00 | 1.00 |
| 0.074 | 0.180 | 0.179 | 0.039 | 0.0058 | 0.00106 |
| 0.136 | 0.312 | 0.216 | 0.140 | 0.075 | 0.396 |
The results discussed above allow a rather confident prediction for hadron ratios in central Pb-Pb collisions at LHC energy [96], presented in Table 3. The antiparticle/particle ratios are all very close to unity, with the exception of , reflecting the small, but nonzero, value obtained from Eq. 7. Within the extrapolation scenario for the thermal parameters, the model predicts that the yields relative to pions are very similar to the values measured at the RHIC energy.
6 The phase diagram of hadronic matter
The values of and obtained from our fits of the experimental data are shown in a phase diagram of hadronic and quark-gluon matter in Fig. 20. Full points are from fits of ratios of yields at midrapidity, open points are from fits of 4 ratios. An important observation about the phase diagram is that, for the 40 AGeV SPS energy and above, the thermal parameters agree with the phase boundary calculations from lattice QCD (LQCD) [12, 13, 14], implying that hadron yields are frozen at the phase boundary. The LQCD calculation [12] shown in Fig. 20 is for two light quarks () with realistic (close to physical) masses and a heavy strange quark. The critical temperature at =0 from LQCD calculations is about 165 MeV [18] (and refs. therein), with a scale uncertainty of the order of 10 MeV [18, 14] and with comparable systematic errors [18].
![[Uncaptioned image]](/html/nucl-th/0511071/assets/x36.png)
|
|
Also included in Fig. 20 are calculations of freeze-out curves for a hadron gas at constant energy density (=500 MeV/fm3) and at constant total baryon density (=0.12 fm-3) [22]. The LQCD phase boundary calculated in [12] and shown in Fig. 20 apparently does not follow the expectation [13] (see also [97]) of a constant energy density dependence. However, depending on the method, the errors for the critical line from LQCD calculations can be large for finite [13].
The freeze-out points which are departing from the LQCD phase boundary are approximately described by the curve of a hadron gas at constant baryon density. An earlier proposed freeze-out criterion corresponds to an average energy per average number of hadrons of approximately 1 GeV [11]. It has also been argued recently that the freeze-out points can be described by a constant entropy density divided by [23]. This is a measure of the degrees of freedom; in a hadron gas with realistic masses the effective number of degrees of freedom depends explicitly on temperature and is not constant. As Cleymans et al. [25] have recently pointed out, for realistic excluded volume corrections, this criterion grossly deviates from the freeze-out points. A comparison of various freeze-out criteria was recently done in ref. [24], which showed that all are identical except for large and small values. All are smooth curves and consequently not consistent with the new results presented here, which exhibit a rather steep trend at intermediate values. However, the errors need to be improved before one can confidently rule out any (smooth) universal freeze-out criterion. An exciting possibility is that the rather abrupt turn-over in the freeze-out points near =400 MeV is caused by the approach to the QCD phase boundary.
The underlying assumption of the thermal model used to extract the (,) values is equilibrium at chemical freeze-out. A natural question then is how the equilibrium is achieved? The answer obviously cannot come from within the framework of the thermal model. Considerations about collisional rates and timescales of the hadronic fireball expansion imply that at SPS and RHIC the equilibrium cannot be established in the hadronic medium below the critical temperature [15, 16]. In a recent paper [16] many body collisions near were investigated as a possible mechanism for the equilibration within the hadronic stage. There it is argued that because of the rapid density change near a phase transition such multi-particle collisions provide a natural explanation for the observation of chemical equilibration at RHIC energies and lead to to within an accuracy of a few MeV. While this argument is expected to be valid also for SPS energies, the situation at lower energies needs further consideration.
The critical temperature determined from RHIC and SPS data assuming coincides well with lattice estimates [12, 14, 18]. These arguments buttress the conclusion that the hadrochemical freeze-out parameters probe experimentally in a unique manner the critical line of the QCD phase transition between hadrons and QGP [98]. Despite the rather large systematic errors of the extracted temperature for the SPS energies, our results imply that the phase boundary is reached for beam energies around 40 AGeV. The experimental data at 20 AGeV [89] will constrain further this energy range.
Based on the LQCD results of Fodor and Katz [12] shown in Fig. 20, the experimental freeze-out points at SPS are located in the vicinity of the critical point. It was pointed out recently [19] that the existence of a critical point for 500 MeV requires a fine tuning of the (light) quarks masses within 5%. However, it is important to recognize that serious open problems of LQCD [19] need to be solved before one could address quantitatively such a delicate possibility. Nevertheless, it is interesting to speculate whether the deviations from the thermal model (including rather poor-quality fits) which we have encountered for the SPS energies are a hint for the critical point. It is expected that, in the (broad) vicinity of the critical (end)point the thermal model would not work [68]. Thermal fits including fluctuations have been already performed for the top SPS energy [69]. Unfortunately, the present experimental situation, namely the level of disagreement between data, does not allow any firm conclusion on the interesting issue of the critical point.
7 Summary
We have analyzed the experimental hadron yields ratios over a broad energy range (=2.7-200 GeV) in comparison with thermal model calculations. The fits of the experimental data with the model provide the temperature and baryo-chemical potential, at hadrochemical freeze-out. The quality of the fits is very good for most cases, providing support for the validity of the approach. From our analysis we have established parametrizations of and as a function of energy. This allows to assess and understand trends visible in the experimental data. In particular, we have discussed for the yields of strange and multi-strange hadron yields relative to pions the resulting non-monotonic energy dependence, which describes the main features observed in the data, but not the details. Furthermore, we have provided quantitative predictions for hadron ratios at =62.4 GeV and at LHC energy, where first data are expected soon. The analysis presented here has also led to an updated version of the chemical freeze-out curve. The results buttress previous observations that, from 10 GeV on, the chemical freeze-out points coincide with the phase boundary between hadrons and the QGP as predicted by solving QCD on the lattice. We have provided chemical freeze-out points, for the first time, at the 4 low AGS energies. In this energy range the freeze-out curve exhibits a peculiar and intriguing structure which needs further explanation.
Appendix
In this Appendix we discuss technical aspects related to the thermal model analysis. First, we concentrate on the technical aspects of fitting yields rather than ratios, and the demonstration that both methods produce equivalent results. Secondly, we briefly address the issue of the role of in the thermal model fits. Finally, we comment on the issue of weak feeding. The absolute yields (and consequently the values for the volume) quoted here are for =350.
A. Analysis of particle yields
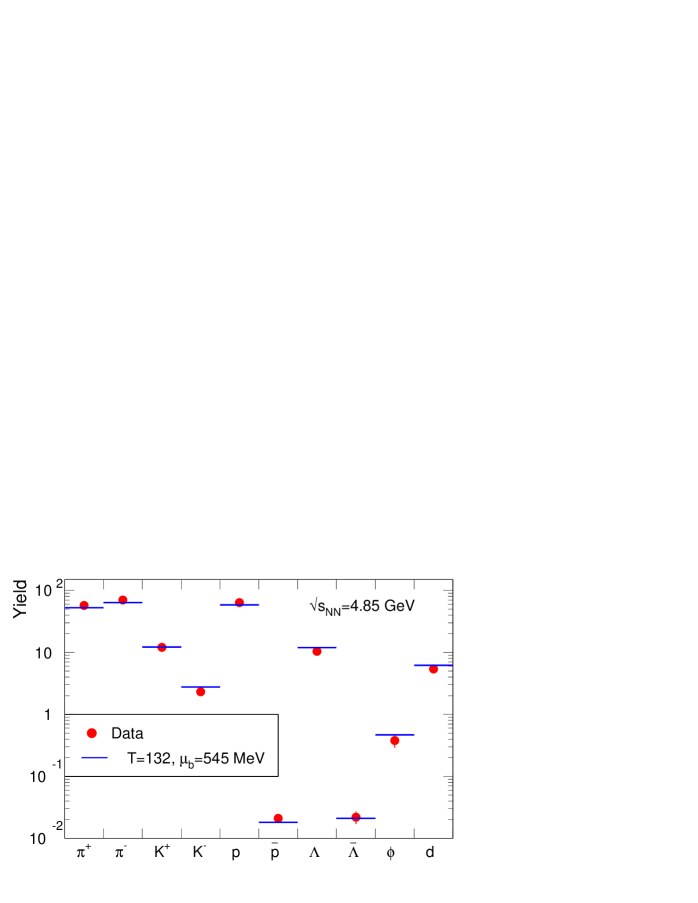
The fit of mid-rapidity yields for the top ASG energy is shown in Fig. 21. The resulting parameters are: =132 MeV, =546 MeV, =900 fm3. With =10.3/7, the fit is good. The temperature is somewhat higher than the temperature obtained when fitting ratios. Excluding from the fit the yields of , , , and one obtains: =110 MeV, =550 MeV, =2620 fm3, =1.2/3. The resulting change in is 20%, larger than the difference derived from the fit of ratios (15%). This lower temperature is ”compensated” by an unphysically large volume, leading to a good fit in this case too. The main contribution to this effect arises from the absence of and (when fitting without and : =114 MeV, =551 MeV, =2100 fm3, =2.8/5).
Our fits of (mid-rapidity) yields at lower AGS energies result in identical values for and as when using ratios. The extracted volume is much larger than for the top AGS energy. This originates in the bias of the temperature due to the limited set of particle yields available, as discussed above and as also observed when fitting ratios. Based on the above results at top AGS energy, we conclude that the extracted volume at the lower energies is overestimated by a factor of 2.9.
| data set | (MeV) | (MeV) | (fm3) | (MeV) | (MeV) | |||
|---|---|---|---|---|---|---|---|---|
| NA44+NA57 | 174 | 240 | 750 | 24.2/10 | 174 | 240 | 750 | 0.28 |
| NA49 | 158 | 231 | 1250 | 56.2/10 | 160 | 225 | 1150 | 0.44 |
| combined | 164 | 234 | 1000 | 105/23 | 168 | 234 | 900 | 1.10 |
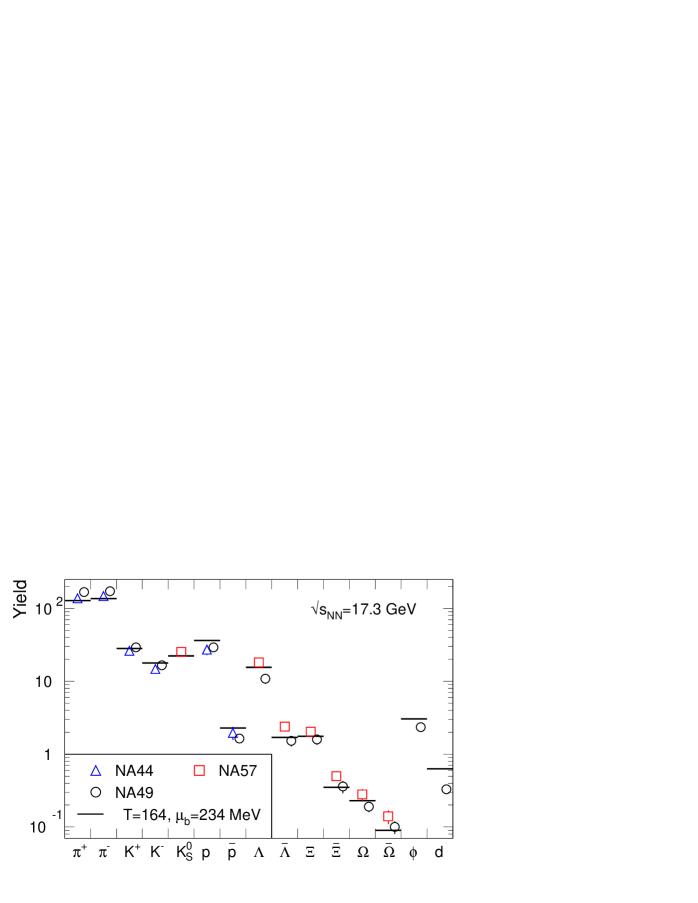
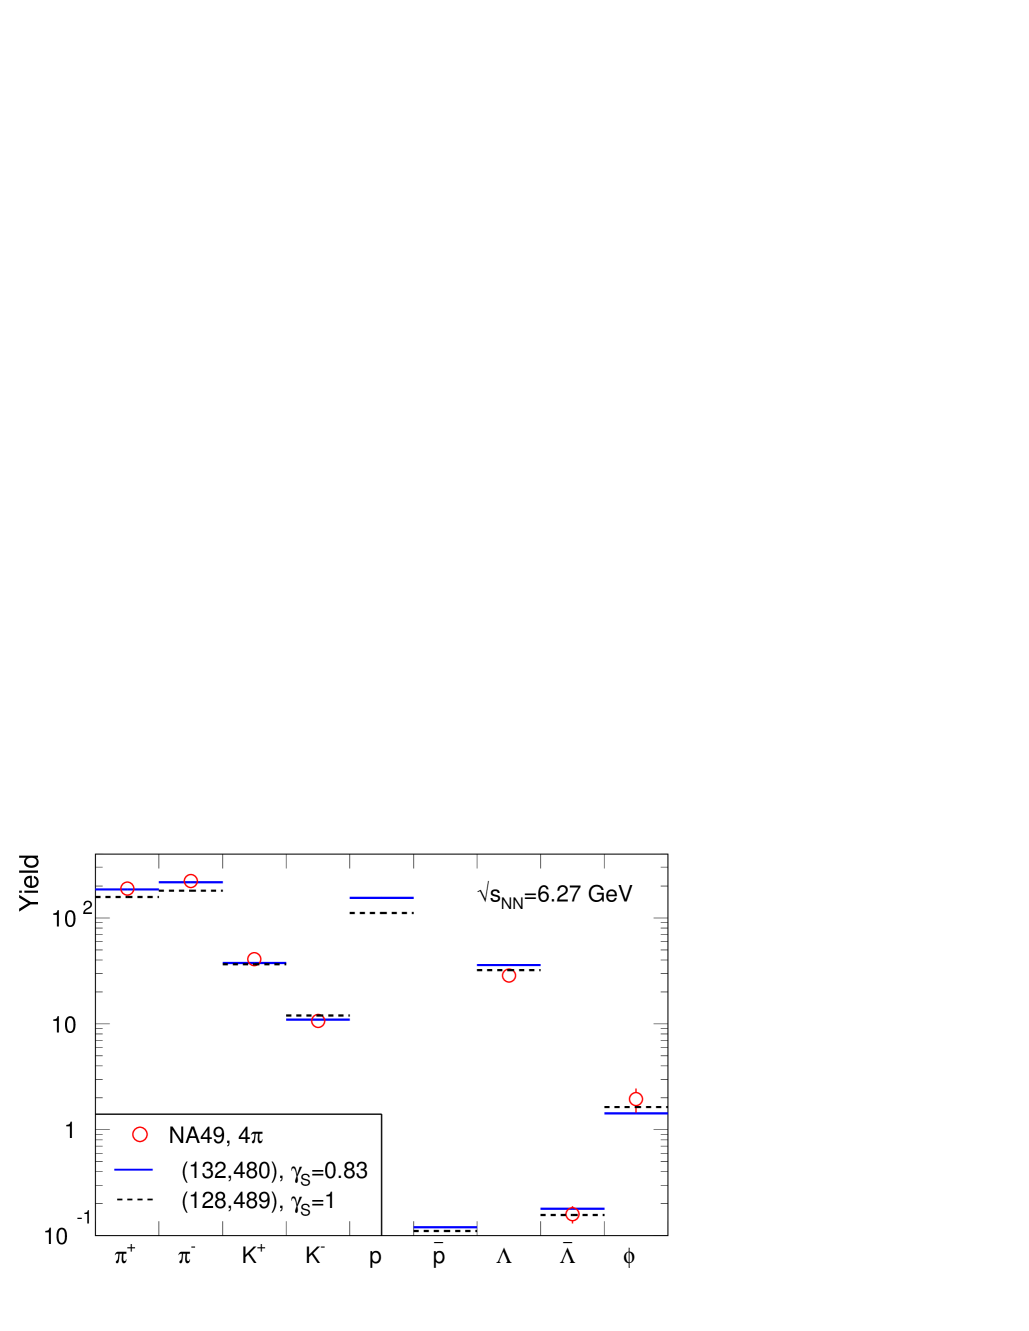
The comparison of mid-rapidity yields and the best fit for the top SPS energy is shown in Fig. 22. The temperature is slightly higher than in case of ratios, but this is within 1- errors. The discrepancy between different data sets noted in case of ratios is evident also for the yields. As for the ratios, this leads to contradictory results when fitting the data separately, see Table 4. The quality of the fits is for all SPS energies significantly poorer than in case of ratios.
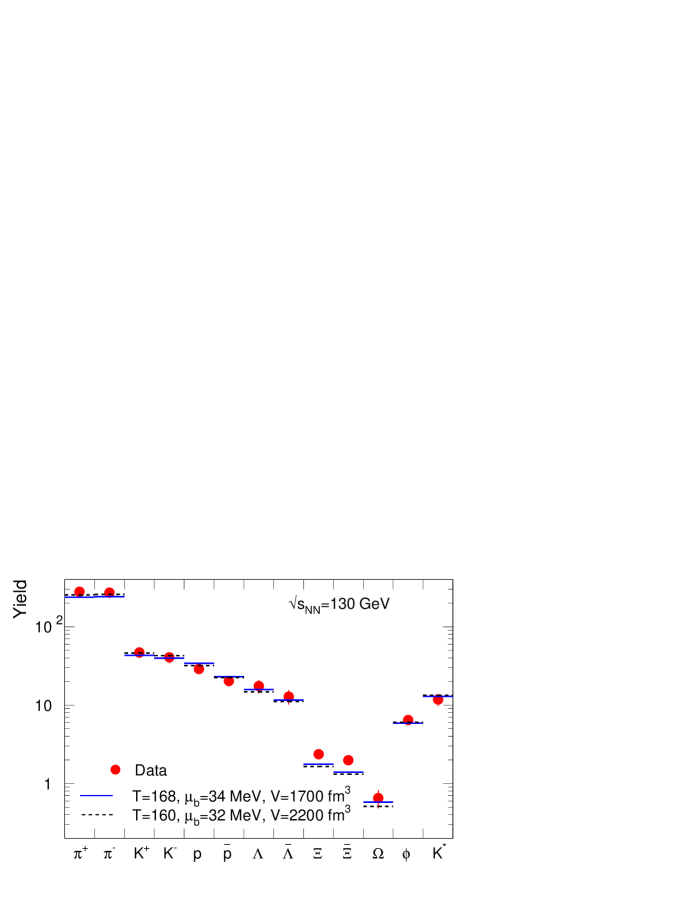
At the RHIC energy of =130 GeV, Fig. 23, the resulting temperature from the fits of absolute yields is slightly higher than in case of ratios. This, as well as a poorer =15.3/10, is mainly due to an apparent experimental upward bias of the yield of the (and, to a lesser extent, ) hyperons. Without ’s in the fit: =160 MeV, =32 MeV, =2200 fm3, =4.3/8.
The main results for the best fits of absolute hadron yields are summarized in Table 5. The upper part in Table 5 is for the fits using mid-rapidity data, the lower part is for data integrated over 4. The fits of yields give similar temperatures as for ratios, but larger values for baryo-chemical potentials and larger values. One notices that, in general, is close to or below unity, being significantly above unity only for the SPS energies, as for the case using ratios of yields. For all energies, the values are larger than in case of the fits of ratios. This is expected, as part of the discrepancy between data and model is cancelled in the ratios, for instance in case of antiparticle/particle ratios. These results demonstrate that the use of ratios is less prone to biases. This is one of the reasons why we prefer to fit particle ratios rather than yields.
| (GeV) | |||||||||||
|---|---|---|---|---|---|---|---|---|---|---|---|
| 2.70 | 64 | 760 | 5880 | 1.19/2 | 64 | 760 | 5900 | 0.013 | +13,-2 | 23 | 140 |
| 3.32 | 78 | 669 | 6280 | 0.54/3 | 78 | 670 | 6200 | 0.003 | +16,-3 | 20 | 230 |
| 3.84 | 88 | 610 | 5290 | 1.62/3 | 88 | 610 | 5200 | 0.020 | +18,-3 | 19 | 220 |
| 4.30 | 94 | 588 | 4940 | 1.5/3 | 96 | 575 | 4400 | 0.026 | +19,-3 | 17 | 540 |
| 4.85 | 132 | 546 | 900 | 10.3/7 | 132 | 540 | 900 | 0.13 | 4 | 11 | 170 |
| 8.76 | 154 | 382 | 850 | 51/13 | 160 | 418 | 700 | 0.69 | 6 | 36 | 250 |
| 12.3 | 150 | 277 | 1300 | 47/5 | 152 | 265 | 1300 | 0.18 | 5 | 12 | 300 |
| 17.3 | 164 | 234 | 1000 | 105/23 | 168 | 234 | 900 | 1.10 | 6 | 11 | 250 |
| 130 | 168 | 34 | 1700 | 15.3/10 | 170 | 34 | 1600 | 0.24 | 4 | 6 | 220 |
| 6.27 | 128 | 489 | 3850 | 15.9/4 | 128 | 453 | 4200 | 0.10 | 3 | 36 | 450 |
| 7.62 | 138 | 471 | 3450 | 27/4 | 142 | 474 | 2900 | 0.22 | 4 | 13 | 550 |
| 8.76 | 136 | 426 | 4600 | 56/6 | 140 | 366 | 4100 | 0.60 | 5 | 60 | 500 |
| 12.3 | 146 | 373 | 5400 | 61/4 | 148 | 298 | 4800 | 0.30 | 6 | 75 | 750 |
| 17.3 | 148 | 228 | 6100 | 64/9 | 152 | 210 | 5700 | 0.51 | 5 | 22 | 650 |
B. Inclusion of into the fits
In Table 6, we present results obtained with mid-rapidity and 4-integrated yields with a thermal model including a strangeness suppression factor . The results for the mid-rapidity data demonstrate that the key quantities, namely and , are very little influenced by whether or not is included as a fit parameter. Also, the quality of the fits is not significantly improved by including .
| (GeV) | ||||||||||
|---|---|---|---|---|---|---|---|---|---|---|
| 8.76 | 156 | 386 | 800 | 0.94 | 48/12 | 160 | 414 | 700 | 0.95 | 0.59 |
| 12.3 | 144 | 265 | 1900 | 0.84 | 32/4 | 152 | 265 | 1300 | 0.93 | 0.18 |
| 17.3 | 162 | 231 | 1100 | 0.96 | 102/23 | 168 | 231 | 900 | 1.0 | 1.12 |
| 6.27 | 132 | 480 | 3600 | 0.83 | 9.0/3 | 128 | 450 | 4300 | 0.94 | 0.10 |
| 7.62 | 140 | 448 | 3850 | 0.81 | 10.6/3 | 142 | 444 | 3550 | 0.75 | 0.08 |
| 8.76 | 152 | 418 | 3000 | 0.74 | 7.0/5 | 152 | 418 | 3200 | 0.69 | 0.04 |
| 12.3 | 162 | 340 | 3400 | 0.71 | 5.9/3 | 158 | 322 | 4000 | 0.70 | 0.023 |
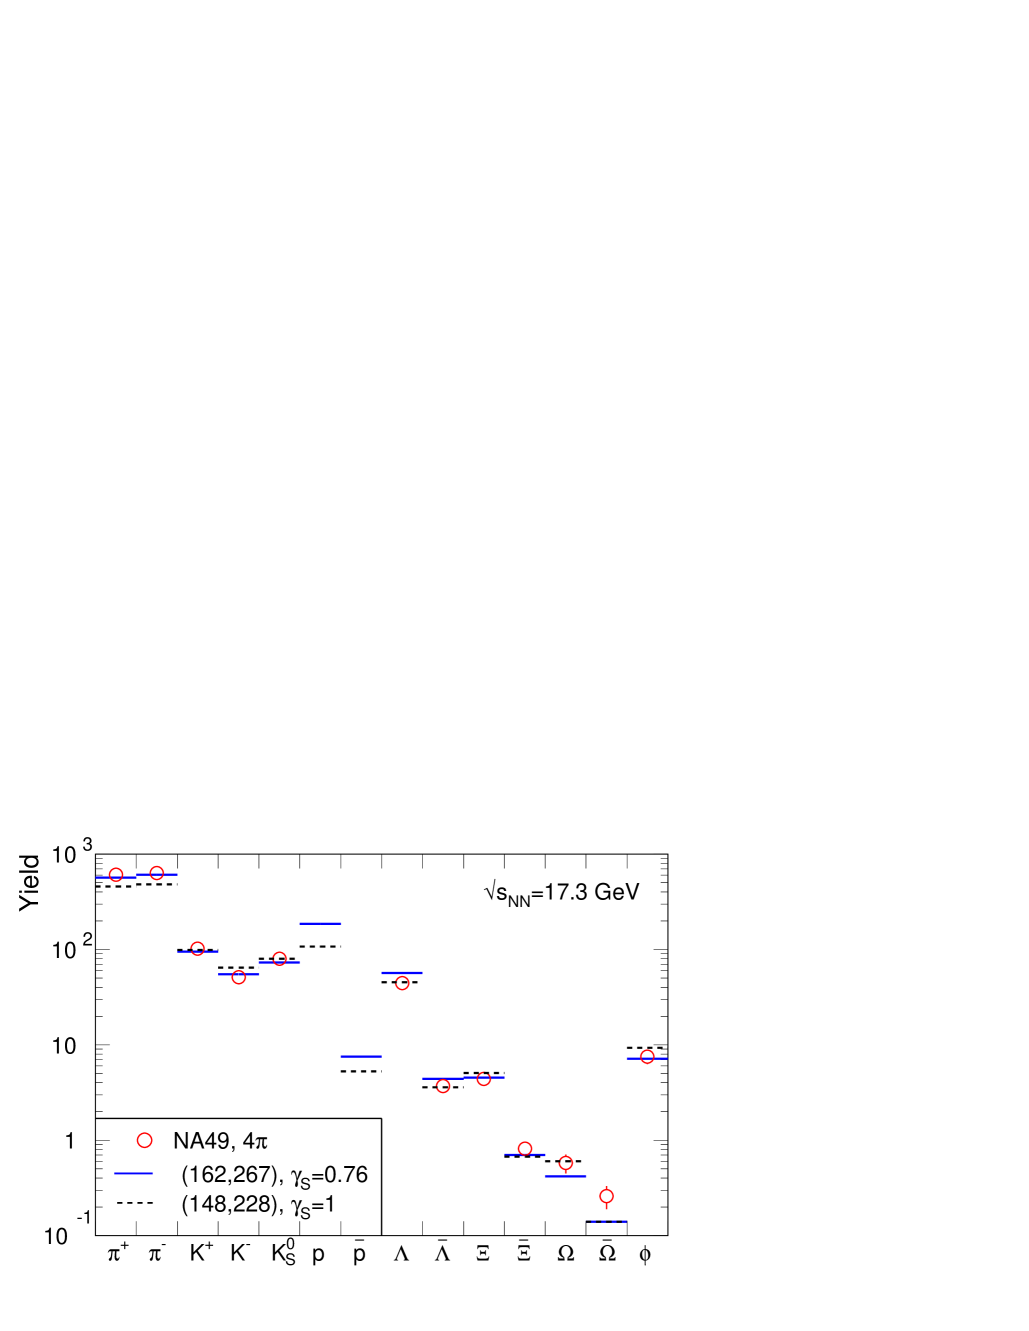
| 17.3 | 162 | 267 | 4600 | 0.76 | 17.6/8 | 162 | 258 | 4300 | 0.84 | 0.85 |
|
|
The fits of 4 yields including leads to a substantial improvement of the fit quality only for the higher SPS energies, but still the fit seldom attains a good quality. For these energies, the resulting (and also ) values are larger than in the case without (Table 5). This effect is negligible for the lowest SPS energy and increases gradually as a function of energy, see Table 6. This is illustrated in Fig. 24 for the lowest and highest SPS beam energies. Contrary to expectations, the volume and show a non-monotonic behavior as a function of energy (also apparent in the analysis of Becattini et al. [20]). In view of this, we regard and as compensatory parameters for an inadequate fit of 4 data. As a consequence, the fact that the temperatures from the fits of 4 data using are very similar to those extracted from fits of mid-rapidity data should be viewed as a coincidence.
C. Importance of feed-down from weakly decaying states
In Fig. 25 we show, as a function of energy, the contribution of weak decays to the yields of pions, protons and hyperons calculated with the parametrizations for and (Eqs. 6 and 7 in Section 4). Shown is the fraction of the total yield of these particles originating from weak decays. This fraction reaches the asymptotic values of 15%, 25% and 35% for , and , respectively, being significantly larger in case of antiparticles at AGS and SPS energies. Since this contribution is sizeable, a consistent comparison between data and model is required.
![[Uncaptioned image]](/html/nucl-th/0511071/assets/x42.png)
|
|
References
- [1] P. Braun-Munzinger, K. Redlich, J. Stachel, in Quark Gluon Plasma 3, Eds. R. Hwa, X.-N. Wang, (World Scientific, Singapore, 2004) p. 491 [nucl-th/0304013].
- [2] P. Braun-Munzinger, J. Stachel, J.P. Wessels, N. Xu, Phys. Lett. B344 (1995) 43 [nucl-th/9410026], Phys. Lett. B365 (1996) 1 [nucl-th/9508020].
- [3] J. Cleymans, D. Elliott, A. Keranen, E. Suhonen, Phys. Rev. C 57 (1998) 3319 [nucl-th/9711066]; J. Cleymans, H. Oeschler, K. Redlich, Phys. Rev. C 59 (1999) 1663 [nucl-th/9809027].
- [4] R. Averbeck, R. Holzmann, V. Metag, R.S. Simon, Phys. Rev. C 67 (2003) 024903 [nucl-ex/0012007].
- [5] P. Braun-Munzinger, I. Heppe, J. Stachel, Phys. Lett. B 465 (1999) 15 [nucl-th/9903010].
- [6] P. Braun-Munzinger, D. Magestro, K. Redlich, J. Stachel, Phys. Lett. B 518 (2001) 41 [nucl-th/0105229].
- [7] W. Broniowski, W. Florkowski, M. Michalec, Acta Phys. Polon. B33 (2002) 761 [nucl-th/0106009]; W. Broniowski, W. Florkowski, Phys. Rev. C 65 (2002) 064905 [nucl-th/0112043].
- [8] M. Kaneta, N. Xu, nucl-th/0405068.
- [9] J. Adams et al. (STAR), Nucl. Phys. A 757 (2005) 102 [nucl-ex/0501009].
- [10] P. Braun-Munzinger, J. Stachel, Nucl. Phys. A 638 (98) 3c [nucl-ex/9803015].
- [11] J. Cleymans, K. Redlich, Phys. Rev. Lett. 81 (1998) 5284 [nucl-th/9808030]; Phys. Rev. C 60 (1999) 054908 [nucl-th/9903063].
- [12] Z. Fodor, S.D. Katz, JHEP 404 (2004) 50 [hep-lat/0402006].
- [13] C.R. Allton, S. Ejiri, S.J. Hands, O. Kaczmarek, F. Karsch, E. Laermann, Ch. Schmidt, L. Scorzato, Phys. Rev. D 66 (2002) 074507 [hep-lat/0204010].
- [14] P. de Forcrand, O. Philipsen, Nucl. Phys. B 642 (2002) 290 [hep-lat/0205016].
- [15] R. Stock, Phys. Lett. B 456 (1999) 277 [hep-ph/9905247].
- [16] P. Braun-Munzinger, J. Stachel, Ch. Wetterich, Phys. Lett. B 596 (2004) 61 [nucl-th/0311005].
- [17] M.A. Stephanov, Prog. Theor. Phys. Suppl. 153 (2004) 139 [hep-ph/0402115].
- [18] F. Karsch, J. Phys. G 31 (2005) S633 [hep-lat/0412038].
- [19] O. Philipsen, PoS LAT2005 (2005) 016 [hep-lat/0510077].
- [20] F. Becattini, M. Gaździcki, A. Keranen, J. Manninen, R. Stock, Phys. Rev. C 69 (2004) 024905 [hep-ph/0310049]; J. Manninen, F. Becattini, M. Gaździcki, hep-ph/0511092.
- [21] J. Letessier, J. Rafelski, nucl-th/0504028.
- [22] P. Braun-Munzinger, J. Stachel, J. Phys. G 28 (2002) 1971 [nucl-th/0112051] (see also P. Braun-Munzinger, nucl-ex/0508024).
- [23] A. Tawfik, hep-ph/0410392.
- [24] J. Cleymans, H. Oeschler, K. Redlich, S. Wheaton, hep-ph/0511094.
- [25] J. Cleymans, H. Oeschler, K. Redlich, S. Wheaton, Phys. Lett. B 615 (2005) 50 [hep-ph/0411187].
- [26] P. Braun-Munzinger, J. Cleymans, H. Oeschler, K. Redlich, Nucl. Phys. A 697 (2002) 902 [hep-ph/0106066].
- [27] F. Becattini, G. Passaleva, Eur. Phys. J. C 23 (2002) 551 [hep-ph/0110312].
- [28] A. Andronic, P. Braun-Munzinger, K. Redlich, Nucl. Phys. A 765 (2006) 211 [nucl-th/0506083].
- [29] S. Eidelman et al., Phys. Lett. B 592 (2004) 1.
- [30] F. Karsch, K. Redlich, A. Tawfik, Eur. Phys. J. C 29 (2003) 549 [hep-ph/0303108], Phys. Lett. B 571 (2003) 50 [hep-ph/0306208].
- [31] M. Michalec, W. Florkowski, W. Broniowski, Phys. Lett. B 520 (2001) 213 [nucl-th/0103029].
- [32] D. Zschiesche, S. Schramm, J. Schaffner-Bielich, H. Stöcker, W. Greiner, Phys. Lett. B 547 (2002) 7 [nucl-th/0209022].
- [33] G.E. Brown, M. Rho, Phys. Rep. 363 (2002) 85.
- [34] V. Koch, J. Phys. G 30 (2004) S41 [nucl-th/0306037].
- [35] W. Weinhold, B. Friman, W. Nörenberg, Phys. Lett. B 433 (1998) 236 [nucl-th/9710014].
- [36] D.H. Rischke, M.I. Gorenstein, H. Stöcker, W. Greiner, Z. Phys. C 51 (1991) 485.
- [37] G.D. Yen, M.I. Gorenstein, W. Greiner, S.N. Nang, Phys. Rev. C 56 (1997) 2210 [nucl-th/9711062].
- [38] F. Becattini, Z. Phys. C 69 (1996) 485; F. Becattini, U. Heinz, Z. Phys. C 76 (1997) 269 [hep-ph/9702274].
- [39] J. Cleymans, K. Redlich, E. Suhonen, Z. Phys. C 51 (1991) 137.
- [40] G. Torrieri et al., Comp. Phys. Comm. 167 (2005) 229 [nucl-th/0404083].
- [41] S. Wheaton, J. Cleymans, hep-ph/0407174.
- [42] A. Kisiel, T. Taluc, W. Broniowski, W. Florkowski, Comp. Phys. Comm. 174 (2006) 669 [nucl-th/0504047].
- [43] D. Miśkowiec, private communication (http://www.gsi.de/misko/overlap/).
- [44] L.V. Bravina et al., Phys. Rev. C 60 (1999) 024904 [hep-ph/9906548].
- [45] J.L. Klay et al. (E895), Phys. Rev. Lett. 88 (2002) 102301; J.L. Klay, PhD Thesis, UC Davis (2001).
- [46] B.B. Back et al. (E917), Phys. Rev. Lett. 86 (2001) 1970 [nucl-ex/0003007]
- [47] J.L. Klay et al. (E895), Phys. Rev. C 68 (2003) 054905 [nucl-ex/0306033].
- [48] L. Ahle et al. (E866/E917), Phys. Lett. B 476 (2000) 1 [nucl-ex/9910008]; Phys. Lett. B 490 (2000) 53 [nucl-ex/0008010].
- [49] C. Pinkenburg et al. (E895), Nucl. Phys. A 698 (2002) 495c [nucl-ex/0104025].
- [50] P. Chung et al. (E895), Phys. Rev. Lett. 91 (2003) 202301 [nucl-ex/0302021].
- [51] J. Barrette et al. (E877), Phys. Rev. C 62 (2000) 024901 [nucl-ex/9910004].
- [52] L. Ahle et al. (E802), Phys. Rev. C 60 (1999) 064901.
- [53] L. Ahle et al. (E802), Phys. Rev. C 58 (1998) 3523.
- [54] S. Albergo et al. (E896) Phys. Rev. Lett. 88 (2002) 062301.
- [55] B.B. Back et al. (E917), Phys. Rev. C 69 (2004) 054901 [nucl-ex/0304017].
- [56] B.B. Back et al. (E917), Phys. Rev. Lett. 87 (2001) 1970.
- [57] I.G. Bearden et al. (NA44), Phys. Rev. C 66 (2002) 044907 [nucl-ex/0202019].
- [58] S.V. Afanasiev et al. (NA49), Phys. Rev. C 66 (2002) 054902 [nucl-ex/0205002].
- [59] S.V. Afanasiev et al. (NA49), Phys. Rev. C 69 (2004) 024902.
- [60] C. Alt et al. (NA49), nucl-ex/0512035.
- [61] T. Anticic et al. (NA49), Phys. Rev. Lett. 93 (2004) 022302 [nucl-ex/0311024].
- [62] S.V. Afanasiev et al. (NA49), Phys. Lett. B 538 (2002) 275 [nucl-ex/9810005].
- [63] C. Alt et al. (NA49), Phys. Rev. Lett. 94 (2005) 192301 [nucl-ex/0409004].
- [64] F. Antinori et al. (NA57), Phys. Lett. B 595 (2004) 68 [nucl-ex/0403022].
- [65] F. Antinori et al. (NA57), J. Phys. G 31 (2005) 1345 [nucl-ex/0509009].
- [66] S.V. Afanasiev et al. (NA49), Phys. Lett. B 491 (2000) 59.
- [67] H. Bøggild, private communication.
- [68] C. Nonaka, M. Asakawa, Phys. Rev. C 71 (2005) 044904 [nucl-th/0410078]; M. Asakawa, C. Nonaka, nucl-th/0509091.
- [69] A. Dumitru, L. Portugal, D. Zschiesche, Phys. Rev. C 73 (2006) 024902 [nucl-th/0511084].
- [70] K. Adcox et al. (PHENIX), Phys. Rev. Lett. 88 (2002) 242301 [nucl-ex/0112006], and Phys. Rev. C 69 (2004) 024904 [nucl-ex/0307010].
- [71] K. Adcox et al. (PHENIX), Phys. Rev. Lett. 89 (2002) 092302 [nucl-ex/0204007].
- [72] J. Adams et al. (STAR), Phys. Rev. Lett. 92 (2004) 182301 [nucl-ex/0307024].
- [73] J. Adams et al. (STAR), Phys. Lett. B 567 (2003) 167 [nucl-ex/0206008].
- [74] C. Adler et al. (STAR), Phys. Rev. C 65 (2002) 041901(R).
- [75] C. Adler et al. (STAR), Phys. Rev. C 66 (2002) 061901 [nucl-ex/0205015].
- [76] S.S. Adler et al. (PHENIX), Phys. Rev. C 69 (2004) 034909 [nucl-ex/0307022].
- [77] J. Adams et al. (STAR), Phys. Rev. Lett. 92 (2004) 112301 [nucl-ex/0310004].
- [78] I. Arsene et al. (BRAHMS), Phys. Rev. C 72 (2005) 014908 [nucl-ex/0503010].
- [79] J. Adams et al. (STAR), Phys. Lett. B 612 (2005) 181 [nucl-ex/0406003].
- [80] S.S. Adler et al. (PHENIX), Phys. Rev. C 72 (2005) 014903 [nucl-ex/0410012].
- [81] J. Adams et al. (STAR), Phys. Rev. C 71 (2005) 064902 [nucl-ex/0412019].
- [82] S.S. Adler et al. (PHENIX), Phys. Rev. Lett. 94 (2005) 122302 [nucl-ex/0406004].
- [83] A. Billmeier et al. (STAR), J. Phys. G 30 (2004) S363.
- [84] H. Zhang (STAR), nucl-ex/0403010.
- [85] O. Barannikova (STAR), nucl-ex/0403014.
- [86] C. Markert et al. (STAR), J. Phys. G 31 (2005) S169 [nucl-ex/0503013].
- [87] D. Adamova et al. (CERES), Phys. Rev. Lett. 90 (2003) 022301 [nucl-ex/0207008]; for a recent review, see M. Lisa, S. Pratt, R. Soltz, U. Wiedemann, Ann. Rev. Nucl. Part. Sci. 55 (2005) 357 [nucl-ex/0505014].
- [88] L. Ruan et al. (STAR), J. Phys. G 31 (2005) S1029 [nucl-ex/0503015].
-
[89]
V. Friese (NA49), J. Phys. G 31 (2005) S911 [nucl-ex/0412013];
see the compilation of NA49 data available at:
http://na49info.cern.ch/na49/Archives/Data/NA49NumericalResults/na49_compil.pdf - [90] A. Marín (NA45/CERES), J. Phys. G 30 (2004) S709 [nucl-ex/0406007].
- [91] M. Gaździcki, M.I. Gorenstein, Acta Phys. Polon. B30 (1999) 2705 [hep-ph/9803462].
- [92] M. Gaździcki, J. Phys. G 30 (2004) S161 [hep-ph/0305176].
- [93] E. Bratkovskaya et al., Phys. Rev. C 69 (2004) 054907 [nucl-th/0402026].
- [94] V. Koch, A. Majumder, J. Randrup, Phys. Rev. C 72 (2005) 064903 [nucl-th/0509030].
- [95] F. Wang, H. Liu, H. Sorge, N. Xu, J. Yang, Phys. Rev. C 61 (2000) 064904 [nucl-th/9909001].
- [96] P. Braun-Munzinger, Nucl. Phys. A 661 (1999) 261c [nucl-ex/9908007].
- [97] A. Tawfik, Phys. Rev. D 71 (2005) 054502 [hep-ph/0412336].
- [98] J. Stachel, nucl-ex/0510077.