\runtitleProbing Quark Gluon Liquid using Transverse Momentum Fluctuations \runauthorS. Gavin
Probing Quark Gluon Liquid Using Transverse Momentum Fluctuations
Abstract
The onset of equilibration of partons in nuclear collisions may lead to related trends in the centrality dependence of , fluctuations, and net charge fluctuations [1]. We extend the transport description of ref. [1] to include radial flow.
1 INTRODUCTION
Liquids exhibit shorter correlation lengths than gases. Correlation and fluctuation measurements can therefore reveal the state – liquid or gaseous – of the matter produced in heavy ion collisions, but we must first sort out the ion-collision effects that also contribute. Experiments show that dynamic fluctuations of the transverse momentum are roughly independent of beam energy, but increase as centrality increases [2, 3, 4, 5]. Local equilibration can explain this behavior [1], but flow and jet explanations have also been suggested [2, 5]. Certainly all effects play a role at some level. It is therefore important to describe all of them in a common framework. We take a modest step in this direction by extending the formulation in [1] to account for contributions from radial flow.
Dynamic fluctuations are obtained from the measured fluctuations by subtracting the statistical value expected in global equilibrium [2]. For particles of momenta and , dynamic multiplicity fluctuations are characterized by
| (1) |
where is the event average. This quantity depends only on the two-body correlation function . It is obtained from the multiplicity variance by subtracting its Poisson value . For dynamic fluctuations one similarly finds
| (2) |
where . CERES and STAR measure this observable, while PHENIX measures , where .
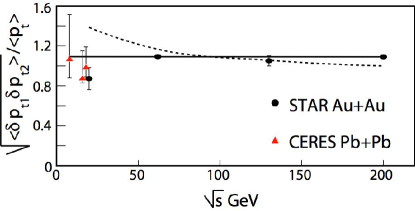
Figure 1 shows the ratio for central collisions as a function of beam energy as compiled in [2] from CERES and STAR data [3, 4]. The data suggest that the source of fluctuations is independent of energy, although uncertainties are large. This energy independence suggests that jets are not the leading contribution to fluctuations.
2 THERMALIZATION
In [1], the Boltzmann transport equation is used to show that thermalization alters the average transverse momentum according to
| (3) |
where is the probability that a particle escapes the collision volume without scattering. The initial value is determined by the particle production mechanism. If the number of collisions is small, implies a random-walk-like increase of relative to . As centrality increases, the system lifetime and both increase, eventually to a point where local equilibrium is reached. Correspondingly, the survival probability in (3) decreases with increasing centrality. The average increases for more central collisions to the point where local equilibrium is established. The behavior in events beyond that centrality depends on how the subsequent hydrodynamic evolution changes as the lifetime increases, as discussed in the next section.
Dynamic fluctuations depend on two-body correlations and, correspondingly, are quadratic in . In [1], Langevin noise is added to the Boltzmann equation to describe the fluctuations of the phase space distribution. If the initial correlations are not far from the local equilibrium value, we find
| (4) |
As before, the initial quantity is determined by the particle production mechanism, while describes the system near local equilibrium.
Near local equilibrium, spatial correlations occur because the fluid is inhomogeneous – it is more likely to find particles where the density is high. The mean at each point is proportional to the temperature , so that
| (5) |
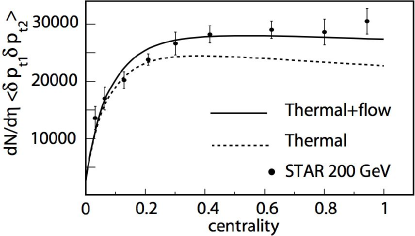
where is the spatial correlation function and . Our comparison to the STAR data computed in [1] is shown in fig. 2.
To see how the energy dependence of from (5) compares to the data, observe that [1] finds
| (6) |
where is the scaled variance (1). The dimensionless quantity depends on the ratio of the correlation length to the transverse size. In [1], we took and to be energy independent. Therefore, if matter is locally equilibrated in the most central collisions, we would obtain the solid line in fig. 1.
We do not expect to vary strongly with energy unless the correlation length changes, e.g., from a liquid to a gas value. In addition, we expect the scaled variance to vary primarily with the number of participants and, hence, to be roughly independent of energy. For comparison, the dashed curve in fig. 1 shows an ad hoc dependence on the measured multiplicity.
3 FLOW
Thermalization describes the fluctuations measured by STAR [4] in peripheral collisions as shown in fig. 2, but model calculations fall short of the data for the most central collisions. One explanation of this discrepancy is the appearance of radial collective flow in the nearly-thermalized central collisions. Radial flow was omitted in [1], which only addressed longitudinal expansion. Flow arises when pressure gradients within the fluid cause it to move outward with an average local velocity. This collective motion requires the fluid to be sufficiently near local equilibrium that each fluid cell can respond to the different pressures of nearby cells.
To see how flow fits into our transport framework, consider a test particle traveling through the medium. As the system begins to thermalize, the test particle undergoes a random walk so that its root-mean-square increases. At the same time, all of the other particles are experiencing their own random walks in both position and momentum space. On average, the walk in position space directs particles radially outward with an average drift velocity , taking along the test particle. Collective flow builds as more of the particles encountered by the test particle are moving radially outward. We expect this effect to be most important in central collisions, since the system lives longer and particles have more time to interact.
A simple way to describe flow is to introduce an average radial parton drift velocity . This drift causes a radial blue-shift for massless partons, so that the parton Boltzmann distribution is , where . The average and its fluctuations near equilibrium then satisfy
| (7) |
Observe that is independent of the flow velocity ; fig. 1 is unaffected. We obtain the mean velocity as a function of centrality by fitting the measured by PHENIX for pions while using the same as before [6]. The net effect of including velocity in (7) is to compensate the longitudinal cooling.
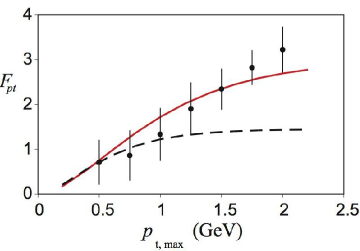
By including flow we describe the data for the full centrality range, see fig. 3. Flow effects are further exhibited by measuring fluctuations in the acceptance region GeV as a function of following PHENIX [5]. Observe that (6) implies . The multiplicity grows strongly as is increased, since is the integral of over the acceptance. To see that is independent of , let be the probability that a particle falls in the acceptance region and be the probability that it is missed. The average number of detected particles is . For a binomial distribution, one has . Equation (1) then implies that , the value for full acceptance.
The dashed curve in fig. 4 is computed from (6) at a freeze out temperature fixed by the measured . The solid curve includes flow through and fits the data much better.
In summary, we find that flow is an important aspect of the multiple scattering contribution to fluctuations in central collisions. The flow and thermalization contributions are essentially independent of beam energy in accord with data [2]. Any jet contribution to this phenomena would be tightly constrained by these data [6].
References
- [1] S. Gavin, Phys. Rev. Lett. 92, 162301 (2004); J. Phys. G 30, S1385 (2004).
- [2] C. Pruneau, Proc. Quark Matter 2005, and references therein.
- [3] D. Adamova et al. [CERES Collaboration], Nucl. Phys. A 727, 97 (2003).
- [4] J. Adams et al. [STAR Collaboration], Phys. Rev. C, in press; arXiv:nucl-ex/0504031; Phys. Rev. C 71, 064906 (2005).
- [5] S. S. Adler et al. [PHENIX Collaboration], Phys. Rev. Lett. 93, 092301 (2004).
- [6] Mohamed Abdel-Aziz, Ph.D. Thesis, Wayne State University (2005).