Extended Optical Model Analyses of
Elastic Scattering, Direct Reaction, and Fusion
Cross Sections for the 9Be+208Pb System
at Near-Coulomb-Barrier Energies
W. Y. So
Laboratory of Cyclotron Application,
Korea Institute of Radiological and Medical Sciences, Seoul 139-706, Korea
S. W. Hong, and B. T. Kim
Department of Physics and Institute of Basic Science,
Sungkyunkwan University, Suwon 440-746, Korea
T. Udagawa
Department of Physics, University of Texas, Austin, Texas 78712
Abstract
Based on the extended optical model approach in which the polarization potential is decomposed into direct reaction (DR) and fusion parts, simultaneous analyses are performed for elastic scattering, DR, and fusion cross section data for the 9Be+208Pb system at near-Coulomb-barrier energies. Similar analyses are also performed by only taking into account the elastic scattering and fusion data as was previously done by the present authors, and the results are compared with those of the full analysis including the DR cross section data as well. We find that the analyses using only elastic scattering and fusion data can produce very consistent and reliable predictions of cross sections particularly when the DR cross section data are not complete. Discussions are also given on the results obtained from similar analyses made earlier for the 9Be+209Bi system.
PACS numbers : 24.10.-i, 25.70.Jj
I Introduction
In our recent study so1 , we have carried out simultaneous analyses of elastic scattering and fusion cross section data for the 6Li+208Pb kee1 ; wu1 ; das1 and 9Be+209Bi sig1 ; sig2 systems at near-Coulomb-barrier energies in the framework of an extended optical model uda1 ; hong ; uda2 by introducing two types of complex polarization potentials: the direct reaction (DR) and fusion potentials. In such analyses, it is indispensable and essential to include the experimental data for the total DR cross section and the fusion cross section , in addition to the elastic scattering cross section for the separate determination of the DR and fusion potentials. However, when the previous study was made so1 , reliable data of for 6Li+208Pb and 9Be+209Bi were not available, and thus the analyses were proceeded in two steps. In the first step, we carried out analyses of only the elastic scattering data by assuming just one simple Woods-Saxon type complex potential. Using the potential parameters thus fixed, we could then generate the total reaction cross section , which we called the semi-experimental total reaction cross section . As has been shown in a number of publications, such predicted from the optical potential that fits the elastic scattering data usually reproduces very well. This is the case for reactions induced by the proton mcc1 ; eli1 , the deuteron auc1 , the -particle sin1 , and also heavy-ions kol1 . We then used to further extract semi-experimental total DR cross sections by using the relation . In the second step, use was made of thus extracted in place of the experimental DR cross section to carry out simultaneous analyses of , , and for determining the full extended optical model potential composed of two polarization potentials.
The DR and fusion potentials thus determined revealed interesting characteristic features of these potentials. First of all, both potentials satisfy separately the dispersion relation maha . Secondly, the fusion potential is found to exhibit a threshold anomaly maha ; naga , as was observed for tightly bound projectiles bae1 ; lil1 ; ful1 , but the DR potential does not show a pronounced threshold anomaly. Thirdly at the strong absorption radius, the magnitudes of the fusion potential were found to be much smaller than those of the DR potential. As a consequence, the resulting total polarization potential dominated by the DR potential becomes rather smooth as a function of the incident energy. This has solved a long standing puzzle why the threshold anomaly has not been seen in the polarization potentials determined for the systems involving a loosely bound projectile such as 6Li and 9Be kee1 ; sig1 .
The extracted DR potentials have provided us with a unique opportunity to study the effects of breakup (DR) on fusion by comparing calculated from either including or neglecting the real and the imaginary part of the DR potential. Such studies were made in Ref. so1 , which showed that in the sub-barrier region, breakup is not the main reason for the subbarrier enhancement of and that the mechanism that governs the enhancement is neutron flow as originally suggested by Stelson et al. stel . In our approach, this effect is phenomenologically implemented in the imaginary part of the DR potential. On the other hand, in the above barrier region, the breakup suppresses and the observed suppression factors for 6Li and 9Be were fairly well accounted for in terms of the breakup so1 .
After completing our work of Ref. so1 for 9Be + 209Bi system, elastic scattering data for 9Be + 208Pb, a system similar to 9Be + 209Bi, have become available woo1 . Thus, for 9Be + 208Pb system we now have data available for the elastic scattering woo1 and fusion das2 cross sections as well as the sum of cross sections of breakup, transfer, and incomplete fusion woo2 . For a loosely bound projectile like 9Be, we may assume the summed cross section thus observed as the total DR cross sections. This has provided us with an opportunity to carry out analyses taking into account all three sets of experimental data, i.e., the elastic scattering, DR, and fusion data. We can then compare these analysis results with those obtained by considering only two sets of data, i.e., the elastic scattering and fusion data without the experimental DR data. We shall henceforth call the case where all the three data sets are included in the analyses the EDF (elastic, DR, and fusion) approach, and the case where only two data sets are considered the EF (elastic scattering and fusion) approach. Note that in the EF approach we do, however, include , which is essential to fix the DR potential parameters. The aim of the present study is to make a comparison between these two approaches and study the validity of the EF method used in our previous work. By extending our EF method proposed in the previous work on 9Be + 209Bi to 9Be + 208Pb system, where we have DR data as well as elastic and fusion data, we shall show that the EF approach gives us very reliable predictions of cross sections.
In Sec. II, we first generate for the EF approach case by following the method described in Ref. so1 . Two types of analyses (EDF and EF) are then carried out in Sec. III and the results are compared and discussed in Sec. IV. Sec. V concludes the paper.
II Extracting semi-experimental DR cross section
Our method of generating resorts to the empirical fact brog that the total reaction cross section calculated from the optical model fit to the available elastic scattering cross section data, , usually agrees well with the experimental , in spite of the well known ambiguities in the optical potential. Let us call the total reaction cross section thus generated the semi-experimental reaction cross section . Then, is generated by
| (1) |
This approach seems to work even for loosely bound projectiles, as demonstrated recently by Kolata et al. kol1 for the 6He+209Bi system.
Following Ref. so1 , we first carry out rather simple optical model analyses of elastic scattering data solely for the purpose of deducing . For these preliminary analyses, we assume the optical potential to be a simple sum of two volume-type potentials and , where is the real, energy independent bare potential and is a complex potential with common geometrical parameters for both real and imaginary parts. The elastic scattering data are then fitted with a fixed radius parameter for and with three other parameters adjustable; the real and the imaginary strengths and and the diffuseness parameter . The fitting is done for three choices of the radius parameter; =1.3, 1.4, and 1.5 fm. These different choices of the -value are made in order to examine the dependence of the resulting on the value of .
| (MeV) | (MeV) | (mb) | (mb) | (mb) | (mb) | (mb) |
|---|---|---|---|---|---|---|
| 38 | 36.4 | 10 | 109 | 71 | 119 | 81 |
| 40 | 38.3 | 58 | 180 | 198 | 238 | 256 |
| 42 | 40.3 | 145 | 267 | 320 | 412 | 465 |
| 44 | 42.2 | 248 | 300 | 368 | 548 | 616 |
| 46 | 44.1 | 355 | 300 | 423 | 655 | 778 |
| 48 | 46.0 | 458 | 360 | 541 | 818 | 999 |
| 50 | 47.9 | 580 | 410 | 597 | 990 | 1177 |
As observed in Ref. so1 , the values of thus extracted for three different -values agree with the average within 1%, implying that is determined without much ambiguity. We then identified the average as the final value of . Using thus determined , we generated by employing Eq. (1). The resultant values of and are presented in Table I, together with das2 , woo2 , and . As seen from Table I, the values of and are systematically larger than the corresponding experimental values, except for the lowest energy of =36.4 MeV. The reason why is larger than except for the lowest energy may be ascribed to the fact that includes contributions from only breakup, transfer, and incomplete-fusion events woo2 , but not from inelastic scattering and other simple quasi-elastic processes such as pickups. The difference between and becomes larger with energy. It implies that there are more open, but not identified, DR channels as the incident energy increases.
It is worth remarking at this point that there is a reason to question the accuracy of the extracted value of at =36.4 MeV. The experimental value of the ratio of the elastic scattering to the Rutherford cross section at the forward angles are systematically larger than unity woo1 at this energy. The average value of at small angles is about 1.033. This suggests that there may be a problem in the overall normalization constant in the measured data. In fact, it is indicated woo1 that there are experimental uncertainties of a few percents in the absolute normalization. Even just a few percent uncertainty in the normalization is critical, particularly at low energies in extracting . In order to confirm this, we have reanalyzed the elastic scattering data by reducing the cross section by a factor of 1.033 so that the values of at forward angles become around unity. A new value of thus extracted turns out to be 122 mb, which in turn gives us =112 mb. This value is significantly greater than 71 mb given in Table I and is also larger than the experimental value of 109 mb. It is thus very plausible that the true values of and at this energy could be larger than and , respectively. However, in the present analyses, use is made of the values as listed in Table I.
III Simultaneous Analyses
Simultaneous analyses are then performed for two cases of data sets; (, , ) and (, , ) where , , and are from the literatures woo1 ; das2 ; woo2 . As mentioned in the Introduction, the former (latter) case with () is called the EDF (EF) analysis. In calculating the value, we simply assume 1% errors for all the experimental data. The 1% error is roughly the average of errors in the measured elastic scattering cross sections, but it is much smaller than the errors in the DR (5%) and fusion (10%) cross sections. The choice of the 1% error for DR and fusion cross sections is thus equivalent to increasing the weight for the DR and fusion cross sections in evaluating the -values by factors of 25 and 100, respectively. Such a choice of errors may be reasonable, since we have only one datum point for each of these cross sections, while there are more than 50 data points for the elastic scattering cross sections.
III.1 Necessary Formulae
The optical potential we use in the present work has the following form;
| (2) |
where is the usual Coulomb potential with =1.25 fm and is the bare (Hartree-Fock) nuclear potential. and are, respectively, fusion and DR parts of the polarization potential love originating from couplings to the respective reaction channels. Both and are complex and their forms are assumed to be of volume-type and surface-derivative-type hong ; kim1 , respectively. , , and are explicitly given by
| (3) |
| (4) |
and
| (5) |
where with is the usual Woods-Saxon function, while , , , and are the energy-dependent strength parameters. We assume the geometrical parameters of the real and imaginary potentials are the same, and thus the strength parameters and ( or ) are related through a dispersion relation maha ,
| (6) |
where P stands for the principal value and is the value of at a reference energy . Later, we will use Eq. (6) to generate the final real strength parameters and , after and are fixed from analyses. Note that the breakup cross section may include contributions from both Coulomb and nuclear interactions, which implies that the direct reaction potential includes effects coming from not only the nuclear interaction, but also the Coulomb interaction.
in Eq. (3) may also have an energy-dependence coming from the nonlocality due to the knockon-exchange contribution. We ignore such effects as they are expected to be small for heavy-ion scattering sat1 , and employ the real potential parameters used in Ref. wo77 assuming that all the unusual features of the potential may be put into the polarization parts, particularly in the DR part. The parameters used for are =18.36 MeV, =1.22 fm, and =0.57 fm wo77 . Note that this potential is shallow, which is often required in fitting elastic scattering data of such projectiles as 6Li and 9Be sat2 .
In performing the optical model calculation, one can evaluate and by using the following expression uda1 ; hong ; uda2 ; huss
| (7) |
where is the usual distorted wave function that satisfies the Schrödinger equation with the full optical model potential in Eq. (2). and are thus calculated within the same framework as is calculated. Such a unified description enables us to treat different types of reactions on the same footing.
III.2 Threshold Energies of Subbarrier Fusion and DR
As in Ref. so1 , we also utilize as an important ingredient the so-called threshold energies and of subbarrier fusion and DR, respectively, which are defined as zero intercepts of the linear representation of the quantities , defined by
| (8) |
where is a constant. with , i.e., is the quantity introduced originally by Stelson et al. stel , who showed that in the subbarrier region from the measured can be represented very well by a linear function of (linear systematics) as in Eq. (8). In Ref. kim1 , we extended the linear systematics to DR cross sections. In fact the DR data are also well represented by a linear function.
In Fig. 1(a), we present the experimental and . From the zeros of , one can deduce =30.0 MeV and 35.0 MeV. For both and , the observed are very well approximated by straight lines in the subbarrier region and thus can be extracted without much ambiguity. Another determination of can be made by using the semi-experimental DR cross section instead of the experimental DR cross section, as shown in Fig. 1(b). The resultant value, which we shall denote by is found to be MeV, close to .
III.3 Analyses
All the analyses performed in the present work are carried out by using as given in Subsec. III A and by using the fixed geometrical parameters for the polarization potentials, =1.40 fm, =0.30 fm, =1.50 fm, and =0.70 fm, which are close to the values used in our previous study so1 . Small changes of these values from the ones used in Ref. so1 are made in order to improve the -fitting.
As in Ref. so1 , the analyses are done in two steps; in the first step, all 4 strength parameters, , , and are varied. In this step, we have been able to fix the strength parameters of the DR potential, and , fairly well in the sense that the extracted and turn out to be smooth as functions of . This is particularly the case for the imaginary strength . The values of and are presented in Figs. 2 and 3 by open circles for the EDF and EF cases, respectively. It is remarkable that the resultant can be fairly well represented by the following function of (in units of MeV)
| (9) |
in the EDF case and
| (10) |
in the EF case. Note that the threshold energies where becomes zero are set equal to and as determined in the previous subsection and are indicated by the open half circles sitting on the axis of in Figs. 2 and 3. The dotted lines in the lower panels of Figs. 2 and 3 represent Eqs. (9) and (10), respectively. The dotted curves in the upper panels of Figs. 2 and 3 denote as predicted by the dispersion relation Eq. (6), with given by Eqs. (9) and (10), respectively. As seen, the dotted curves reproduce the open circles fairly well, indicating that and extracted by the analyses satisfy the dispersion relation.
In this first step of fitting, however, and are not well fixed in the sense that the extracted values fluctuate considerably as functions of . This is understandable from the expectation that the elastic scattering data can probe most accurately the optical potential in the peripheral region, which is nothing but the region characterized by the DR potential with fm. The part of the nuclear potential responsible for fusion with fm is thus difficult to pin down in this first step.
In order to obtain more reliable information on and , we have thus performed the second step of the analysis. This time, instead of doing a 4-parameter search we use and determined by the first step of fitting. But, rather than using and exactly as determined by the fitting, we use given by Eqs. (9) and (10) and given by the dispersion relation. We then have performed 2-parameter analyses, treating only and as adjustable parameters. The values thus determined are presented in Figs. 2 and 3 by solid circles. As seen, both and are determined to be fairly smooth functions of . The extracted may be represented by
| (11) |
in the EDF case and
| (12) |
in the EF case, respectively. As is done for , the threshold energy where becomes zero is set equal to and is indicated in Figs. 2 and 3 by the solid half circle on the axis of . As seen, the values determined by the second analyses are fairly well represented by the functions given by Eqs.(11) and (12). Note that the energy variations of and are quite rapid compared to those of and , and are similar to those observed in tightly bound projectiles bae1 ; lil1 ; ful1 .
Using given by Eqs. (11) and (12), one can generate from the dispersion relation. The results are shown by the solid curves in the upper panels of Figs. 2 and 3, which well reproduce the solid circles extracted from the -fitting. This means that the fusion potential determined from the present analysis satisfies the dispersion relation.
III.4 Final Calculated Cross Sections in Comparison with the Data
Using given by Eqs. (9) and (10) and given by Eqs. (11) and (12) together with and generated by the dispersion relation Eq. (6), we have performed the final calculations of the elastic, DR and fusion cross sections. Thus, instead of using the potential parameters just as extracted by the -analyses we have used these dispersive potentials for the final calculations. The results are presented in Figs. 4 and 5 in comparison with the experimental data. All the data are well reproduced by the calculations, though there are subtle differences between the fits obtained by two types of the analyses as will be discussed in detail in Subsec. IV B.
IV Discussions
IV.1 Fusion and DR Potentials
The characteristic features of the polarization potentials determined in the present analyses are very much similar to those obtained in our previous analyses so1 . The real and imaginary parts of both fusion and DR potentials satisfy well the dispersion relation, and the fusion potential displays the threshold anomaly. As already presented in Figs. 2 and 3, these features are seen in the strength parameters, , , and .
Another important feature of the extracted potentials is that at the strong absorption radius of =12.3 fm both the real and imaginary parts of the DR potential are considerably greater than those of the fusion potential, although the strength parameters and are smaller than and . Thus, the energy dependence of the net polarization potential (sum of the fusion and DR potentials) at becomes dominated by the DR potential which has a relatively smooth energy dependency. Consequently, the net potential does not show such a threshold anomaly as seen in the net potential for systems with tightly bound projectiles bae1 ; lil1 ; ful1 . However, after separating the polarization potential into DR and fusion parts, we clearly observe the characteristic threshold anomaly in the fusion potential.
IV.2 Comparison of EDF and EF Cross Sections
Both EDF and EF approaches reproduce the experimental elastic scattering cross sections very well as shown in Fig. 4. The calculated cross sections shown in the left and right panels of Fig. 4 agree well with each other. It may then be naturally expected that the resultant total reaction cross sections also agree with each other. This is indeed the case; the values of the calculated total reaction cross sections from the EDF approach are approximately equal to those from the EF approach, as shown by the dashed curves in Figs. 5(a) and (b).
Since is extracted from the fit to the elastic scattering data, our final calculation results using the dispersive potential naturally reproduce as shown by the dotted curves in Fig. 5(b). In the EF case, the calculations also reproduce both DR and fusion cross sections as well. This is, however, not the case for the EDF approach; calculations using the dispersive potential somewhat overestimates the experimental data of all three cross sections as Fig. 5(a) shows.
It may thus be concluded that the overall fit to the data obtained in the EF case is better than the EDF case and that the main source of problems in getting a good overall fit in the EDF case comes from inconsistency between the elastic scattering woo1 and the DR reaction woo2 data; the elastic scattering data require more absorption (larger total reaction cross section) than what the measured total absorption (reaction) cross sections tell us. In view of this, it is important that measurements be made of inelastic scattering and some other quasi-elastic reactions which are not taken into account in the total DR cross section used in the present analyses.
IV.3 Effects of Breakup on Fusion
We now turn to the effect of breakup on the fusion cross section. As has been argued, there are two competing physical effects of breakup on the fusion cross section, . The first is the lowering of the fusion barrier, which tends to enhance . The other is the removal of flux from the elastic into the breakup channel, which suppresses . Since the breakup channel dominates DR, these two competing breakup effects may be represented by the real () and the imaginary () parts of the DR potential; can describe precisely the effect of lowering the barrier, while the removal of the flux from the elastic channel.
To see the effects quantitatively, we have introduced in Ref. so1 the following suppression factor ,
| (13) |
where is obtained by setting , i.e., neglecting both barrier-lowering and flux loss effects, while is our final calculated cross section that includes both and . In the above-barrier region, becomes almost constant and here we present just the average of the -values at three highest energies considered in the present study. The values are 0.87 and 0.82 for the EDF and EF cases, respectively. Setting reduces , while setting increases . Thus, the fact that the -values are smaller than unity indicates that the flux loss effect surpasses the barrier-lowering effect in the above barrier region. The theoretical values may be compared with the experimental values of =0.79, where is defined as
| (14) |
by using fixed from the EF case. in the EDF case is 0.77, quite close to in the EF case.
Note that the theoretical suppression factor =0.82 in the case of EF agrees very well with the experimental value of =0.79. It is natural because the calculated agrees with in the EF case as shown in Fig. 5(b). Similarly, the difference between =0.87 and =0.77 in the EDF case originates from the discrepancy between and the calculated , seen in Fig. 5(a). In either case, both and are consistently and considerably smaller than unity, implying that the observed suppression of can be ascribed to the flux loss in the elastic channel to breakup. A similar result was also obtained in Ref. so1 .
Although breakup (or DR) is the dominant factor in the suppression of in the above barrier region, this is not the case in the sub-barrier region, where the neutron flow affects fusion dominantly stel , generally enhancing the sub-barrier fusion. In Ref. so1 , it was proposed that a good measure for the sub-barrier fusion enhancement is the quantity defined as
| (15) |
where is the Coulomb-barrier height and is the sub-barrier threshold energy discussed in Subsec. II B. In Ref. so1 , it is demonstrated that is very well proportional to the neutron transfer -value.
IV.4 Comments on the Analyses of the 9Be+209Bi System Reported in Ref. [1]
In Ref. so1 , we presented our analyses on the 9Be+209Bi system using only the elastic scattering sig1 and fusion cross section data sig2 (the EF type analysis). Since the target nucleus 209Bi differ from 208Pb only by one proton, it is naturally expected that the experimental cross sections for the two systems should be very similar. This is indeed the case for the elastic scattering cross sections; no noticeable difference can be found in the data measured for the Pb target woo1 and Bi target sig1 . In contrast to this, the values of the fusion cross section for the Bi target we used from Ref. sig2 at the time of our analyses so1 are significantly larger than those for the Pb target reported in Ref. das1 . Recently, however, the fusion cross sections for the Bi target are revised sig3 , and the revised values are now very much the same as those of the Pb target.
Due to this change in the experimental values of for 209Bi, we have repeated our previous analyses for 9Be + 209Bi system, obtaining now essentially the same results as in the present work for 9Be + 208Pb. Therefore, we take this opportunity to revise our previous values of the suppression factor ; the new theoretical value obtained with the revised data is =0.81, which can be compared with the new experimental value of =0.79. The corresponding values reported previously in Ref. so1 were =0.89 and =0.92.
V Conclusions
In summary, we have carried out simultaneous analyses of elastic scattering, DR (breakup plus incomplete fusion), and fusion cross sections for the 9Be+208Pb system at near-Coulomb-barrier energies within the framework of an extended optical model that introduces the DR and fusion potentials. Two types of analyses are made; one using the experimental DR cross section (EDF case), and the other using the semi-experimental DR cross section (EF case), together with the measured elastic scattering and fusion cross sections for both cases. In the second type of the analyses, is first extracted from simple optical model fits to the elastic scattering data only. The extracted are found to be significantly larger than . In spite of this difference between and , the resultant DR and fusion potentials show common features that they satisfy fairly well the dispersion relation maha and the fusion potentials show the threshold anomaly as seen in the potentials for systems with tightly bound projectiles naga ; bae1 ; lil1 ; ful1 .
For both EDF and EF cases the elastic scattering cross sections are equally well reproduced. However, the calculated DR, fusion, and total reaction cross sections fit the corresponding experimental data well in the EF case, but not in the EDF case. In the latter case, the calculations overestimate significantly the experimental DR, fusion, and total reaction cross sections. This is because there are some reaction channels that are not taken into consideration in the present experimental DR data.
Thus as far as we don’t have comprehensive available, the EF analysis gives us better overall results than the EDF analysis. We believe that if the cross section of inelastic scattering and some other missing reactions that are not taken into account in the present data of woo2 are measured and used in the analyses, both types of analyses will lead to equally good fit to the data. It is thus highly desirable that such DR data will be measured in near future in order to test our expectation and thus to justify the validity of the EF method proposed in Ref. so1 .
The authors sincerely thank Drs. Woolliscroft and Dasgupta for their kindly sending the numerical values of the data they took. SWH thank TRIUMF for the hospitality where part of the work is done. The work is supported by the Basic Research Program of the KOSEF, Korea (Grant No. R05-2003-000-12088-0).
References
- (1)
- (2) W. Y. So, S. W. Hong, B. T. Kim, and T. Udagawa, Phys. Rev. C 69, 064606 (2004).
- (3) N. Keeley, S. J. Bennett, N. M. Clarke, B. R. Fulton, G. Tungate, P. V. Drumm, M. A. Nagarajan, and J. S. Lilly, Nucl. Phys. A571, 326 (1994).
- (4) Y. W. Wu, Z. H. Liu, C. J. Lin, H. Q. Zhang, M. Ruan, F. Yang, Z. C. Li, M. Trotta, and K. Hagino, Phys. Rev. C. 68, 044605 (2003).
- (5) M. Dasgupta et al., Phys. Rev. C 66, 041602(R) (2002).
- (6) C. Signorini et al., Phys. Rev. C 61, 061603(R) (2000).
- (7) C. Signorini et al., Eur. Phys. J. A 5, 7 (1999) and private communications.
- (8) T. Udagawa, B. T. Kim, and T. Tamura, Phys. Rev. C 32, 124 (1985); T. Udagawa and T. Tamura, Phys. Rev. C 29, 1922 (1984).
- (9) S.-W. Hong, T. Udagawa, and T. Tamura, Nucl. Phys. A491, 492 (1989).
- (10) T. Udagawa, T. Tamura, and B. T. Kim, Phys. Rev. C 39, 1840 (1989); B. T. Kim, M. Naito, and T. Udagawa, Phys. Lett. B 237, 19 (1990).
- (11) R. H. McCamis et al., Can. J. Phys. 64, 685 (1986).
- (12) T. Eliyakut-Roshko, R. H. McCamis, W. T. H. van Oers, R. F. Carlson, and A. J. Cox, Phys. Rev. C 51, 1295 (1995).
- (13) A. Auce et al., Phys. Rev. C 53, 2919 (1996).
- (14) P. Singh, A. Chatterjee, S. K. Gupta, and S. S. Kerekatte, Phys. Rev. C. 43, 1867 (1991).
- (15) J. J. Kolata et al., Phys. Rev. Lett. 81, 4580 (1998).
- (16) C. C. Mahaux, H. Ngo, and G. R. Satchler, Nucl. Phys. A449, 354 (1986); Nucl. Phys. A456, 134 (1986).
- (17) M. A. Nagarajan, C. C. Mahaux, and G. R. Satchler, Phys. Rev. Lett. 54, 1136 (1985).
- (18) A. Baeza, B. Bilwes, J. Diaz, and J. L. Ferrero, Nucl. Phys. A419, 412 (1984).
- (19) J. S. Lilley, B. R. Fulton, M. A. Nagarajan, I. J. Thompson, and D. W. Banes, Phys. Lett. 151B, 181 (1985).
- (20) B. R. Fulton, D. W. Banes, J. S. Lilley, M. A. Nagarajan, and I. J. Thompson, Phys. Lett. 162B, 55 (1985).
- (21) P. H. Stelson, Phys. Lett. B 205, 190 (1988); P. H. Stelson, H. J. Kim, M. Beckerman, D. Shapira, and R. L. Robinson, Phys. Rev. C 41, 1584 (1990).
- (22) R. J. Woolliscroft et al., Phys. Rev. C 69, 044612 (2004).
- (23) M. Dasgupta et al., Phys. Rev. Lett 82, 1395 (1999).
- (24) R. J. Woolliscroft et al., Phys. Rev. C 68, 014611 (2003).
- (25) R. A. Broglia and A. Winther, Heavy Ion Reactions Lecture Note Volume I: Elastic and Inelastic Reactions, p165, (Benjamins, London, 1981).
- (26) W. G. Love, T. Terasawa, and G. R. Satchler, Nucl. Phys. A 291, 183 (1977).
- (27) B. T. Kim, W. Y. So, S. W. Hong, and T. Udagawa, Phys. Rev. C. 65, 044607 (2002).
- (28) G. R. Satchler, Introduction to Nuclear Reactions, (Wiley, New York, 1980).
- (29) H. Wojciechowski, L. R. Medsker, and R. H. Davis, Phys. Rev. C 16, 1767 (1977).
- (30) G. R. Satchler and W. G. Love, Phys. Rep. 55, 183 (1979).
- (31) M. S. Hussein, Phys. Rev. C 30, 1962 (1984).
- (32) B. T. Kim, W. Y. So, S. W. Hong, and T. Udagawa, Phys. Rev. C. 65, 044616 (2002).
- (33) C. Signorini et al., Prog. Theor. Phys. 107, 1 (2002).
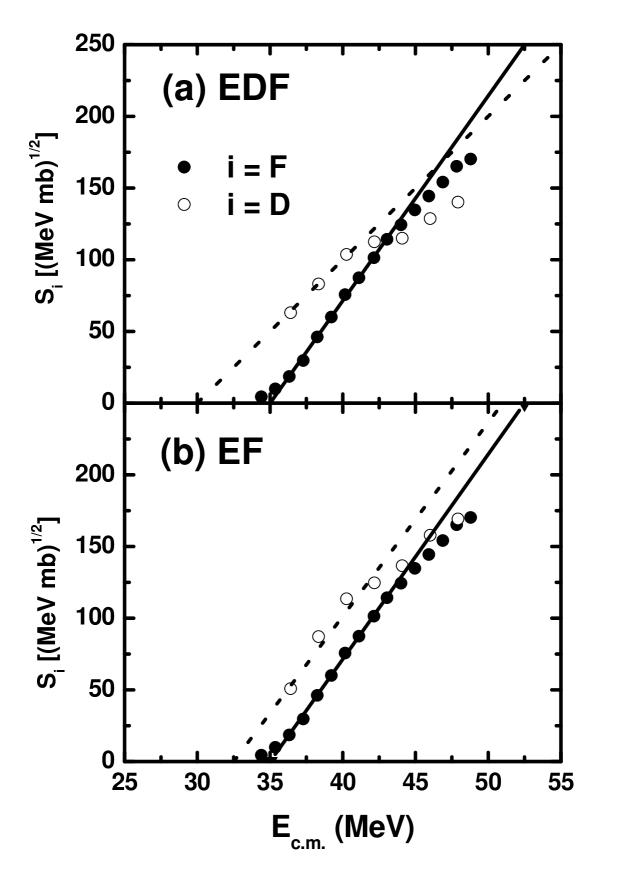
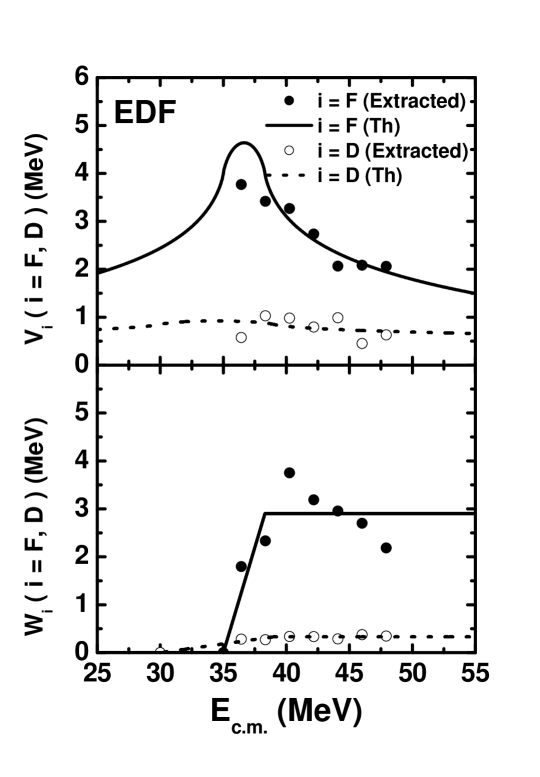
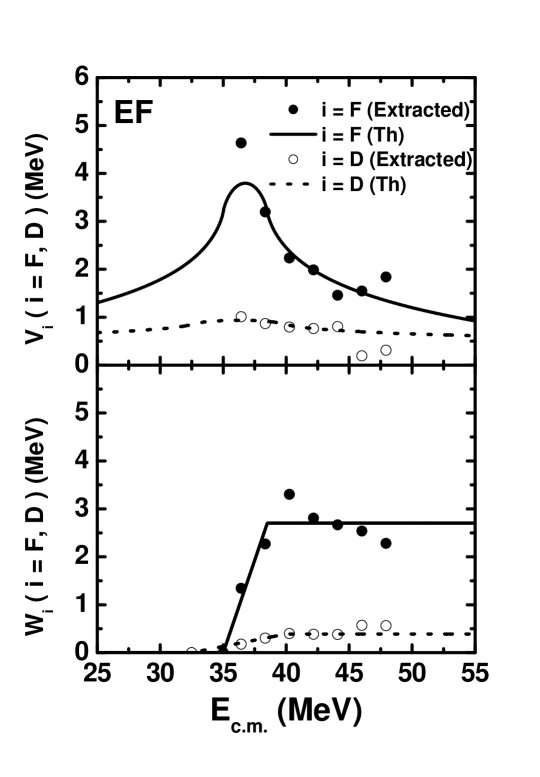
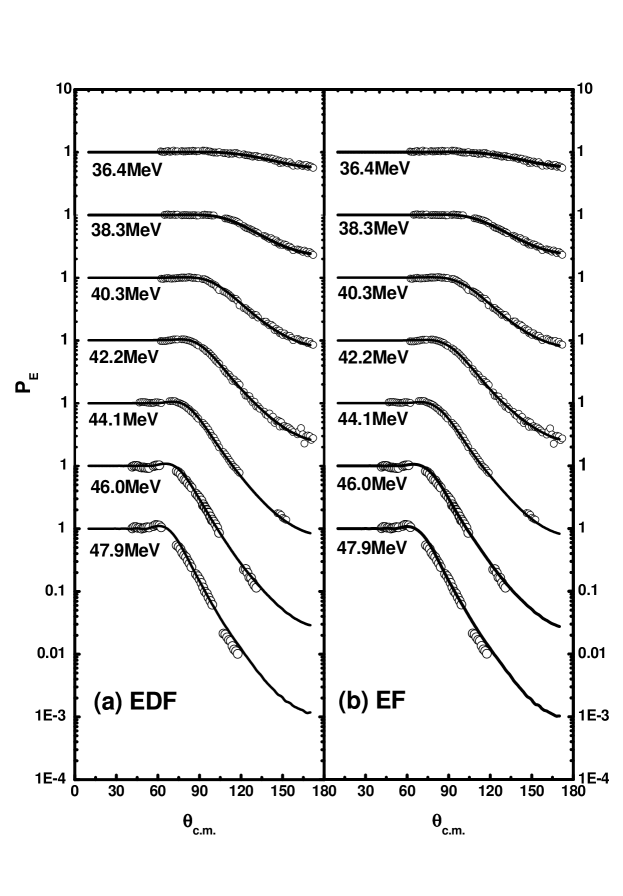

FIGURE CAPTIONS
Fig. 1. The Stelson plot of for DR (, open circles) and fusion (, solid circles) cross sections with (a) the experimental and (b) the semi-experimental DR cross sections. The straight lines are drawn to show the extraction of the threshold energies .
Fig. 2. The strength parameters (upper panel) and (lower panel) for and as functions of in the EDF case. The open and solid circles are the strength parameters extracted by -fitting for and , respectively. The dotted and solid lines in the lower panel denote and from Eqs. (9) and (11), respectively, while the dotted and solid curves in the upper panel represent and calculated by using the dispersion relation of Eq. (6) with given by Eqs. (9) and (11). The reference energy for and , are chosen as 4.0 MeV and 0.85 MeV, respectively.
Fig. 3. The same as in Fig. 2, but for the EF case. The dotted (solid) line in the lower panel denotes () from Eq. (10) (Eq. (12)). The dotted (solid) curve in the upper panel represents () obtained by the dispersion relation. The reference energy for and , are taken as 3.2 MeV and 0.85 MeV, respectively.
Fig. 4. Ratios of the elastic scattering cross sections to the Rutherford cross section calculated with our final dispersive optical potential for (a) the EDF and (b) the EF cases are shown in comparison with the experimental data. The data are taken from Ref. woo1 .
Fig. 5. DR and fusion cross sections calculated with our final dispersive optical potential for the (a) EDF and (b) EF cases are shown in comparison with the experimental data. denoted by the open circles in EF case are obtained as described in Sec.II. denoted by the open circles in EDF case are the experimental DR cross sections woo2 . The fusion data are from Ref. das2 .