Hadron Production and Phase Changes
in Relativistic
Heavy Ion Collisions
Abstract
We study soft hadron production in relativistic heavy ion collisions in a wide range of reaction energy, , and make predictions about yields of particles using the statistical hadronization model. In fits to experimental data, we obtain both the statistical parameters as well as physical properties of the hadron source. We identify the properties of the fireball at the critical energy threshold, , delineating for higher energies hadronization of an entropy rich phase. In terms of the chemical composition, one sees a phase which at low energy is chemically under-saturated, and which turns into a chemically over-saturated state persisting up to the maximum accessible energy. Assuming that there is no change in physical mechanisms in the energy range , we use continuity of particle yields and statistical parameters to predict the hadron production at , and obtain total yields of hadrons at GeV. We consider, in depth, the pattern we uncover within the hadronization condition, and discuss possible mechanisms associated with the identified rapid change in system properties at . We propose that the chemically over-saturated 2+1 flavor hadron matter system undergoes a 1st order phase transition.
pacs:
24.10.Pa, 25.75.-q, 13.60.Rj, 12.38.Mh1 Introduction
CERN-PH-TH/2005-060
It is believed that the deconfined phase of matter is formed at sufficiently high energy and reaction volume reached in the most central collisions of heavy ions at the top RHIC energy RBRC . The question is where this critical energy threshold is. We pursue this point in this systematic study, in order to explore possible phase changes occurring as function of collision energy Gaz . We furthermore compare our results qualitatively to the behavior seen as function of the reaction volume RafRHIC .
The tool, used in our study of soft hadron production, is the generalized statistical hadronization model (SHM) which allows for particle yields to be in full chemical non-equilibrium Letessier:1998sz . SHM is capable to describe, in detail, hadron abundances and has been considerably refined in past decade, after its formulation by Fermi and Hagedorn KMR03 .
We present and/or extend here results of analysis of
the energy dependence of total hadron production yields for:
a) fixed target symmetric Au–Au reactions at the top
available AGS projectile energy 11.6 GeV
(energy per colliding nucleon pair GeV),
b) fixed target symmetric Pb–Pb reactions at
SPS at 20, 30, 40, 80 and 158 GeV projectile energy. This
we refer to as SPS energy range,
GeV,
c) the Au–Au reactions in the collider mode
at RHIC in 65+65, 100+100, and also at 31.2+31.2 GeV
reactions for both total, and central rapidity yields.
This is the RHIC energy range, GeV.
Experimental data analysis at RHIC was carried out for the central rapidity region yields at and 200 GeV, and for the full hadron yields at 200 GeV. The results we present for total hadron yields at GeV and 62.4 GeV, arise from our model considerations alone. This is also in part the case for for the central rapidity yields at GeV .
As a first step, we aim to describe at each reaction energy the hadron yield data. We obtain in this process the statistical hadronization model (SHM) parameters, which allow to evaluate the yields of all (also of unobserved) particles. One can see SHM analysis as a method of how the known experimental hadron yield data can be extrapolated to obtain the unobserved hadron yields. For this reason, we also attempt to extrapolate to reaction energies and phase space coverage which is not allowing, for lack of data, a SHM fit. For example, for the 31.2+31.2 GeV case, we interpolate strange particle yields, which are known below and above this energy, and/or fix certain SHM parameters which show continuity as function of reaction energy, respecting in the process the constraints of the SHM.
In our analysis, we are seeking consistency in the results across the reaction energy. This is of importance when the number of measurements is not much greater than is the number of observables. When we are able to fix the values of statistical parameters by consistency check across energy range, then the number of used parameters is reduced and the statistical significance shown in this work is for the number of parameters actually fitted. However, more often, in the study of statistical significance, we do not account explicitly for consistency across energy range. For this reason, in most cases, the statistical significance we present is a lower limit.
Once a statistically significant description of the data sample at an energy is achieved, we have available the yields of all soft hadronic particles and their resonances. We sum partial contributions of each particle species to quantities such as entropy, strangeness, baryon number, to obtain the properties of the fireball at the time of particle production (hadronization). In this way, we evaluate fireball breakup pressure, entropy, baryon number, strangeness yield and the thermal energy content. In this approach, the kinetic energy content associated with the collective flow of matter is not considered — this requires a study of particle and rapidity spectra, beyond the integrated hadron yields.
High strangeness Rafelski:1982pu , and entropy content Glendenning:1984ta ; Letessier:1992xd of a dense hadronic matter fireball are the anticipated characteristic property of the color deconfined state of matter. Once formed, this enhancement of strangeness and entropy is also the property of the final hadronic state: first principles require that entropy must increase in the fireball expansion, as well as in the ensuing hadronization process; model studies show that once strangeness is produced, it remains present during expansion of dense matter, it can slightly increase during hadronization KMR ; Koch:1984tz .
Particle yields, and pion yield in particular, provide natural measure of entropy yield, while the kaon yields, and in particular the yield, are an approximate measure of the total strangeness yield across all reaction energies Glendenning:1984ta . The yield ratio has been studied as function of reaction energy in the SPS energy domain and a strong ‘horn’ like feature has been discovered Gaz .
This suggests a change in the reaction mechanism of particle production, occurring in central collisions of Pb–Pb, in the energy interval , the two limits correspond to 20 and respectively, 30 GeV Pb beams on fixed target. This energy range is just at the predicted threshold of quark–gluon formation arising considering balance of energy deposition and relativistic reaction dynamics DanRaf . Possibility of a rich phase structure of the deconfined phase at high baryochemical potential and finite temperature further enhances our interest in the study of this reaction energy domain Kitazawa:2001ft .
To describe experimental results indicating the presence of a critical (‘cr’) energy threshold, one can, in first instance, use two different reaction models which apply below and, respectively, above a postulated energy threshold for a phase transformation GazHorn . However, this presupposes the most important outcome, namely that there is an energy dependent change in dense matter fireball structure at its breakup. Moreover, such an approach does not produce as result of analysis an insight into the structural change that occurs, and which could be compared with predictions. Instead, the structural change is part of the hypothesis under which the analysis is carried out. For this reason, the methodology we choose here is more general.
We use in this work the software package SHARE (statistical hadronization with
resonances) share , the public SHM suit of programs,
where the methods of SHM analysis are described in greater detail.
Of particular importance here is that the full mass spectrum of hadron resonances
is included Torrieri:2003nh .
SHARE implements two features important for the full understanding
of the horn:
1) the isospin asymmetry driven
by proton–neutron asymmetry, which is particularly relevant
at low reaction energies,
2) the chemical non-equilibrium (phase space under-saturation
and over-saturation) for strange and light quarks.
These two features appear to be essential to
obtain a description of the energy dependent
yield.
We first describe, in next section 2, features of the data sample we use, discuss the input data and results of the fits for the AGS/SPS and RHIC energy range separately. We discuss the resulting statistical parameters and the confidence level of our fits. We survey, in both tabular and graphic form, the energy dependence of particle yields of interest, including an explanation of the horn. We then discuss physical properties of the fireball at point of chemical freeze-out in section 3, show the energy dependence of the model parameters and of physical properties, and address the strangeness and entropy production. We discuss the results of our analysis and present their interpretation in the final section 4.
2 Fit procedure and hadron multiplicities
2.1 General remarks
The measured experimental results are available for either total particle yields, , or for central rapidity yields, . At RHIC energy scale, we will study both data sets, though is rather incomplete at this time. At AGS and SPS, we will solely consider , in order to minimize the impact of the shape of the longitudinal unstopped matter flow on the outcome of the analysis.
At SPS, a semi-distinct central rapidity domain is only present in the top SPS case, its re-analysis will make good sense once the RHIC data extend to the minimum accessible energy domain which is close to top SPS energy range. However, this will require introduction of models of collective matter flow, a step which we do not wish to take in this work. At high RHIC energies, we presume that the fragmentation regions are sufficiently separated from the central rapidity domain as to allow the study of the rapidity particle distributions , at central rapidity, in a model independent fashion.
We include, in our consideration
of the total particle yields , the
trigger condition which defines the
participant ‘wounded’ nucleon number .
This has to be equal to the total net baryon number
contained within the final state particle multiplicities.
Furthermore, both for and
central rapidity yields , we
consider two constraints:
a) the fraction of
protons among all nucleons (0.39 for heavy nuclei) establishes a fixed
final ratio of all electrical
charge to the total final state baryon number – the
ratio is preserved in any fraction of a volume of centrally colliding nuclei;
it is a measured quantity given the fact that both target and projectile are known;
b) strangeness (valance -quarks)
content of hadrons prior to weak decays has to be
(up to systematic experimental error)
balanced by antistrangeness (valance -quarks)
bound in hadrons for the
study, and nearly balanced
when considering the central rapidity distributions.
As our prior studies showed IJMPE , any deviation from strangeness conservation as function of rapidity is, in general, smaller than the typical 10% systematic error of the experimental data points . It is the level of systematic error in the particle yields which determines the precision at which we have to assure strangeness conservation. Forcing exact balance can create an aberration of the fit, since the sharp constraint is inconsistent with several independent measurements which contribute to the cancellation. For example, at several SPS energies the systematic errors between and which control the yields of and, respectively, quarks, do not cancel to better than 8% level. This can be checked without a fit in a qualitative study of the key particle yields.
Another reason to be cautious with the strangeness conservation is that the spectra of hadrons we are using could contain wrong entries (e.g., pentaquark states which we in view of recent experimental results do not anymore include in the input data set, or wrong spin-isospin assignments for little known states). Moreover, we maybe missing some relevant undiscovered resonances. These effects are largest when the baryon asymmetry is largest, since the strangeness balance condition probes at large baryochemical potential the mass spectrum of strange baryons and mesons separately, with mesons dominating in antistrangeness and baryons important in the strangeness count.
For this reason, our strangeness conservation procedure is as follows: when a first fit shows strangeness a slight strangeness asymmetry, we find the best parameters for the fit with a loose, systematic error related strangeness conservation constraint allowing, e.g., a 10% deviation from balance as a fit input that is we request . Since we present confidence level and profiles of the fit, and we wish to have from energy to energy comparable results, we redo the fit with a fixed preferred value of the strangeness fugacity as is done in case of using exact strangeness conservation.
In this way, we obtain a data fit with the same mechanism of approach as for the cases where exact strangeness conservation is used to fix one parameter, so that confidence levels are comparable. We find in the SPS energy domain. The asymmetry favors an over-count of quarks in emitted hadrons. It is moderate in its relative magnitude, staying within the systematic errors of the measurements used in this study. We will state the strangeness balance explicitly when presenting the computed particle yields. Note that addition of pentaquarks to the hadron spectrum decreases this asymmetry by 0–3%, but has otherwise minimal influence on the fit results presented.
As the above discussion of strangeness conservation shows, conserved quark quantum numbers introduce yield constraints, which particle multiplicities cannot deviate from. How a subset of SHM parameters determine a set of particle ratios has been shown for the first time in 1982 Koch:1982ij . An nice example is the chemical relation between the and demonstrated experimentally in 2003, see figure 4 in Bearden:2003fw , a development based on the rediscovery of the SHM constraints in 2000 Becattini:2000jw . Since SHM with its chemical consistencies has been very successful in helping understand hadron production, we embark on further data verifications at each energy, checking the consistency of experimental data with SHM.
A suspect particle yield can be further cross checked studying the behavior of this particle yield as function of energy. Such consideration is very important since we are searching for a change in the physical properties of the fireball as function of energy, and we do not want the outcome to be even in part the result of a statistical fluctuation in the reported yield of a subset of particles. We find inconsistencies (see next paragraph) in the particle yield effects. None of these influence decisively the findings we report here, in part because of the more lax attitude we take toward the constraint on strangeness conservation we described above. Moreover, considering the large number of experimental data considered, fluctuations in experimental data sample must occur.
Specifically, we did not use the nor and yields obtained at 158 GeV in our fit. The preliminary value at top SPS is Friese:2002re . This is within 3 s.d. of the SHM yield. However, this exceptionally narrow resonance may be subject to additional effects Rafelski:2001hp and we felt that it is more prudent to not include its study here. The experimental yields of and at 158 GeV are contrary to the larger than the SHM model predicts. These particles are produced very rarely and for this reason any novel mechanism of production Kapusta:2000ny would be first visible in their yield. We believe that it is also prudent to not include these in the study, even if the deviation from fit would be at 2 s.d. level.
2.2 AGS and SPS energy range fit
To assure the reproducibility of our analysis, we will describe in detail the input particle yields that are used, for AGS/SPS energy domain, and for RHIC domain in the next subsection. The set of particles available at AGS arises from several experiments, we have previously reported in detail the SHM analysis at the top AGS energy Letessier:2004cs , which input and fit results are restated here.
The study of AGS results was performed in Letessier:2004cs for several possible cases, such as with and without yield, strangeness (non)conservation. The results here presented are for the case in which the yield is fitted and strangeness is conserved. Differences in theoretical fit detail yield similar fit result which show the robustness of the approach.
For this work, the analysis of the particle yields of the NA49 experimental group available at 20, 30, 40, 80 and 158 GeV GazPriv has been carried out. This work extends significantly our prior study of the 40, 80 and 158 GeV NA49 done when many fewer measurements were available Fit03 . Moreover, the SHARE package used offers additional theoretical features which were not fully implemented earlier: the consistent description of the yields of different charges hadrons (e.g., protons and neutrons, and by means of allows to fix the net charge fraction . The most relevant difference to the earlier study is, however, that we can address the two newly measured reaction energies, 20, 30 GeV. This, along with the AGS 11.6 GeV data, including the recently published -yield AGSphi , allows to recognize a major change in the behavior of the hadronizing fireball Gaz .
| E[GeV] | 11.6 | 20 | 30 | 40 | 80 | 158 |
|---|---|---|---|---|---|---|
| [GeV] | 4.84 | 6.26 | 7.61 | 8.76 | 12.32 | 17.27 |
| 1.6 | 1.88 | 2.08 | 2.22 | 2.57 | 2.91 | |
| centrality | most central | 7% | 7% | 7% | 7% | 5% |
| , | 3496 | 3496 | 3496 | 3496 | 3626 | |
| 0.390.02 | 0.3940.02 | 0.3940.02 | 0.3940.02 | 0.3940.02 | 0.390.02 | |
| 133.79.9 | 184.513.6 | 23917.7 | 29318 | 44627 | 61948 | |
| /, | 217.515.6 | 27519.7 | 32219 | 47428 | 63948 | |
| , | 402.8 | 55.34.4 | 59.14.9 | 76.96 | 10310 | |
| 3.760.47 | 10.40.62 | 16.11 | 19.21.5 | 32.42.2 | 51.94.9 | |
| , | 1.910.45 | 1.650.5 | 2.50.25 | 4.580.2 | 7.61.1 | |
| 18.11.9 | 281.5 | 41.96.1 | 43.05.3 | 44.76.0 | 44.98.9 | |
| 0.0170.005 | 0.160.03 | 0.500.04 | 0.660.1 | 2.020.45 | 3.680.55 | |
| 1.50.13 | 2.480.19 | 2.410.39 | 3.80.260 | 4.50.20 | ||
| 0.120.06 | 0.130.04 | 0.58 0.13 | 0.830.04 | |||
| 0.140.07 | ||||||
| 814 | ||||||
| 3596331 | 4519261 | 1894409 | 1879183 | 210253 | 30041 | |
| [MeV] | 157.80.7 | 153.41.6 | 123.53 | 129.53.4 | 136.40.1 | 136.40.1 |
| 5.230.07 | 3.490.08 | 2.820.08 | 2.420.10 | 1.940.01 | 1.740.02 | |
| 1.657∗ | 1.41∗ | 1.36∗ | 1.30∗ | 1.22∗ | 1.16∗ | |
| 0.3350.006 | 0.480.05 | 1.660.10 | 1.640.04 | 1.640.01 | 1.640.001 | |
| 0.1900.009 | 0.380.05 | 1.840.32 | 1.540.15 | 1.540.05 | 1.610.02 | |
| 0.8770.116 | 0.8630.08 | 0.9390.023 | 0.9510.008 | 0.9730.002 | 0.9750.004 | |
| [MeV] | 783 | 576 | 384 | 344 | 271 | 227 |
| [MeV] | 188 | 139 | 90.4 | 80.8 | 63.1 | 55.9 |
The input data we considered for the AGS and SPS are presented in top part of the table 1. The statistical parameters are seen below these input data. In carrying out the data analysis, we use the full grand-canonical statistical set of seven parameters: volume V, freeze-out temperature , chemical quark fugacities , quark occupancy parameters and , and third component of the isospin fugacity . The fitted values of these 7 parameters are seen near bottom of the table 1, which is followed by entries for the central values of the two chemical potentials:
| (1) | |||||
| (2) |
The uncertainties in the value of statistical parameters comprise the propagation of experimental measurement error through the fit, as well as ambiguity due to statistical parameter correlations arising. In some instances this effect is very small, in others rather large. This wide disparity is possible, as sometimes the data set is sufficiently constraining, and in others it is not. The most interesting result, we notice in table 1, is the sudden shift in the values of the phase space occupancies and observed as reaction energy rises from 20 to 30 GeV. The value of chemical freeze-out temperature changes accordingly to counterbalance the effect of a rapid change in and on some particle multiplicities. We will discuss this change in behavior in great detail in what follows. The steady decrease of baryochemical potential with reaction energy follows the enhancement in global yield of hadrons. At central rapidity the steady increase of baryon transparency with increasing collision energy yields a smaller value of . The total particle yields we consider here yield an average over the entire rapidity range of . The associated value of is controlled by strangeness conservation condition, as discussed.
As seen in table 1, we occasionally fix the value of . The value we choose is the the best value which emerges from study of profile, see figure 1. We fix the best in order to reduce the correlations between parameters, given the small number of degrees of freedom. Excluding from the count of parameters which is related to (near) strangeness conservation, there are 6 (or 5 when is fixed) parameters while there are between 9 and 12 data inputs at each energy considered in table 1. We thus have 3–6 degrees of freedom (d.o.f) for the fits carried out at AGS and SPS. Not all of the NA49 SPS energy range results we use are published in final form.
We show, in figure 1, the reliability of the fits we obtained at different reaction energies as function of , the light quark phase space occupancy. The results for AGS and SPS are accompanied by those for central rapidity RHIC fits we will address below. The top frame, in figure 1, shows . The associated significance level is seen in the bottom frame. We include as result, since the number of degrees of freedom in each fit is small and it is hard to judge the significance of a small value of .
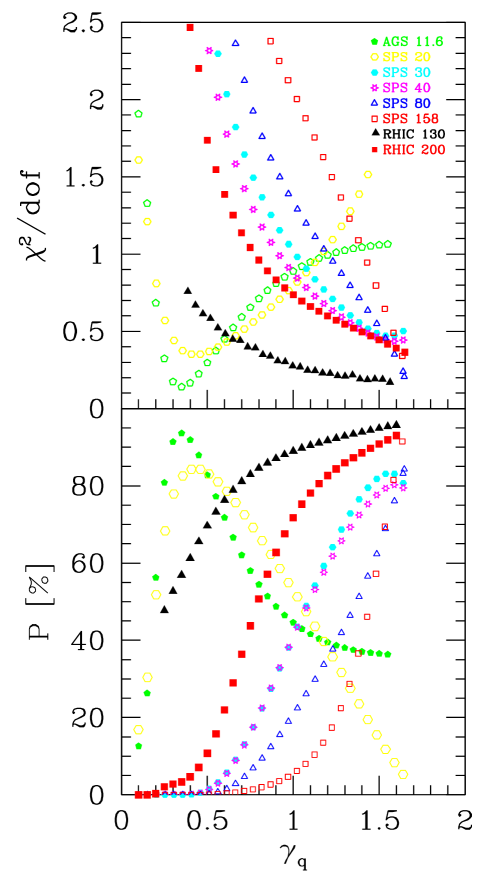
We study dependence of and on since we see, in table 1, that the two parameters which undergo a rapid change as function of reaction energy are , and to a lesser degree, the freeze-out temperature . The rapid change with is prominent in figure 1 where peaks for the lowest two energies (11.6 and 20 GeV) at , while for all other collision energies it grows to maximum value near , where the Bose singularity of the pion momentum distribution .
The reader can see, in figure 1, that setting the value will yield a set of energy dependent individual fits which appear to have a good confidence level. However, the energy dependence of the particle yields derived at this fixed condition is less convincing. It is the rapid shift in the best as function of reaction energy which allows to describe the ‘horn’ feature in the data (see below figure 2). Without variable this horn feature is largely erased, see, e.g., figure 4 in Cleymans:2004hj , and the dashed and dotted lines in figure 2. We will return to describe this effect in section 2.4, and discuss this physics in more detail in section 4.1. We believe that, in the study of energy dependent particle yields, the use of the highest confidence level SHM results with is required for the description of energy dependent particle yield data.
| [ GeV] | 11.6 | 20 | 30 | 40 | 80 | 158 |
|---|---|---|---|---|---|---|
| [GeV] | 4.84 | 6.26 | 7.61 | 8.76 | 12.32 | 17.27 |
| 1.6 | 1.88 | 2.08 | 2.22 | 2.57 | 2.91 | |
| centrality | m.c. | 7% | 7% | 7% | 7% | 5% |
| 375.6 | 347.9 | 349.2 | 349.9 | 350.3 | 362.0 | |
| 135.2 | 181.5 | 238.7 | 290.0 | 424.5 | 585.2 | |
| 162.1 | 218.9 | 278.1 | 326.0 | 461.3 | 643.9 | |
| 17.2 | 39.4 | 55.2 | 56.7 | 77.1 | 109.7 | |
| 3.58 | 10.4 | 15.7 | 19.6 | 35.1 | 54.1 | |
| 10.7 | 25.5 | 35.5 | 37.9 | 55.1 | 80.2 | |
| 0.46 | 1.86 | 2.28 | 2.57 | 4.63 | 7.25 | |
| 174.6 | 161.6 | 166.2 | 138.8 | 138.8 | 144.3 | |
| 0.021 | 0.213 | 0.68 | 0.76 | 2.78 | 5.46 | |
| 18.2 | 29.7 | 39.4 | 34.9 | 42.2 | 48.3 | |
| 0.016 | 0.16 | 0.51 | 0.63 | 2.06 | 4.03 | |
| 0.47 | 1.37 | 2.44 | 2.43 | 3.56 | 4.49 | |
| 0.0026 | 0.027 | 0.089 | 0.143 | 0.42 | 0.82 | |
| 0.013 | 0.068 | 0.14 | 0.144 | 0.27 | 0.38 | |
| 0.0008 | 0.0086 | 0.022 | 0.030 | 0.083 | 0.16 | |
| 5.42 | 13.7 | 11.03 | 12.4 | 18.7 | 19.1 | |
| 38.7 | 33.43 | 25.02 | 26.6 | 27.2 | 28.2 | |
| 30.6 | 25.62 | 22.22 | 24.2 | 25.9 | 26.9 | |
| 1.36 | 2.06 | 1.73 | 1.96 | 2.62 | 2.99 | |
| 2.51 | 3.99 | 4.08 | 4.26 | 5.24 | 5.98 | |
| 0.16 | 0.44 | 0.69 | 0.73 | 1.14 | 1.44 | |
| 8.70 | 16.7 | 19.9 | 24.1 | 38.0 | 55.2 | |
| 0.44 | 1.14 | 1.10 | 1.41 | 2.52 | 3.76 | |
| 12.0 | 19.4 | 14.0 | 18.4 | 32.1 | 42.3 | |
| 6.10 | 13.0 | 10.8 | 15.7 | 27.0 | 38.5 | |
| 0.56 | 1.18 | 0.83 | 1.27 | 2.27 | 3.26 | |
| 0 | -0.092 | -0.085 | -0.056 | -0.029 | -0.056 |
Regarding the weak decay (WD) contributions: in the fits to experimental data, we have followed the corrections applied to the data by the experimental group(s). For 20 and 30 GeV in and , the data we use includes the WD of and , these matter mainly in consideration of antihyperon yields. At all higher SPS energies all hyperon WD decays are corrected for by the NA49 collaboration, the decays are always corrected. Similarly, decays of kaons into pions are corrected for at all SPS energies. At AGS 11 GeV, all yields we consider are without WD contribution. The contamination of by hyperons decays is not material. However, the decays of anti-hyperons contaminates in highly relevant way the yields of and we do not discuss here this effect further, the reader will note the relevant yields of and in table 2. The observable yield of is further contaminated by decays of .
The model yields obtained are shown in table 2. These results are prior to any WD contributions. The yields of input particles can be compared to the fitted inputs seen in table 1. We present also predictions for yields of a number of other particles of interest. We do not show the uncertainty in these results, which can be considerable: in addition to the error propagating through the fit, there is systematic error due to the shape of the minimum, see figure 1.
2.3 RHIC energy range fit
The RHIC central rapidity particle yields at and 130 GeV are analyzed using nearly the same method and principles described in the study of the total particle yields. This can be done for the case that the particle yields, and hence their source, is subject to (approximate) scaling, that means is flat as function of the rapidity distribution Cleymans:1999st . The overall normalization of yields then contains, instead of the volume , the volume fraction associated with the size of the volume at the rapidity of the source of particles at . We note that, in the local rest-frame, the total yield of particles can be written in the equivalent forms:
| (3) |
| [GeV] | 62.4 | 130 | 200 | 62.4 | 130 | 200 |
|---|---|---|---|---|---|---|
| [ GeV] | 2075 | 9008 | 21321 | 2075 | 9008 | 21321 |
| 5% | 5% | |||||
| 3496 | 3496 | 3496 | ||||
| 0.390.02 | 0.390.02 | 0.390.02 | 0.390.02 | 0.40.01 | 0.40.01 | |
| / | 1.020.03 | 1.00.03 | 1.00.05 | |||
| †114090 | †145090 | 1677150 | 27636 | 286.424.2 | ||
| 1695150 | 27036 | 281.822.8 | ||||
| 29326 | 46.78 | 48.96.3 | ||||
| 24322 | 40.57 | 45.75.2 | ||||
| 0.150.03 | 0.160.03 | |||||
| 28.74 | 18.32.6 | |||||
| 20.12.8 | 13.51.8 | |||||
| †172 | 17.350.8 | |||||
| †101 | 12.50.8 | |||||
| / | 0.00770.0016 | |||||
| , / | †2.050.2 | 0.1870.046 | 2.170.25 | |||
| , / | †1.31 | 0.2150.054 | 1.830.25 | |||
| / | 0.8530.1 | |||||
| 0.00120.0005 | ||||||
| 0.00210.0008 | ||||||
| 0.260.08 | 0.230.05 | |||||
| , | 4871394 | 6082384 | 8204351 | 93238 | 9303 | 118255 |
| [MeV] | 140∗ | 141.90.5 | 142.40.01 | 142.20.01 | 143.80.1 | 141.50.1 |
| 1.350.02 | 1.250.01 | 1.200.01 | 1.150.02 | 1.0760.001 | 1.0620.001 | |
| 1.104∗ | 1.074∗ | 1.069∗ | 1.054∗ | 1.025∗ | 1.024∗ | |
| 1.62∗ | 1.62∗ | 1.62∗ | 1.62∗ | 1.590.001 | 1.560.01 | |
| 2.180.2 | 2.20∗ | 2.000.29 | 2.130.14 | 2.220.01 | 2.000.02 | |
| 0.9330.001 | 0.9790.001 | 0.9880.002 | 0.9860.002 | 0.9970.001 | 0.9970.001 | |
| [MeV] | 126 | 94.8 | 79 | 61.2 | 31.5 | 25.7 |
| [MeV] | 27.7 | 21.4 | 16.5 | 13.6 | 7.0 | 5.2 |
The local rest frame particle density, , is thus related to the rapidity density by:
| (4) |
The SHM fits to particle densities thus produce as the normalization factor the value . The qualitative relation between and (rest-frame hadronization volume) must include the maximum rapidity range , where is the rapidity of the nuclei colliding head on,
| (5) |
where is a reaction energy dependent constant. The study of the total hadron yields at RHIC we present suggests –0.6.
Regarding the data source, and weak decay acceptance, we need to consider case by case the experimental results, since the relative importance of hyperon decays in the total baryon yields is high. In particular we note:
-
•
For RHIC-130 fit (second column from right in the top section of table 3):
The and 5% centrality results are from PHENIX Adcox:2003nr . We assume that the decays into pions are accepted at 70% level, and at 40% level. Mesons (pions and kaons) from hyperon decays are accepted at 30% level, while nucleons from hyperon decay are nearly fully accepted, both 90% and 99% acceptances are in essence indistinguishable. decays are fully accepted. We include in the fit an average of the STAR Adler:2002uv and PHENIX Adcox:2002au and yields where we can asses the feed from and in view of the STAR analysis Adams:2003fy , we accept 99% of and decays into and .
For the and weak feed yield corrections are immaterial. However, we cannot directly use the yields as these are presented for the 10% most central reactions. We fit the weak decay corrected and ratios. In order to relate this to the total particle yields, we include also ( = negatives) where we accept in STAR the weak decay products according to the pattern: decays into pions are accepted at 90% level, and at 30% level, pions and kaons from hyperon decays are accepted at 50% level, while nucleons from hyperon decay are accepted, at 99% level. The same is assumed in the fit of also measured by STAR Adams:2003fy . We include in the fit the STAR resonance ratios, Adler:2002sw and Adler:2002xv , in both cases we include 50% feed from and decay into kaons, which is immaterial for the result. -
•
For RHIC-200: fit (last column on right in the top section of table 3):
The and 5% centrality results are from PHENIX phenixyield . We assume that the weak decays are accepted at 70% level, and at 40% level. Mesons (pions and kaons) from Hyperon decays are accepted at 30% level, while nucleons from hyperon decay are nearly fully accepted, we included this at 90% level in the reported fit. decays are fully accepted. We take STAR resonance ratios, Zhang:2004rj ; Markert:2004xx and phiyld , in both cases we include 50% feed from and decay into kaons. The method to study the yields of stable hadrons along with resonances follows the work on the impact parameter dependence at = 200 GeV RafRHIC .
We did not use yields of and since without direct measurement of and it is hard to judge the weak decay contamination in the data. Furthermore, we preferred to study the relative yields . In the fit presented, we assumed that the pion feed from WD of hyperons is at 80% level. The other WD characteristics are as discussed just above. This slight change in data input and also the slight modification of the pattern of weak decay acceptance has, in comparison to Ref. RafRHIC , yielded a increase of the volume factor by 1.2 s.d., while other variations are within 0.5 s.d..
We can expect, in near future, particle multiplicity results from RHIC obtained at =62.4 GeV. We interpolate the central rapidity yields of strange hyperons and , presented in Elia:2004mb , to this energy. With these 4 inputs, two constraints, setting the , , we find a good description of the interpolated data but with a few degrees of freedom. We have four interpolated ‘data’ points, two constraints — strangeness conservation and , thus 6 data points which are fitted using four flexible parameters, and . This set of parameters, then, yields our prediction of central rapidity particle multiplicities, seen in table 4, for =62.4 GeV.
We make an effort to understand also the recently finalized total multiplicities of K± and brahms at GeV. Additional qualitative constraint is derived from total charge particle multiplicities Back:2002wb , however this result is not used directly in the fit. With the three constraints, four BRAHMS particle yields, we have 7 data points, and also 7 SHM parameters. To be able to make a fit with at least one degree of freedom it is necessary to make some ‘natural’ hypothesis. For this reason, we do not discuss the fit quality of yields at RHIC but we discuss the expected total particle yields, which we regard to be an experimentally motivated hadron yield prediction.
We choose to consider , which we find systematically at the RHIC energy scale. Our ‘fit’ to data at GeV works, but it must not be seen as a full fit, rather a consistency test of SHM. This is allowing a prediction to be made of other we show in table 4. This consideration is also yielding a rapidity-averaged value of and of the 5 chemical parameters, as well as an estimate of the proper size of the hadronizing fireball. The value of , which varies as function of rapidity, following the highly variable baryon distribution Bearden:2003hx , is found at a median value, seen at the bottom of table 3, on left for the fits.
| [GeV] | 62.4 | 130 | 200 | 62.4 | 130 | 200 |
|---|---|---|---|---|---|---|
| [GeV] | 2075 | 9008 | 21321 | 2075 | 9008 | 21321 |
| 5% | 5% | |||||
| 350.2 | 350.2 | 349.6 | 33.48 | 18.50 | 14.8 | |
| 899 | 1201 | 1543 | 183.8 | 230.3 | 239.8 | |
| 927 | 1229 | 1573 | 186.7 | 231.9 | 241.0 | |
| 230.9 | 302.5 | 291.9 | 43.7 | 47.9 | 47.1 | |
| 168.5 | 238.4 | 242.3 | 37,6 | 44.2 | 44.2 | |
| 193.8 | 261.0 | 259.9 | 39.4 | 44.4 | 44.2 | |
| 27.3 | 34.6 | 28.9 | 5.74 | 6.86 | 6.18 | |
| 140.0 | 157.6 | 192.0 | 19.34 | 17.09 | 16.34 | |
| 24.1 | 42.9 | 66.1 | 8.37 | 11.11 | 11.44 | |
| 81.1 | 97.4 | 89.9 | 12.3 | 12.04 | 10.7 | |
| 20.2 | 35.1 | 38.3 | 6.36 | 8.60 | 8.02 | |
| 12.9 | 16.4 | 11.6 | 2.14 | 2.30 | 1.91 | |
| 4.6 | 7.79 | 6.13 | 1.32 | 1.80 | 1.53 | |
| 1.94 | 2.68 | 1.45 | 0.36 | 0.44 | 0.33 | |
| 1.04 | 1.74 | 0.98 | 0.27 | 0.38 | 0.29 | |
| 48.7 | 67.4 | 68.1 | 10.2 | 11.5 | 11.2 | |
| 27.6 | 31.1 | 38.1 | 3.78 | 3.32 | 3.15 | |
| 26.2 | 29.9 | 36.9 | 3.69 | 3.30 | 3.13 | |
| 4.43 | 6.4 | 6.0 | 0.81 | 0.81 | 0.70 | |
| 9.80 | 11.91 | 11.19 | 1.52 | 1.50 | 1.33 | |
| 4.20 | 5.46 | 3.88 | 0.71 | 0.78 | 0.64 | |
| 131.9 | 179.5 | 192.3 | 27.2 | 30.5 | 30.6 | |
| 10.8 | 15.2 | 14.64 | 2.30 | 2.64 | 2.51 | |
| 85.8 | 117 | 157 | 18.1 | 19.5 | 20.3 | |
| 75.9 | 104 | 142.8 | 16.2 | 17.4 | 18.3 | |
| 6.51 | 9.03 | 12.96 | 1.40 | 2.02 | 1.58 | |
| 0 | 0 | 0 | 0 | 0 | 0 | |
We extend the consideration of the yields to the lower energies, and 130 GeV. This can be done assuming that there is no change in physics between top SPS energy and RHIC 200 GeV run. Thus, the success of our particle yield prediction would be a confirmation of this hypothesis. Our procedure can be seen in detail on the left of table 3. We fix the hadronization temperature at MeV, choose the value , and interpolate the values of . We do find the required values of , and needed to assure the total baryon yield, fraction of charge and one particle yield, which we choose to be the interpolated total . We use the observation that the yield from Brahms connects, in a logarithmic plot, in a nearly perfect straight line with the SPS energy domain. This produces the interpolated values we introduced in table 3. The SHM succeeds perfectly and allows us to offer predictions for the total particle yields presented in table 4.
We present, in detail, the resulting particle multiplicities in table 4 for RHIC. On left, we show the expected total yields and on right the central rapidity yields. We recall that, among total yields, only at 200 GeV a significant experimental input was available, thus the 62.4 and 130 GeV total yield results are an educated guess satisfying all constraints and criteria of the SHM model. Similarly, the central rapidity region yields for 62.4 GeV is a prediction based on interpolated yields, with inputs seen in table 3. All results, presented in table 4, are obtained prior to WD.
2.4 Energy dependent particle yields
We consider, more systematically, the energy dependence of particle yields and ratios. Of particular interest is the ratio which shows the previously unexplained horn structure. We compare the experimental and theoretical behavior in figure 2. The results are blue filled squares. The central rapidity RHIC results (on right in red) are shown as open squares, while the predicted total yield ratio for is given as an open circle.
We recall that the abrupt increase in the value of occurs where the rise in reverses, turning into a sudden decrease with reaction energy. The solid line, shows our chemical non-equilibrium fit which reproduces the horn structure well. The predicted total yield ratios for and 130 GeV (edges in solid line) arise from the interpolation of yields and/or continuity in value of statistical parameters such as between the top SPS and the top RHIC energy, see above, subsection 2.3.
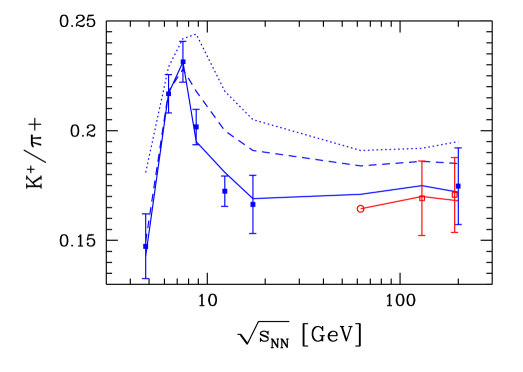
The dotted line, in figure 2, presents best fit results obtained within the chemical equilibrium model, i.e., with , using the same computer program (SHARE), and the same data set. We see that the chemical equilibrium SHM cannot explain the horn in the ratio. The dashed line corresponds to the result obtained fixing but allowing to assume a best value. We see that, without , it is difficult if not impossible to obtain the large reduction of ratio with increasing energy. These findings are in line with prior attempts to explain the horn-structure, see, e.g., figure 4 in Cleymans:2004hj . We note that our semi-equilibrium results follow better the trend set by the experimental data, which is a consequence of the relaxation of exact strangeness conservation requirement. It appears that the full chemical non-equilibrium statistical hadronization model is required in order to obtain satisfactory understanding of the energy dependence of the ratio.
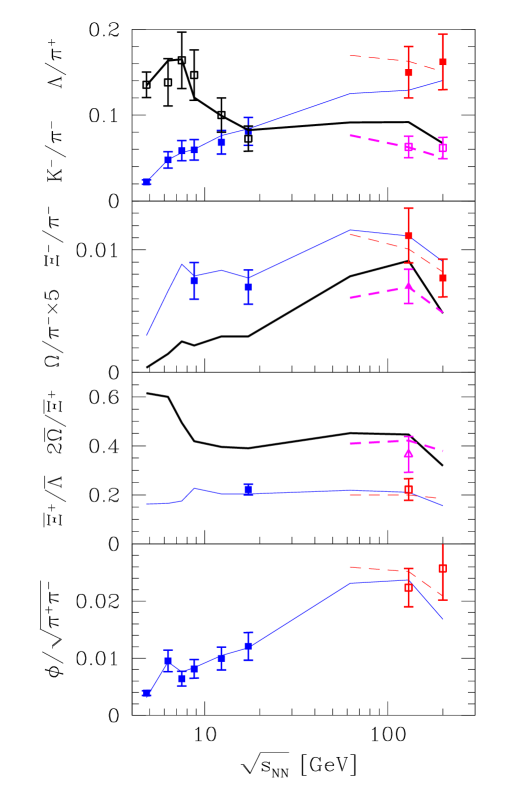
A graphic comparison of the experimental input, and theoretical output particle yields as function of energy for several other particles is seen in figure 3. We show with , with , with and at bottom . We are showing the total SHM yield ratios at AGS/SPS as well as at RHIC, connected by a solid line (thick and/or thin). The central rapidity yields at RHIC are also presented for comparison by the dashed lines. (in red and violet) .
The SHM allowing for chemical non-equilibrium reproduces all salient features of the experimental particle yield data well as function of energy, including the NA49 results that otherwise could not be described in equilibrium and semi-equilibrium approach Blume:2004ci , e.g., the already discussed ratio shown in figure 2. In addition, In figure 3, we note in the top panel the shift of quark population from its dominant baryon component (see ) at low reaction energy, to meson carriers (see K).
Of particular importance, in the study of quark–gluon plasma formation, is strange antibaryon enhancement. It is one of important signatures of deconfinement Rafelski:1982ii . These particles are hard to make in conventional environment, and also are highly sensitive probes of the medium from which they emerge. There is still only fragmentary data available for antibaryon ratios of interest, and shown in figure 3, in the third panel from the top.
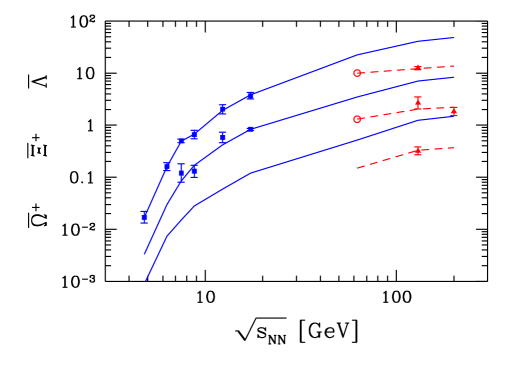
In figure 4, we show as function of energy the individual yields of and , along with the experimental data used as input. All three antihyperon production rates are predicted to rise at nearly the same rate as function of — indeed the strange antibaryon ratios, we have shown in figure 3, are as good as flat compared to the great variability of the absolute yields, which are increasing very rapidly, as is seen in figure 4. The strange antibaryon production enhancement phenomenon has been considered in terms of a comparison of yields of antibaryons to a baseline yield obtained scaling the or Be yields. This was done as function of impact parameter, and reaction energy Bruno:2004pv .
We note that the SHM non-equilibrium approach under-predicts by 1.5 s.d. the yields of and , for both SPS-NA49 results available at 40 and 158 GeV. We did not include 158 GeV results in our input data set since non-SHM source, such as chiral condensate Kapusta:2000ny , can generate such an excess,
Ratios of strange antibaryons are a sensitive probes of the medium. Once the deconfined phase is formed, the ratios of yields of strange antibaryons should not change drastically. Thus, our finding as function of energy in essence of a flat ratio, with minor fluctuations originating in the other experimental data and amplified by the sensitivity of these particles, suggest that the same form of (deconfined) matter is present at SPS and RHIC, except perhaps for the lowest SPS reaction energy.
Another important point is that these antihyperon ratios are relatively large, and hard to understand except in terms of the quark coalescence picture. It would be very interesting to confirm experimentally that, at AGS energy scale, is indeed as large as predicted in figure 3. This would establish coalescence quark chemistry in this low energy environment. Further, this maybe taken as an indication that the transition we observer at involves two deconfined phases of different structure. We will further discuss this in section 4.
2.5 Yields of pentaquark hadrons
There are now more than 600 papers with the title word ‘pentaquar’, however, on balance the evidence for the exotic hadrons with the quark content , and typical decays , and , with typical decays , is not convincing. The may have been observed by NA49 in interactions at top SPS energy NA49XIPQ . The remains uncertain: several high statistics confirmation experiments failed to find this state. Arguments were presented why these states were incorrectly identified Dzierba:2003cm . We have therefore not included these and other related exotic quark states from the hadron resonance list in SHARE, when performing the fits here presented.
| [ GeV] | 11.6 | 20 | 30 | 40 | 80 | 158 | 2075 | 9008 | 21321 |
|---|---|---|---|---|---|---|---|---|---|
| [GeV] | 4.84 | 6.26 | 7.61 | 8.76 | 12.32 | 17.27 | 62.4 | 130 | 200 |
| centrality | m.c. | 7% | 7% | 7% | 7% | 5% | 5% | 5% | 5% |
| 0.66 | 1.14 | 6.90 | 7.15 | 6.52 | 6.70 | 7.23 | 7.92 | 7.19 | |
| 0.0022 | 0.010 | 0.098 | 0.11 | 0.18 | 0.24 | 0.71 | 0.89 | 0.78 |
On the other hand, theoretical arguments for the existence of pentaquark states have not been refuted. We thus present in table 5 predictions for the production rates of and . These yields are highly sensitive to the hadronization conditions Letessier:2003by , and were obtained using the parameters of the fits here presented.
The expected statistical hadronization yield of rises rapidly, by an order of magnitude, between 11 and 30 GeV reaction energies and remains practically constant thereafter. The expected yield in fact exceeds the SHM predicted yield of in the threshold energy domain by a factor 2–4, and comparing to the observed yield at 158 GeV by more than a factor 4. Furthermore, at 30 GeV the background multiplicity is relatively small, while the rapidity range is also restricted compared to the top SPS energy, which should help finding the pentaquark, if it exists in the range of energies characterizing the horn in the K.
3 Fireball properties at breakup
3.1 Energy dependence of model parameters
The statistical parameters of the SHM are shown, as function of , in figure 5, for the entire energy domain. From top to bottom, we see the chemical freeze-out temperature , the statistical occupancy parameters and and the chemical potentials and . The error bars comprise the propagation of the experimental yield errors, as well as any uncertainty due to the shape of the minimum, seen in figure 1. The (red) triangle results are for the RHIC case, while (blue) squares are for the data throughout the energy domain and include the estimates we made for the RHIC energy range (at and 130 GeV, we do not show for these fits an error bar, as these results are solely our estimate).
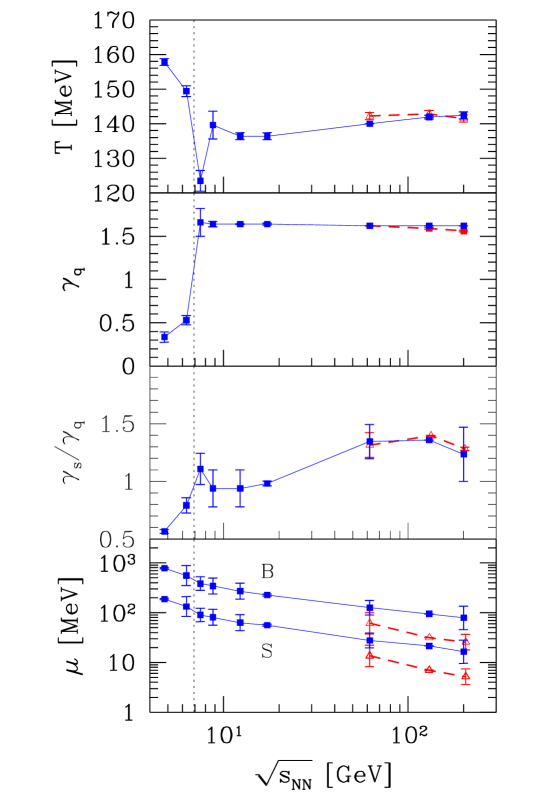
The only significant difference between RHIC and results is noted for the chemical potentials and and shown in the bottom panel (note logarithmic scale). The baryochemical potential drops relatively smoothly as the reaction energy is increased. The vertical line indicates the observed sudden change in the structure of the fireball. This is seen in all statistical variables, but most clearly in .
It is important to recall that we present evaluated using hadronic multiplicities. If these arise from breakup of a quark fireball, the quark-side occupancy parameters could be considerably different. The hadron-side phase space size is, in general, different from the quark-side phase space, since the particle degeneracies, and masses, are quite different. In the study of the breakup of the quark fireball into hadrons, we can compute the resultant hadron phase space occupancy for two extreme limits.
First, consider a fast transformation (sudden breakup) of the quark phase. This occurs nearly at fixed volume. To accommodate the difference in the momentum part of the phase space, the chemical occupancy non-equilibrium parameters undergo an abrupt change. We note that it is of no importance if there was or not a phase transition between the phases, what matters is that there was no time to reequilibrate chemically the quark yields. In the opposite limit of a very slow transformation of phases, there is available a prolonged period in time in which the volume of the system can change to accommodate the appropriate number of particles in chemical equilibrium corresponding to the maximum entropy content.
To determine the change in in sudden hadronization, one needs to compare in detail the phase space of quark phase with that of hadron gas. In order to make this comparison one must consider the energy and entropy content of the QGP phase. For , as well as small chemical potentials , lattice evaluation of the deconfined phase properties are available Aoki:2006we ; Aoki:2006br ; Fodor:2004nz ; Allton:2002zi . It is thus possible to model quantitatively the properties of the deconfined phase, and to compare these with the results of the SHM Kuznetsova:2006bh . The remarkable result is that near to MeV the sudden transition requires the value on the hadron side, if the quark phase was chemically equilibrated.
Thus, the large values of and , seen in figure 5 at large , where are consistent with sudden breakup of chemically equilibrated primordial QGP phase. Other dynamic effects, in particular fast expansion, in general also favor an over-saturated phase space with .
As seen in figure 5, rises at first rapidly, as expected if strangeness production is delayed by a greater threshold mass and has to catch up with the light hadron production. decreases beyond the edge of energy threshold, as can be expected due to the conversion of the quark to hadron occupancy discussed above. The rise resumes and continues for all energies above 80 GeV (note that, at RHIC only, results showing an error can be considered to arise from a fit).
3.2 Physical properties
We now turn our attention to the physical properties of the hadronizing fireball obtained summing individual properties of hadronic particles produced. One can view the consideration of the physical properties of the fireball at breakup as another way to present the SHM parameters. For example, the net baryon density, , is most directly related to the baryochemical potential , the thermal energy density is related to etc.
We present the physical properties, i.e., pressure , energy density , entropy density , net baryon density and the yield of strangeness , in table 6 for the AGS/SPS energy range considered. Note that contains hidden strangeness from and . At the bottom of table 6, we show the dimensionless ratios of extensive variables , and . These two ratios are very smooth as function of energy, and lack any large fluctuations that could be associated with fit error. These ratios are characteristic for the conditions of the fireball at the point of hadronization.
The results presented can be used to constrain dynamical models describing the evolution of the QGP fireball in time towards hadronization/particle freeze-out. We present the energy range at RHIC on left in table 7. We recall that the 62.4 GeV and the 130 GeV results, as well as in part the 200 results, are result of considerations which do not involve experimental measured particle yields. Thus, the results are to be seen as SHM sophisticated prediction. On right, in table 7, we present the results for central rapidity densities. Here, only the 62.4 GeV case is a prediction, the other results are direct consequence of the data interpretation in terms of SHM.
| E[GeV] | 11.6 | 20 | 30 | 40 | 80 | 158 |
|---|---|---|---|---|---|---|
| [GeV] | 4.84 | 6.26 | 7.61 | 8.76 | 12.32 | 17.27 |
| 21.9 | 21.3 | 58.4 | 68.0 | 82.3 | 76.9 | |
| 190.1 | 166.3 | 429.7 | 480.2 | 549.9 | 491.8 | |
| 1.25 | 1.21 | 2.74 | 3.07 | 3.54 | 3.26 | |
| 100 | 0.988 | 1.52 | 5.32 | 5.85 | 7.65 | 7.24 |
| 0.104 | 0.0753 | 0.184 | 0.186 | 0.167 | 0.121 | |
| 0.115 | 0.128 | 0.136 | 0.142 | 0.150 | 0.156 | |
| 0.96 | 0.92 | 1.27 | 1.20 | 1.14 | 1.11 |
| [GeV] | 62.4 | 130 | 200 | 62.4 | 130 | 200 |
|---|---|---|---|---|---|---|
| 82.4 | 87.8 | 80.0 | 80.5 | 91.4 | 94.5 | |
| 516.6 | 548.4 | 478.9 | 532.5 | 604.4 | 479.4 | |
| 3.62 | 3.73 | 3.32 | 3.64 | 4.03 | 3.32 | |
| 100 | 11.5 | 12.4 | 9.2 | 12.0 | 13.7 | 10.4 |
| 100 | 7.19 | 5.76 | 4.26 | 3.59 | 1.99 | 1.26 |
| 0.159 | 0.160 | 0.167 | 0.151 | 0.151 | 0.197 | |
| 1.02 | 1.04 | 1.01 | 1.03 | 1.04 | 1.02 | |
The fit uncertainty in the quantities presented in tables 6 and 7 is difficult to evaluate in detail. The individual physical properties require powers and exponents of statistical parameters, and thus, at first sight, we expect that the fractional errors are increased, as compared to those prevailing among statistical parameters in table 1. However, the dominant contributions to each physical property is often directly derived from the individual observed particle yields. Therefore, a large compensation of errors originating in the fitted statistical parameter errors must occur.
For example, most of the pressure at breakup is due to the most mobile, lightest particle, the pion. These yields are known to better than 10%, and thus, the pressure must be known to greater precision since there are further constraints from consistency of this yield with the yield of other particles. This explains why the results when presented graphically (see figure 6) are at 5% level smooth functions of , with fluctuations apparently at worse similar to those we see in the individual statistical SHM parameters. In future, one could hope to fit to the experimental data directly the physical properties, bypassing the statistical parameters. This can be done, in principle, considering the mathematical properties of these expressions. However, such study transcends considerably the scope of this paper, and it is indeed motivated by results we present for the first time here.
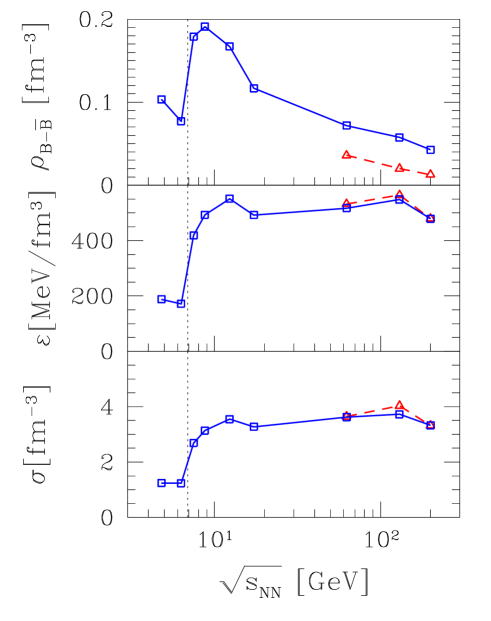
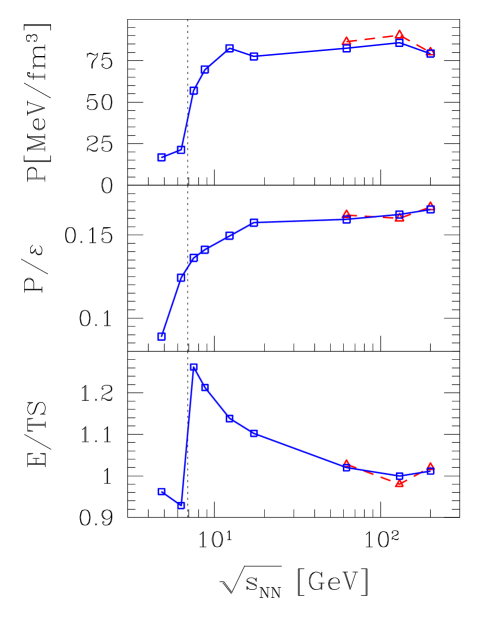
On the left hand side, in figure 6, we see from top to bottom the baryon density, the thermal energy density and the entropy density . On the right hand side, from top to bottom, we show the pressure , and the dimensionless ratio of pressure to thermal energy density , and . The triangles (red) correspond to the properties of the fireball at central rapidity at RHIC energy scale. We note a significant difference between the total fireball averages (squares) and the central rapidity result (triangles) only in the net baryon number density.
As the reaction energy passes the threshold, , the hadronizing fireball becomes much denser: the entropy density jumps by factor 4, and the energy and baryon number density by a factor 2–3. The hadron pressure increases from initially by factor 2, and ultimately more than factor 3. There is a more gradual increase of at low reaction energy to 0.165 at the top available energy. Also falls gradually from 0.9 down to 0.78 for the high density fireball.
The rather rapid change in the individual properties: entropy, energy, pressure is seen, in figure 6, to be largely compensatory, resulting in a smooth change in , and similarly . Even though there is a small residual variation reminding us of the sudden changes in the three factors in the ratio , this quantity is extraordinarily smooth. Moreover, we see the same value for the central rapidity as we find for the average over the entire fireball. Thus could be a universal hadronization constraint.
For AGS 11 GeV and SPS 20 GeV results, the value is greater, reaching to . This requires to be smaller, as is the case when the effective quark mass increases. A simple structure model employing a thermal quark mass, , was considered in Ref. RafRHIC . corresponds to the value of (usual for thermal QCD) and found in the limit of large and here large . has to rise to in order to explain the rise in . This points to a phase of ‘heavy’ quarks being at the origin of the increase of with decreasing . Such a heavy quark phase can be possibly a ‘valon’ quark phase and we pursue this further in section 4.4.
We believe that any structure model of the phase transformation, and/or the two phase structure will need to address , and/or freeze-out condition results quantitatively. These two ratios, and , are related. Restating the 1st law of thermodynamics:
| (6) |
For each hadron fraction with density the total fugacity is
| (7) |
where all valance quarks and antiquarks of each hadron fraction contribute in the product, see section 2 in share . In the limit of chemical equilibrium:
| (8) |
Thus, in this limit at the RHIC energy range, we expect that . However, the results in figure 6 show, the chemical non-equilibrium effects contribute considerably.
It is interesting to note that the same behavior of the physical properties of the fireball has also been obtained as function of the volume in the study of impact parameter dependence, see figure 4 in RafRHIC . In fact, the results we derived show an unexpected universality of the hadronizing fireball, which depends solely on the question if it occurs ‘below’ or ‘above’ the threshold in energy and volume size; the volume threshold corresponds to critical participant number .
At these values of and the associated baryon content at central rapidity RafRHIC , the grand canonical description of particle yields is still justified Rafelski:1980gk ; Rafelski:2001bu , also for strangeness. However, the fitted reaction volume (not further used in the present work) may be revised within the canonical approach by 10 – 20% for the most peripheral collisions studied in RafRHIC .
3.3 Strangeness and Entropy yield
The yield of strangeness produced, should the deconfined QGP fireball be formed, is sensitive to the initial conditions, especially to the temperature achieved. The standard results for strangeness relaxation time corresponds to fm/c Letessier:1996ad . When this result is used in model calculations addressing RHIC Rafelski:1999gq , one finds, assuming gluon thermal and chemical equilibrium, that the thermal strangeness production in the early stage suffices to saturate the QGP fireball phase space at hadronization.
Even so, there is considerable uncertainty how short the time required to relax strangeness flavor is, as the relaxation time lengthens with the square of the glue phase space under-occupancy, . Much of the uncertainty about the gluon chemical conditions prevailing in the initial thermal phase can be eliminated by considering the ratio of the number of strange quark pairs to the entropy . In the QGP, the dominant entropy production occurs during the initial glue thermalization , and the thermal strangeness production occurs in parallel and/or just a short time later. Moreover, both strangeness and entropy are nearly conserved in hadronization, and thus, the final state yield value for the ratio is directly related to the kinetic processes in the fireball at –3 fm/c. A thorough discussion of the observable is presented in Kuznetsova:2006bh , and detailed evaluation within a dynamical model of was obtained Letessier:2006wn . The following is a motivating introduction to these developments.
We first estimate the magnitude of in the QGP phase considering, in the hot early stage of the reaction, an equilibrated non-interacting QGP phase with perturbative properties:
| (9) | |||||
Here, we used for the number of flavors and . We see that the result is a slowly changing function of , for large we find at lowest SPS energies, the value of is reduced by 10%. Considering the slow dependence on of , there is further dependence on the temperature .
The rise with reaction energy toward the limiting value, for large , is driven by the decrease in and, importantly, by an increase in chemical strangeness equilibration with the QGP occupancy . The dependence on the degree of chemical equilibration which dominates the functional behavior with is:
| (10) |
Eq. (10) predicts a smooth increase in toward its maximum value which by counting the degrees of freedom appears to be , while the QGP source of particles approaches chemical equilibrium with increasing collision energy and/or increasing volume. It is important to keep in mind that the ratio is established early on in the reaction, and the above relations and associated chemical conditions we considered apply to the early hot phase of the fireball. Yet, strangeness and entropy, once created, cannot disappear as the more complex low temperature domain is developing. Specifically near to hadron freeze-out, the perturbative QGP picture used above does not apply. Gluons are likely to freeze faster than quarks and both are subject to much more complex non-perturbative behavior. But the value is preserved across this non-perturbative domain.
| E [GeV] | 11.6 | 20 | 30 | 40 | 80 | 158 |
|---|---|---|---|---|---|---|
| [GeV] | 4.84 | 6.26 | 7.61 | 8.76 | 12.32 | 17.27 |
| 375.5 | 347.9 | 349.2 | 349.9 | 350.3 | 362.0 | |
| 35.5 | 70.3 | 100.8 | 110 | 161 | 218 | |
| 100 | 0.788 | 1.26 | 1.94 | 1.90 | 2.16 | 2.22 |
| 0.095 | 0.202 | 0.289 | 0.314 | 0.459 | 0.60 | |
| [GeV] | 25,5 | 15.5 | 13.1 | 13.9 | 13.4 | 14.4 |
| 1.82 | 2.26 | 2.33 | 2.58 | 3.30 | 4.08 | |
| 0.752 | 0.722 | 0.612 | 0.589 | 0.536 | 0.472 | |
| 19.25 | 10.9 | 8.08 | 8.21 | 7.19 | 6.80 |
| [GeV] | 62.4 | 130 | 200 | 62.4 | 130 | 200 |
|---|---|---|---|---|---|---|
| , | 350 | 350 | 350 | 33.5 | 18.5 | 14.8 |
| , | 560 | 755 | 726 | 120.4 | 136.7 | 123 |
| 100 | 3.17 | 2.43 | 2.66 | 3.30 | 3.39 | 3.13 |
| 1.60 | 2.16 | 2.07 | 3.35 | 6.87 | 8.29 | |
| [GeV] | 19.5 | 30.1 | 48.3 | 9.31 | 9.46 | 12.06 |
| 7.18 | 9.52 | 11.24 | 14.8 | 30.4 | 38.2 | |
| 0.230 | 0.146 | 0.112 | 0.474 | 0.467 | 0.382 | |
| 4.49 | 4.41 | 5.41 | 4.42 | 4.42 | 4.60 | |
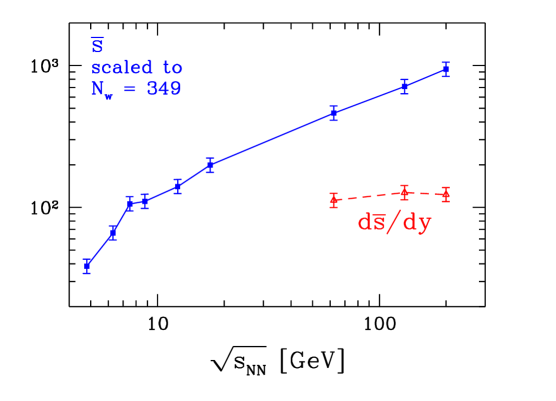
In tables 8 and 9, we present, in top portion, the strangeness production as function of reaction energy at AGS, SPS and RHIC, respectively. We give the baryon content and the total strangeness content of the fireball derived from the SHM fit to particle yield. Below, we see the above discussed strangeness per entropy ratio, and strangeness per net baryon number ratio. We present the increasing specific strangeness per baryon and per entropy yields in figure 7, two top panels. The remarkable result we find is that the specific per entropy yield of strangeness converges for top RHIC energy and central rapidity toward the QGP result obtained counting the degrees of freedom, see Eq. (9). The somewhat smaller values for the case are consistent with the average being made over the fragmentation region. This effect is greater in the ratio as we have to count all participant baryons.
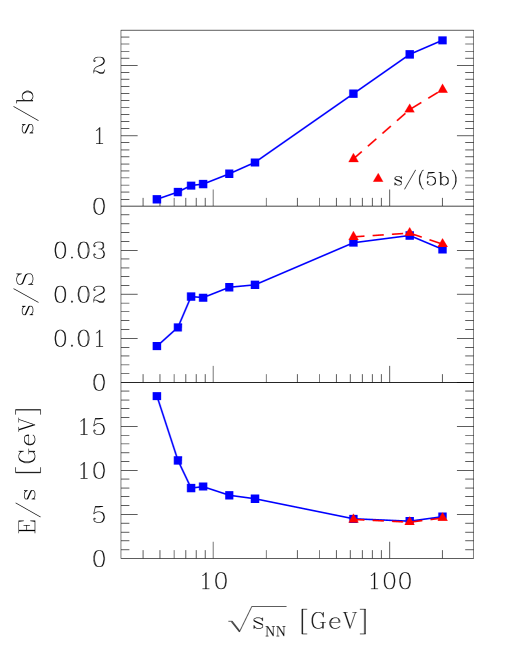
The middle section, in table 1, shows the center of momentum energy cost to make one strangeness pair. The micro canonical input variables, and , for this entry vary significantly along with, and as function of . Yet, we see that the result obtained varies smoothly, at first it diminishes finding a minimum at around GeV and it rises slowly thereafter. It is clearly more energy expansive to make strangeness at AGS, nearly by factor 2. A minimum in energy cost to make strangeness is near to 30 GeV beam energy, at the peak of horn.
The increase in cost of making strangeness can be attributed to the decreasing energy fraction stopped in the reaction. The energy stopping can be estimated by evaluating the per baryon thermal energy content and obtaining from this the fraction of the initial energy converted into thermal energy in the final state, , which fractions steadily drops from 75% at AGS to 48% at top SPS energy.
In terms of thermal energy, the cost of making strangeness pair is given in the last line of table 1. After an initial very rapid drop from AGS cost at GeV to 8 GeV near to the top of the horn, there follows a very slow and gradual decrease. We show this result graphically in the bottom panel in figure 7. This behavior clearly shows a rapid but smooth change-over in the underlying mechanism of strangeness production with increasing reaction energy, between 11.6 and 30 GeV. Once the new mechanism is fully operational, we have essentially a flat, slowly decreasing energy cost per strangeness. The drop we observe above 30 GeV can be thought to originate in transfer of thermal energy to the kinetic energy of collective expansion which we do not record in our analysis, and thus, it is conceivable that the cost in actual energy remains constant above .
As the bottom right of table 9 indicates, the fraction of energy stopped in the central rapidity region at RHIC, is rather large, it is estimated to be 58% at GeV decreasing to 36% at top RHIC energy. The energy cost to make strangeness extrapolates well from the SPS level, connecting smoothly, see the bottom panel in figure 7, for both total yield and central rapidity yield. We note, in passing, that only a small fraction, 10%, of the total energy is thermalized at the top RHIC energy considering the total fireball. 90% is evidently the energy of the collective flow, predominantly in the longitudinal direction.
The expectation of ever rising strangeness yield with are not disappointed in Fig. 8, but the rapid smooth rise is surprising. One finds such a result in a nearly model independent analysis adding up the carrier particles, which are mostly directly measured. A more precise study which adds up strangeness in the particles produced according to the SHM as seen in tables 8 and 9 is shown in figure 8 — there are non-negligible contributions of unobserved hidden strangeness, in particular in the hadron (40% content). We have scaled the strangeness yield to the 7% centrality with for the total yields. For the central rapidity, we present results for the 5% centrality.
4 Discussion and Interpretation
4.1 The K horn
One can wonder how, in qualitative terms, can a parameter , which controls the light quark yield, help explain the horn structure seen in figure 2. We observe that this horn structure in the ratio traces the final state valance quark ratio , and in language of quark phase space occupancies and fugacities , we have:
| (11) |
In chemical equilibrium models , and the horn effect must arise solely from the variation in the ratio and the change in temperature . The isospin factor is insignificant in this consideration. For the interesting range of freeze-out temperature, is a smooth function of . Normally, one expects that increases with collision energy, hence we expect an monotonic increase in the ratio, not considering the quark chemistry.
As collision energy is increased, increased hadron yield leads to a decreasing . We recall the smooth decrease of with reaction energy seen in bottom panel in figure 5. The two chemical fugacities and are coupled by the condition that the strangeness is conserved. The chemical potential effect is suggesting a smooth increase in the K ratio. With considerable effort, one can arrange the chemical equilibrium fits to bend over to a flat behavior at as the dotted line in figure 2 shows. It is quasi impossible to generate a horn with chemical equilibrium model.
Consideration of chemical non-equilibrium allows us to consider an energy dependent ratio , which as seen in Eq. (11) is a multiplicative factor in the horn structure. The fit produces a horn like behavior of at , seen in figure 5. As function of energy, many other particle yields must remain relatively smooth, with a few exceptions seen in figure 3. We see that the description of the horn structure is possible, as there are effectively three function of which help to create it, , and , but it is in no way assured that the right horn arises, seen the behavior with energy of the other particle yields.
Indeed, only the full chemical non-equilibrium model in which the two phase space occupancies, and , vary independently, does a good job as is seen comparing the solid with dashed and dotted lines in figure 2. Seen the horn-like structure of all these lines obtained relaxing strangeness conservation constraint we realize that it is not the increased number of parameters, but the fact that particle production follows the SHM with chemical non-equilibrium which allows the non-equilibrium model to succeed.
4.2 The K horn as function of reaction volume
The rather sudden changes in freeze-out parameters and appears to be a universal behavior. We established it here as function of energy, and in earlier work as function of the reaction volume (i.e., participant number ), see figure 1 in RafRHIC . In both cases, the chemical freeze-out temperature is higher below a threshold, as expressed either by low energy or participant number. The most drastic change is that jumps up from a value at, or below 0.5, to 1.6 as either the energy or volume threshold is crossed. The volume threshold is, however, not as sharp as the reaction energy threshold. The large system limit is achieved for , with a smooth transition beginning at , as can be seen in figure 4 in RafRHIC .
Seeing this remark, one immediately wonders if the horn is present in the impact parameter kaon and pion data and the answer is no. Actually, this is not surprising: since both and originate, in our study, at the level of about 50% in directly thermally produced particles the ratio is a measure of the horn structure is due to a rise in density of strangeness at hadronization, outpaced by the rise in the density above , whatever the mechanism in terms of statistical parameters that implements this. However, when considering the impact parameter dependence at GeV, the rise in strangeness has yet to occur, as in the small volume there has insufficient life span to produce strangeness. In this situation we do not expect that the horn is present as function of .
One can see the delayed production of strangeness as function of impact parameter directly in the PHENIX impact parameter data phenixyield , without need for a detailed theoretical analysis. Consider the ratio shown in figure 9: . This particular product-ratio of particles is nearly independent of chemical potentials and the volume since it comprises ratio of products of particles and antiparticles. The rise seen in figure 9 is evidence for an additional strangeness production mechanism turning on at about . In figure 9 we do not show a common systematic error, thus the normalization scale of the figure could undergo a revision. This cannot change the insight that the additional strangeness above and beyond the first collision content is produced for , enhancing the global yield by 50% or more. Moreover, we see that the rise is gradual as can be expected in kinetic theory models of strangeness production Letessier:1996ad ; Letessier:2006wn , and there is at the maximum centrality no evidence as yet of strangeness yield saturation.
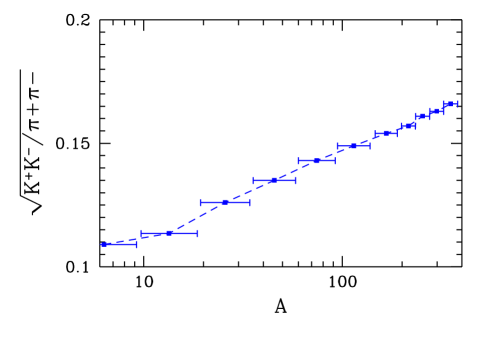
The entropy content of the small system is such that strangeness per entropy is at the level of , and both entropy and strangeness rise with centrality of the reaction at GeV. However, unlike the energy dependence, the ratio rises modestly, strangeness does not outpace entropy rise by more than 20%. This is in agreement with expectation, since the threshold of strangeness mass is not fully relevant at the top RHIC reaction energy, and thus we are seeing the properties of a deconfined initial state in which strange quark is effectively massless. Instead, it is the lifespan of the system that matters, as noted above.
There is very little observed dependence of ratios of hadron resonances with the ground state yields, such as . This implies and agrees in quantitative way with the tacit assumption inherent in the above discussion, and the result of a more detailed analysis RafRHIC , that there is no dependence of the freeze-out conditions for . For this reason for ratios of all hadrons which do not involve a difference in strangeness content, do not vary with centrality.
We further note that there is little change in chemical potentials with centrality for , indicating that the stopping of baryons is not a result of multiple scattering, but is due to phase conditions of matter. Comparing other properties of matter, we see very much the same behavior as function of impact parameter and reaction energy: in particular, we note the step up in pressure, in energy density, and in entropy density at the impact parameter threshold RafRHIC .
4.3 Chemical equilibrium or non-equilibrium?
An important questions discussed in the study of hadron yields interpretations is if chemical equilibrium or non-equilibrium prevails in the hadronization process. There are workers who strongly defend the chemical equilibrium SHM Braun-Munzinger:2003zd . Let us look again at the survey of fit quality results seen in figure 1. We note that for (but ) at each energy there seems to exist a reasonable fit with for the data sample considered, which suggests that at each reaction energy with a reasonable and widely accepted physical description of the experimental data emerges. This result is therefore claimed in studies that focus on the hadron yields at each energy separately. What works poorly in SHM used with and even worse with is the energy dependence of particle ratios, with the most prominent present day example being the horn structure in the yield ratio. Seen from this perspective, it is the energy dependent particle yield that requires the inclusion in the necessary set of parameters a varying value .
Another important question directly related to the issue of chemical equilibrium and non-equilibrium is how the fitted results for , the ‘hadronization curve’ relate to the phase boundary between deconfined primary phase and the hadron phase. Clearly, the result of the fit are greatly dependent on the assumption about chemical condition with the equilibrium fit claiming a hadronization at RHIC at MeV.
The rapidly decreasing freeze-out temperature as decreases, and which is certainly inconsistent with the rather flat phase transition boundary at moderate chemical potentials is explained by suggesting that the hadronization may be related to a particular values of energy per particle content, of the magnitude 1 GeV Braun-Munzinger:2003zd . However, this condition, though not rooted in any known basic physical principle, is also obtained in some dynamical studies, see, e.g., Ref. Bleicher:2002dm ; Bratkovskaya:2004kv . We note that the chemical equilibrium hypothesis fails to explain the hadronization conditions expected as function of and , or equivalently, as function of .
In summary, the interpretation of hadron production in terms of chemical equilibrium SHM disagrees, in quantitative manner, both with the reaction energy dependent particle yields (such as the K horn) and the reaction energy dependent shape of hadronization boundary.
4.4 Hadronization boundary in heavy ion collisions
We believe that the hadronization boundary, in the – plane, is the result of a complex interplay between the dynamics of heavy ion reaction and the properties of both phases of matter, the inside of the fireball, and the hadron phase we observe. Even disregarding complications related to the rapid expansion of the dense matter fireball, the presence of chemical non-equilibrium particle distributions introduces significant freedom into the shape and location of the transition region.
Recall, first, that available lattice results apply to a system in the thermodynamic limit with = 1, for both quark and confined hadron phases. The typical boundary between the QGP and hadron phases is discussed in Ref. Fodor:2004nz , and is dependent on chemical properties of QGP. Typically, one considers the dependence on chemical potentials, and in particular on , however, a significant change in the phase boundary location is to be expected when and 1. To understand this important remark, consider the two other known cases corresponding to 2 flavors, and corresponding to pure gauge. There is a significant change in , which increases with decreasing .
Moreover, not only the location but also the nature of the phase boundary can be modified by variation of . We recall that for the 2+1 flavor case, there is possibly a critical point at finite baryochemical potential with MeV Fodor:2004nz ; Allton:2005gk . However, for the case of 3 massless flavors there can be a 1st order transition at all Peikert:1998jz ; Bernard:2004je . Considering a classical particle system, one easily sees that an over-saturated phase space, e.g., with for the purpose of the study of the phase transition acts as being equivalent to a system with 3.2 light quarks and 1.6 massive (strange) quarks present in the confined hadron phase.
Even though one should be keenly aware that over-saturation of the phase space is not the same as additional degeneracy due to true degrees of freedom, the similarity of resulting effect must be considerable. We know that with increasing , the increased quark density creates the environment in which the phase cross-over becomes a phase transition. The influence of cannot be different. Considering that enhances both quark and antiquark number, it should be more effective compared to in its facilitation of a phase transition, and reduction of the temperature of the phase boundary for .
We therefore can expect that, for a chemically over-saturated system, there is also an effective increase in the number of degrees of freedom. Looking at the structure of the quark-hadron transformation this increase in the number of available effective degrees of freedom occurs in a physical system which is almost, but not quite, able to undergo a 1st order phase transition. Considering here also the sudden nature of the fireball breakup seen in several observables RBRC , we conjecture that the hadronizing fireball leading to passes a true phase boundary corresponding to a 1st order phase transition condition at small . Because of the changed count in the degrees of freedom, we expect that the phase transition temperature is at the same time decreased to below the cross-over value for chemical equilibrium case of 2+1 flavors near MeV.
It seems to us that it would be very interesting to determine, in as more rigorous way for the case of the 2+1 flavor lattice QCD at for which values, if any, of the system undergoes a phase transition of 1st order. Lattice QCD methods employed to obtain results at finite , e.g., the power expansion Allton:2005gk ; Allton:2003vx , should also allow to study the case of , and near to , i.e. . We see the actual difficulty in the need to simulate different values of in the two phases, such that the quark pair content is preserved across the phase boundary.
The dynamical, and theoretically less spectacular, effect capable to shift the location in temperature of the expected phase boundary, is due to the expansion dynamics of the fireball. The analysis of the RHIC results suggests that the collective flow occurs at parton level Huang:2005nd . Collective flow of color (partons) is like a wind capable to push out the color non transparent ‘true’ vacuum Csorgo:2002kt , adding to thermal pressure the dynamical component, for a finite expanding system this would lead to supercooling suddenPRL . This dynamical effect will push the hadronization condition to lower local freeze-out at high , thus flattening the boundary between the phases as function of . In the context of results we have obtained, it is the smoothness of the ratio obtained at hadronization which supports the possible relevance of dynamic phase boundary displacement. This behavior suggests a smoothly changing dynamical break up condition, potentially related to (hydrodynamic) flow.
4.5 Our hadronization boundary and its interpretation
The above two effects, the change in the location of the static phase boundary in presence of chemical non-equilibrium and the dynamics of collective matter flow toward breakup condition, are both non-negligible but hard to evaluate quantitatively. We believe that they can explain why the chemical freeze-out conditions and are as presented in figure 5. Of particular relevance is the low value of at high reaction energy, and relatively high value of at low reaction energy, just opposite what one finds to be result of SHM analysis when chemical equilibrium is assumed.
Our chemical freeze-out conditions are better shown in the – plane, see figure 10. Considering results shown in figure 5, we are able to assign to each point in the – plane the associate value of . The RHIC results are to outer left. They are followed by RHIC and SPS results. The dip corresponds to the 30 and 40 GeV SPS results. The top right is the lowest 20 GeV SPS and top 11.6 GeV AGS energy range. We see that the chemical freeze-out temperature rises for the two lowest reaction energies 11.6 and 20 GeV to near the Hagedorn temperature, MeV. Such phase structure is discussed e.g. in the context of chiral quark pairing Kitazawa:2001ft .
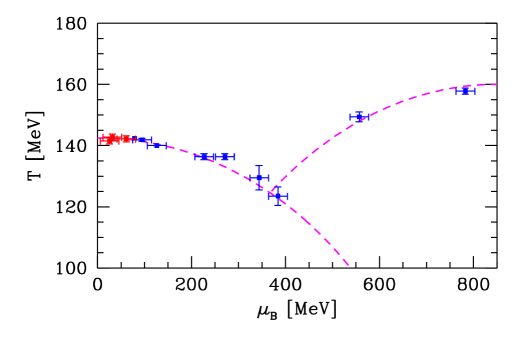
The size of error bars, in figure 10, is output of the fit process, and when it is rather large, it implies that the resulting profile was relatively flat, or/and that there were two neighboring god fit minima. To guide the eye, we have added two lines connecting the fit results. As seen in figure 10, at , we find that hadronization occurs at , decreasing to MeV at MeV. Along this line . As argued in the previous subsection 4.4, this line could be a true 1st order phase boundary between quark matter and an over-saturated hadron phase.
Two different interpretations come to mind when we attempt to understand the other branch in figure 10, the rise from to 160 for , which is accompanied by a rather low hadron side phase space occupancy. Most ‘natural’ is to presume that the dissolution of color bonds did not occur in heavy ion collisions below 30 GeV, we are dealing with ‘conventional’ hadron matter. The under-saturation occurs since there was no time to make hadrons, i.e., chemical equilibration was not achieved in the colliding hadron system before it breaks apart.
The fireball break-up at a higher temperature is a consistent freeze-out scenario for under-saturated hadron phase space considering the kinetic scattering freeze-out condition. Given the greatly reduced particle density () a high freeze-out for is consistent. The nucleon density scales with and pion density with . Therefore the meson–baryon and meson–meson scattering length scales as , and , respectively. This implies that, as the system expands, it is able to freeze out early at a higher .
On the other hand, the volume size we found, see table 1, is significantly larger at low reaction energies. This implies that a scenario with pure hadron matter present is subject to a quite different expansion history. This signals that a standard picture of a conventional hadron matter formation at reaction energies below the transition point at may not be the valid explanation of results of our analysis. Namely, if the reaction history since first contact is different for the two reaction energy ranges, one would expect that the systematics of the final state entropy production, strangeness production, and strange antibaryon production has a visible break at the critical point. What we have found is, instead, that these quantities show a rather smooth uninterrupted rise with reaction energy.
This means that the the initial conditions reached in the reaction where, e.g., entropy and strangeness are produced, is not undergoing a sudden change. The change occurs at the end near to the hadronization of matter. For this reason, we see a change in particle yields (the horn), statistical parameters jump, and the physical conditions at hadronization jump even more. The yields of quantities which are driven by physics of the initial dense matter formation, e.g., entropy content, strangeness content, change smoothly with heavy ion reaction energy in the domain we explored. We are furthermore swayed away from the picture of the hadronic gas being the form of matter at breakup below by the strange antibaryon production systematics we discussed in figure 4.
We are searching thus for an explanation in terms of a new phase of matter being involved in the hadronization process, but clearly this cannot be the semi-perturbative quark–gluon plasma state. The conceivable explanation of the fit result below 30 GeV is presence, at the high baryon density arising at large , of a constituent quark plasma Roizen:2004cy . Even if the perturbative QCD quark phase is reached at high temperature, in expansion–cooling the system encounters the valon (word derived from ‘valance’ quark) phase in which the color quark bonds are broken, but chiral symmetry restoration is not completed, with quarks of mass MeV and MeV being the only active degrees of freedom. This scenario is not inconsistent with the finding on the lattice, that, for and in chemical equilibrium, the chiral symmetry restoration coincides with deconfinement transition.
In a valon matter, even assuming chemical equilibrium, the number of quark pairs at temperature near to MeV would be rather small, given the high constituent quark mass. In breakup of this system, a relatively small is achieved. Furthermore, since the mass of these constituent quarks is greater than that of the pion, the phase transformation between hadron and valon matter occurs at relatively large . To see this, recall that the pion with its low mass produces greater pressure than valons and thus is pushing the transition boundary to higher . Strangeness, and importantly the entropy content in this phase arise due to prior initial state perturbative QGP phase and hence such a valon system must be larger in volume at the point of hadronization.
It is also conceivable that a hadron fireball evolving from the beginning and fully in the valon phase would maintain much of the continuity we saw in hadronic observables. For example, and -valon-quark scattering can produce strange valon-quark pairs, and these give rise in hadronization to the abundances of strange antibaryons, as expected in the deconfined phase. What speaks for this option is the rather sudden change in the thermal energy content per strange quark pair produced, which is seen in bottom of figure 7, indicating appearance of a new energy efficient mechanism of strangeness production above .
One may wonder how our findings compare to earlier studies of the phase boundary, both in statistical models Becattini:2003wp , and microscopic models (see Ref. Bratkovskaya:2004kv and references therein). In the microscopic models one accomplishes a better understanding of the approach to thermal and chemical equilibrium of the degrees of freedom employed. A continuous phase boundary is, here, a direct outcome of the assumption made about the degrees of freedom present. Our analysis, which does not rely on such assumptions, is thus less model dependent and allows for presence of degrees of freedom with unexpected properties. On the other hand, we also firmly believe, as is shown in figure 10 that there is a smooth phase boundary, with dropping with increasing . What our study has uncovered is the possible presence of another phase boundary for MeV at higher . It is important for the reader to keep in mind that this finding is not in conflict with theoretical chemical equilibrium results which focus on the other, conventional, phase branch and address physics of phase transformation occurring in the early Universe.
Moreover, a recent study of the low energy AGS pion production data Klay:2003zf found that the thermal freeze-out temperature at reaction energy of 8 GeV is at MeV Pin-zhen:2005ca . Thus there is also consistency of our present analysis with the shape of pion transverse mass spectra and the high chemical freeze-out temperature we find at AGS. Another interesting finding was the medium mass modification which allowed to describe pion decay spectra.
4.6 Final remarks
In summary, we have performed a complete analysis of the energy dependence of hadron production in heavy ion collisions, spanning the range beginning at the top AGS energy, to the top RHIC energy. We have made extensive predictions about particle production in the entire energy range. These results are useful in several respects. For example, we have shown that the best energy to search for the elusive pentaquarks would be at SPS at 30–40 GeV, where we find that the total yield of is already fully developed. Thus there is a maximum in the ratio at 30 GeV. Of course, this finding presupposes the existence of the exotic state.
We have furthermore presented hadron yields important in the understanding of dilepton spectra, such as and . The relative meson resonance yields we find do not follow the systematics and vary as function of energy. One thus can test the hadronization picture here presented in study of resonance production. This observation was recently exploited in a systematic fashion Torrieri:2006yb .
We have shown that the threshold in energy which generates a horn in the yield ratio can be associated with the chemical freeze-out shifting rather rapidly toward condition of greatly increased hadronization densities. This transition separates the high entropy density phase at high heavy ion reaction energy from a low entropy density phase. This behavior parallels the findings for impact parameter dependence of RHIC results, where the low entropy density phase is seen for small reaction volumes present at large impact parameters RafRHIC .
Several observables, including strangeness production, show continuity across the energy threshold at , thus, it seems that the critical conditions expresses a change in the nature of the fireball breakup, and to a lesser degree a reaction energy dependent change in the nature of initial conditions reached in the reaction.
We have discussed, in depth, our findings about the hadronization condition and have argued that at high reaction energies a 1st-order phase transition is arising in the chemically non-equilibrated hot hadronic matter system. Detailed discussion was presented about possible changes in phases of hadronic matter as function of reaction energy and reaction volume.
Acknowledgements.
This manuscript nucl-th/0504028, on which this work is based, has been first web-published in April, 2005. We undertook the current revision to correct an entropy yield error which the early SHARE release contained. This changes entropy related table entries and figures, the data fits are unaffected. When redoing the fits to obtain entropy, we incorporated the latest strange hadron yields of NA49 as available. We thank NA49 and PHENIX collaborations for valuable comments regarding the acceptances of weak decays. We thank M. Gaździcki and G. Torrieri for valuable comments. Work supported in part by a grant from: the U.S. Department of Energy DE-FG02-04ER4131. LPTHE, Univ. Paris 6 et 7 is: Unité mixte de Recherche du CNRS, UMR7589.References
-
(1)
For theoretical evaluation see:
Nucl. Phys. A 750, Issue 1, pp 1-171 (March 2005);
for experimental evaluation see:
Nucl. Phys. A 757, Issue 1, pp 1-283 (August 2005). - (2) M. Gaździcki et al. [NA49 Collaboration], J. Phys. G 30, S701 (2004).
- (3) J. Rafelski, J. Letessier and G. Torrieri, “Centrality dependence of bulk fireball properties at RHIC,” [arXiv:nucl-th/0412072], Phys. Rev. C (in press) (2005).
- (4) J. Letessier and J. Rafelski, Phys. Rev. C 59, 947 (1999).
- (5) J. Kapusta, B. Muller, J. Rafelski, “Quark-gluon plasma : Theoretical foundations, an annotated reprint collection”, Elsevier (Amsterdam 2003), and references therein.
- (6) J. Rafelski and B. Müller, Phys. Rev. Lett. 48, 1066 (1982) [Erratum-ibid. 56, 2334 (1986)].
- (7) N. K. Glendenning and J. Rafelski, Phys. Rev. C 31, 823 (1985); note that in Fig. 2 the pion yield from resonance decays is not included, this dilutes the expected yields by about factor two, flattening the curve.
-
(8)
J. Letessier, A. Tounsi, U. Heinz, J. Sollfrank and J. Rafelski,
Phys. Rev. Lett. 70, 3530 (1993), and
Phys. Rev. D 51, 3408 (1995). - (9) P. Koch, B. Muller and J. Rafelski, Phys. Rept. 142, 167 (1986).
- (10) P. Koch and J. Rafelski, Nucl. Phys. A 444, 678 (1985).
-
(11)
J. Rafelski and M. Danos,
Perspectives In High-Energy Nuclear Collisions,
NBSIR-83-2725 and GSI-83-6, see section 5, KEK scan available at
http://ccdb3fs.kek.jp/cgi-bin/imgindex?200031578;
update: Lecture Notes in Physics, 231, 361 (1985) (Springer-Verlag, Berlin);
M. Danos and J. Rafelski, Heavy Ion Phys. 14, 97 (2001) (M. Danos memorial volume). - (12) M. Kitazawa, T. Koide, T. Kunihiro and Y. Nemoto, Phys. Rev. D 65, 091504(R) (2002).
-
(13)
M. Gaździcki,
Acta Phys. Polon. B 34 (2003) 5771;
M. Gaździcki and M. I. Gorenstein, Acta Phys. Polon. B 30, 2705 (1999). -
(14)
G. Torrieri, W. Broniowski, W. Florkowski, J. Letessier and J. Rafelski,
Comp. Phys. Com. 167, 229 (2005), and references therein
by the authors; and
G. Torrieri, S. Jeon, J. Letessier and J. Rafelski, Comput. Phys. Commun. 175 (2006) 635, and see further updates at: www.physics.arizona.edu/torrieri/SHARE/share.html - (15) G. Torrieri and J. Rafelski, J. Phys. G 30, S557 (2004).
- (16) J. Letessier and J. Rafelski, Int. J. Mod. Phys. E 9, 107, (2000).
- (17) P. Koch, J. Rafelski and W. Greiner, Phys. Lett. B 123, 151 (1983).
- (18) I. G. Bearden et al. [BRAHMS Collaboration], Phys. Rev. Lett. 90, 102301 (2003).
- (19) F. Becattini, J. Cleymans, A. Keranen, E. Suhonen and K. Redlich, Phys. Rev. C 64, 024901 (2001).
- (20) V. Friese [NA49 Collaboration], Nucl. Phys. A 698, 487 (2002).
- (21) J. Rafelski, J. Letessier and G. Torrieri, Phys. Rev. C 64, 054907 (2001) [Erratum-ibid. C 65, 069902 (2002)].
- (22) C. Blume [NA49 Collaboration], J. Phys. G 31, S685 (2005).
- (23) J. I. Kapusta and S. M. H. Wong, Phys. Rev. Lett. 86, 4251 (2001).
- (24) J. Letessier, J. Rafelski and G. Torrieri, “Deconfinement energy threshold: Analysis of hadron yields at 11.6-A-GeV,” [arXiv:nucl-th/0411047].
- (25) The results of NA49 experiment used here have been provded upon our request by M. Gazdzicki and B. Lungwitz, (private communication, compilation of September 2006), which documentation includs explanation of the treatment of weak decays. Among sources of these results we note in particular the follwoing works Gaz ; Friese:2002re ; Blume:2004ci ; Friese03 ; [2] ; [3] ; [4] ; [5] ; [6] ; [7] ; [8] ; [9] ; [10] ; [11] ; [12] ; [13] ; [14] ; [15] ; [16] ; [17] ; [18] ; [19] ; [20] ; [21] ; [22] ; [23] ; [24] ; [25] ; [26] . The abstraction of these 28 works with in part not entirely consistent result tables (due to varying WD corrections, and some time dependence of preliminary results) into a 11 page table set appears to us to be solely possible by these key members of the NA49 collaboration. We thank Drs. M. Gazdzicki and B. Lungwitz, for their kind help.
- (26) V. Friese et al. [The NA49 Collaboration], J. Phys. G 30, S119 (2004).
- (27) C. Alt et al., Phys. Rev. C 73 (2006) 044910.
- (28) A. Richard [NA49 Collaboration], J. Phys. G 31 (2005) S155.
- (29) C. Blume [NA49 Collaboration], J. Phys. G 31 (2005) S685.
- (30) C. Alt et al. [The NA49 Collaboration], J. Phys. G 30, S119 (2004).
- (31) P. Dinkelaker [NA49 Collaboration], J. Phys. G 31 (2005) S1131.
- (32) S. V. Afanasiev et al. [The NA49 Collaboration], Phys. Rev. C 66 (2002) 054902.
- (33) T. Anticic et al., Phys. Rev. C 69 (2004) 024902.
- (34) S. V. Afanasiev et al., Nucl. Phys. A 715 (2003) 161.
- (35) T. Anticic et al. [NA49 Collaboration], Phys. Rev. Lett. 93, 022302 (2004).
- (36) C. Meurer [NA49 Collaboration], J. Phys. G 30, S1325 (2004).
- (37) M. Mitrovski [NA49 Collaboration], Acta Phys.Hung. A24 (2005) 157..
- (38) C. Alt et al. [NA49 Collaboration], Phys. Rev. Lett. 94 (2005) 192301.
- (39) J. Bachler et al. [NA49 Collaboration], Nucl. Phys. A 661 (1999) 45.
- (40) C. Alt et al. [NA49 Collaboration], Eur. Phys. J. C 45 (2006) 343.
- (41) S. V. Afanasev et al. [NA49 Collaboration], J. Phys. G 27 (2001) 367.
- (42) S. V. Afanasev et al. [NA49 Collaboration], Phys. Lett. B 491 (2000) 59.
- (43) C. Alt et al. [NA49 Collaboration], “Pion and kaon production in central Pb+Pb collisions at 20A and 30A GeV: Evidence for the onset of deconfinement,” arXiv:0710.0118 [nucl-ex].
- (44) T. Susa [NA49 Collaboration], Nucl. Phys. A 698 (2002) 491.
- (45) C. Alt et al. [NA49 Collaboration], Phys. Rev. Lett. 94 (2005) 052301.
- (46) I. Kraus [NA49 Collaboration], J. Phys. G 31 (2005) S147.
- (47) A. Mischke et al., Nucl. Phys. A 715, 453 (2003).
- (48) G. I. Veres [NA49 Collaboration], Nucl. Phys. A 661 (1999) 383.
- (49) V. Friese [NA49 Collaboration], Nucl. Phys. A 698 (2002) 487.
- (50) S. V. Afanasiev et al. [NA49 Collaboration], Phys. Lett. B 538 (2002) 275.
- (51) M. Mitrovski, J.Phys. G32 (2006) S43.
- (52) J. Rafelski and J. Letessier, Acta Phys. Polon. B 34, 5791 (2003); and J. Phys. G 30 (2004) S1.
- (53) B. B. Back et al. [E917 Collaboration], Phys. Rev. C 69, 054901 (2004).
- (54) J. Cleymans, H. Oeschler, K. Redlich and S. Wheaton Phys. Lett. B 615, 50 (2005).
- (55) J. Cleymans and K. Redlich, Phys. Rev. C 60, 054908 (1999).
- (56) K. Adcox et al. [PHENIX Collaboration], Phys. Rev. C 69, 024904 (2004).
- (57) C. Adler et al. [STAR Collaboration], Phys. Rev. Lett. 89, 092301 (2002).
- (58) K. Adcox et al. [PHENIX Collaboration], Phys. Rev. Lett. 89, 092302 (2002).
- (59) J. Adams et al. [STAR Collaboration], Phys. Rev. Lett. 92, 182301 (2004).
- (60) C. Adler et al. [STAR Collaboration], Phys. Rev. C 66, 061901 (2002).
- (61) C. Adler et al., Phys. Rev. C 65, 041901 (2002).
- (62) S. S. Adler et al. [PHENIX Collaboration], Phys. Rev. C 69, 034909 (2004).
-
(63)
H. B. Zhang [STAR Collaboration],
“Delta, K* and rho resonance production and their probing of freeze-out
dynamics at RHIC,”
[arXiv:nucl-ex/0403010];
J. Adams [STAR Collaboration], Phys. Rev. C 71 064902 (2005). - (64) C. Markert [STAR Collaboration], J. Phys. G 30, S1313 (2004).
- (65) J. Adams et al. [STAR Collaboration], Phys. Lett. B 612, 181 (2005).
- (66) D. Elia [NA57 Collaboration], J. Phys. G 31, S135 (2005).
- (67) I. G. Bearden et al. [BRAHMS Collaboration], Phys. Rev. Lett. 94, 162301 (2005).
- (68) B. B. Back et al., Phys. Rev. Lett. 91, 052303 (2003).
- (69) I. G. Bearden et al. [BRAHMS Collaboration], Phys. Rev. Lett. 93, 102301 (2004).
- (70) J. Rafelski, Phys. Rept. 88, 331 (1982).
- (71) G. E. Bruno [NA57 Collaboration], J. Phys. G 30, S717 (2004).
- (72) C. Alt et al. [NA49 Collaboration], Phys. Rev. Lett. 92, 042003 (2004).
- (73) A. R. Dzierba, D. Krop, M. Swat, S. Teige and A. P. Szczepaniak, Phys. Rev. D 69 (2004) 051901 [arXiv:hep-ph/0311125].
- (74) J. Letessier, G. Torrieri, S. Steinke and J. Rafelski, Phys. Rev. C 68, 061901(R) (2003).
- (75) Y. Aoki, G. Endrodi, Z. Fodor, S. D. Katz and K. K. Szabo, Nature 443 (2006) 675 [arXiv:hep-lat/0611014].
- (76) Y. Aoki, Z. Fodor, S. D. Katz and K. K. Szabo, Phys. Lett. B 643 (2006) 46 [arXiv:hep-lat/0609068].
- (77) Z. Fodor and S. D. Katz, JHEP 0404, 050 (2004), and references therein.
- (78) C. R. Allton et al., Phys. Rev. D 66, 074507 (2002).
- (79) I. Kuznetsova and J. Rafelski, Eur. Phys. J. C 51 (2007) 113 [arXiv:hep-ph/0607203].
- (80) J. Rafelski and M. Danos, Phys. Lett. B 97, 279 (1980).
- (81) J. Rafelski and J. Letessier, J. Phys. G 28, 1819 (2002).
- (82) J. Letessier, A. Tounsi and J. Rafelski, Phys. Lett. B 389 (1996) 586.
- (83) J. Rafelski and J. Letessier, Phys. Lett. B 469, 12 (1999).
- (84) J. Letessier and J. Rafelski, Phys. Rev. C 75 (2007) 014905 [arXiv:nucl-th/0602047].
- (85) P. Braun-Munzinger, K. Redlich and J. Stachel, in Quark Gluon Plasma 3, eds. R.C. Hwa and Xin-Nian Wang, World Scientific Publishing, and references therein.
- (86) M. Bleicher and J. Aichelin, Phys. Lett. B 530, 81 (2002).
- (87) E. L. Bratkovskaya et al., Phys. Rev. C 69, 054907 (2004).
- (88) C. R. Allton, M. Doring, S. Ejiri, S.J. Hands, O. Kaczmarek, F. Karsch, E. Laermann, and K. Redlich, Phys. Rev. D 71, 054508 (2005).
- (89) A. Peikert, F. Karsch, E. Laermann and B. Sturm, Nucl. Phys. Proc. Suppl. 73, 468 (1999).
- (90) C. Bernard et al. [MILC Collaboration], Phys. Rev. D 71, 034504 (2005).
- (91) C. R. Allton, S. Ejiri, S. J. Hands, O. Kaczmarek, F. Karsch, E. Laermann and C. Schmidt, Phys. Rev. D 68, 014507 (2003).
- (92) H. Z. Huang and J. Rafelski, in AIP Conf. Proc. 756, 210 (2005).
- (93) T. Csorgo and J. Zimanyi, Heavy Ion Phys. 17, 281 (2003).
- (94) J. Rafelski and J. Letessier, Phys. Rev. Lett. 85, 4695 (2000).
- (95) I. I. Roizen, E. L. Feinberg and O. D. Chernavskaya, Phys. Usp. 47, 427 (2004) [Usp. Fiz. Nauk 47, 427 (2004)].
- (96) F. Becattini, M. Gazdzicki, A. Keranen, J. Manninen and R. Stock, Phys. Rev. C 69, 024905 (2004).
- (97) J. L. Klay et al. [E-0895 Collaboration], Phys. Rev. C 68, 054905 (2003).
- (98) B. Pin-zhen and J. Rafelski, Eur. Phys. J. A 32, 267 (2007).
- (99) G. Torrieri and J. Rafelski, Phys. Rev. C 75, 024902 (2007) [arXiv:nucl-th/0608061].