Bounds on the presence of quantum chaos in nuclear masses
Abstract
Differences between measured nuclear masses and those calculated using the Finite Range Droplet Model are analyzed. It is shown that they have a well defined, clearly correlated oscillatory component as a function of the proton and neutron numbers. At the same time, they exhibit in their power spectrum the presence of chaos. Comparison with other mass calculations strongly suggest that this chaotic component arises from many body effects not included in the mass formula, and that they do not impose limits in the precision of mass calculations.
pacs:
21.10.Dr, 05.40.-a, 24.60.Lz, 05.45.Tp1 Introduction
It has been recently proposed that there might be an inherent limit to the accuracy with which nuclear masses can be calculated Abe02 , due to the presence of chaotic motion inside the atomic nucleus Boh02 . This suggestion could have important consequences in the fields of nuclear physics and astrophysics, because the knowledge of nuclear masses is of fundamental importance for a complete understanding of the nuclear processes that power the Sun and for the synthesis and relative abundances of the elements Rol88 .
Though great progress has been made in the challenging task of measuring the mass of exotic nuclei, theoretical models are necessary to predict their mass in regions far from stability Lunn03 . The simplest one is that of the liquid drop model (LDM). It incorporates the essential macroscopic terms, which means that the nucleus is pictured as a very dense, charged liquid drop. The finite range droplet model (FRDM) Moll95 , which combines the macroscopic effects with microscopic shell and pairing corrections, has become the de facto standard for mass formulas. A microscopically inspired model has been introduced by Duflo and Zuker (DZ) Duf94 with good results. Finally, among the mean-field methods it is also worth mentioning the Skyrme-Hartree-Fock approach Gor01 .
Besides the “global” formulas of which the FDRM method has become the standard, there are a number of “local” mass formulas. These local methods are usually effective when we require the calculation of the mass of a nucleus, or a set of nuclei, which are fairly close to a number of other nuclei of known mass, exploiting the relative smoothness of the masses M(Z,N) as a function of proton (Z) and neutron (N) numbers to deduce systematic trends. Among these methods there are a set of algebraic relations for neighboring nuclei, known as the Garvey-Kelson (GK) relations Gar66 .
These relations do not have any free parameters and can be derived from an independent particle picture. They are based on a clever idea. The combinations are such that the number of neutron-neutron, neutron-proton and proton-proton interactions cancel. In addition to having the correct number of interactions, the single-particle energies and the residual interactions within each level, to a first approximation, cancel too Gar66 .
In order to understand the nature of the errors, in Fra03 a systematic study of nuclear masses was carried out using the shell model. This was achieved by employing realistic Hamiltonians with a small random component. In Hir04 ; Hir04b we have analyzed in detail the error distribution for the mass formulas of Möller et al.Moll95 and found a conspicuous long range regularity that manifests itself as a double peak in the distribution of mass differences Hir04 . This striking non-Gaussian distribution was found to be robust under a variety of criteria. By assuming a simple sinusoidal correlation, we could empirically substract these correlations and made the average deviation diminish by nearly Hir04b .
In the present contribution we analyze the mass deviations in the Finite Range Droplet Model (FRDM) of Möller et al. Moll95 , and in the microscopically motivated mass formula of DZ Duf94 , and those obtained using the Garvey-Kelson relations Hir04b . The presence of strong correlations between mass errors in neighboring nuclei is clearly exhibited, as well as the existence of a well defined chaotic signal in its power spectrum, when their correlations are analyzed as time series Hir04a ; Bar04 . It is also shown that the intrinsic average mass error is smaller that 100 keV.
2 Mapping the mass errors
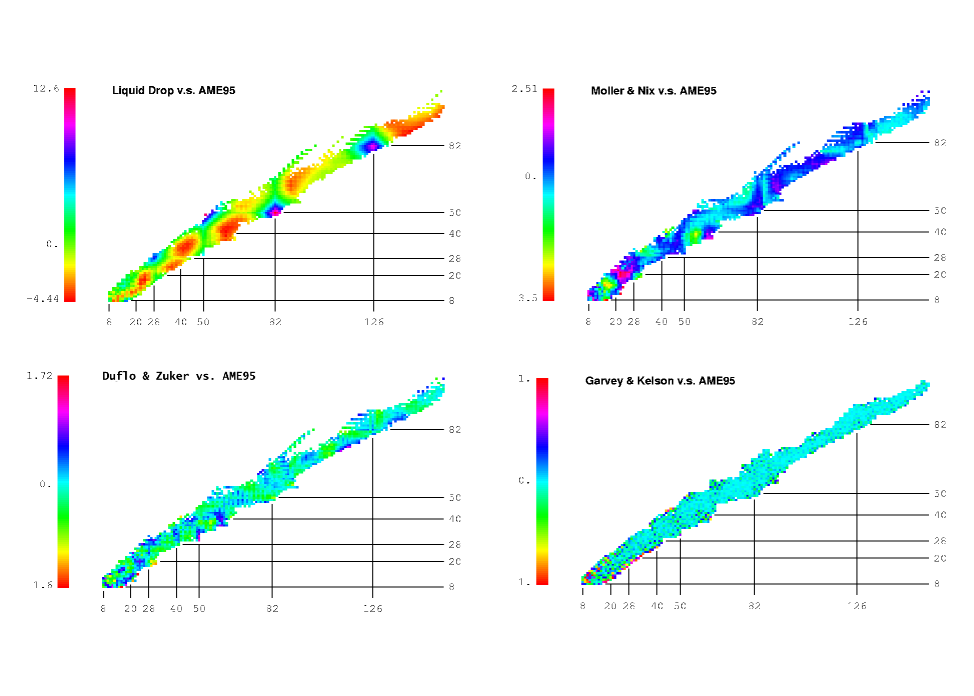
In Fig. 1 we show a gray tone (color-coded on line) depiction of the distribution of mass deviations in the Liquid Drop Model, in the FRDM, in the DZ calculations, and in GK calculations, in the proton number (N) - neutron number (Z) space. We can see large domains with a similar error (each tone is associated to the magnitude of the error). The shell closures are clearly seen in the LDM, It is remarkable that very well defined correlated areas of the same gray tone exist for the errors in the FRDM, and to a lesser extent in the DZ calculations, which are a clear indication of remaining systematics and correlation. In the GK calculations the errors are around 100 keV. Although the latter calculations do not allow reliable extrapolations, they exhibit the calculability of nuclear masses when enough local information (masses of neighbor nuclei or shell model realistic interactions) is available.
In order to measure and quantify the oscillatory patterns in the FRDM observed in Fig. 1, different cuts were performed along selected directions on the N-Z plane. Given the large number of chains which can be studied, we have selected those with the largest number of nuclei with measured mass. For each cut a Fourier analysis was performed, and the squared amplitudes are plotted as a function of the frequencies on the right hand side of each figure.
We start our analysis for fixed N or Z, i.e. we selected different chains of isotopes or isotones. Those isotopic chains with 20 or more nuclei with measured masses are presented in Fig. 2 and 3. Until 1995, the element which had most isotopes with measured masses was Cs (Z=55), with 34.
Fig. 2 displays the mass errors for the isotope chains Z = 46 to 56, and their Fourier analysis, nearly all exhibiting a prominent peak around the low frequency .
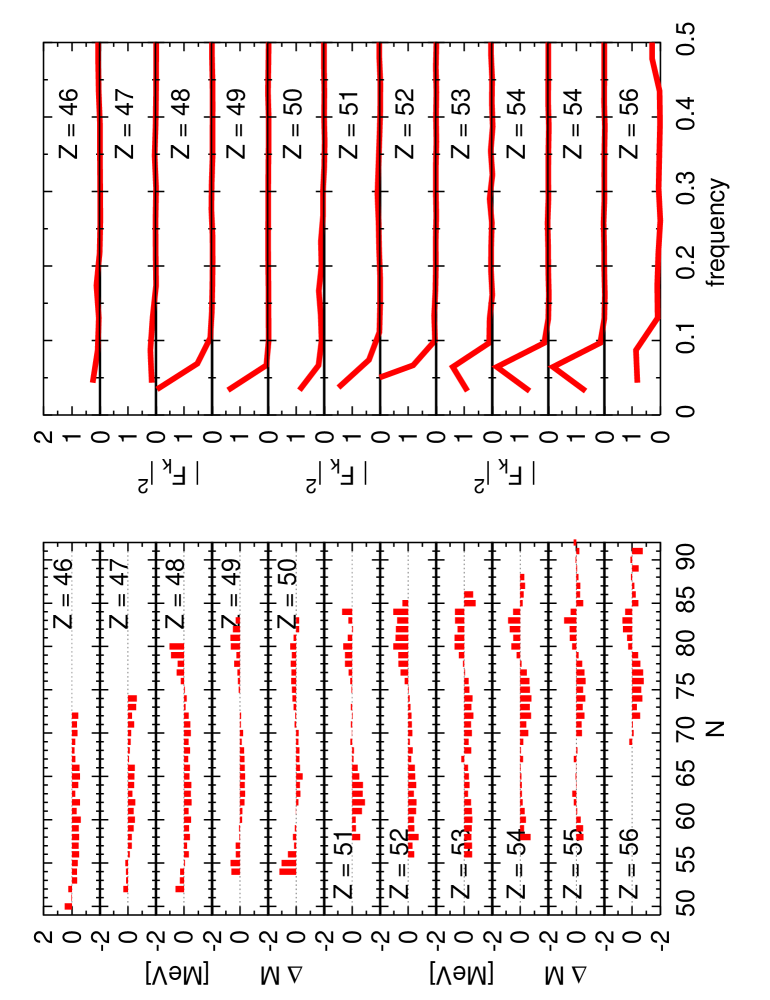
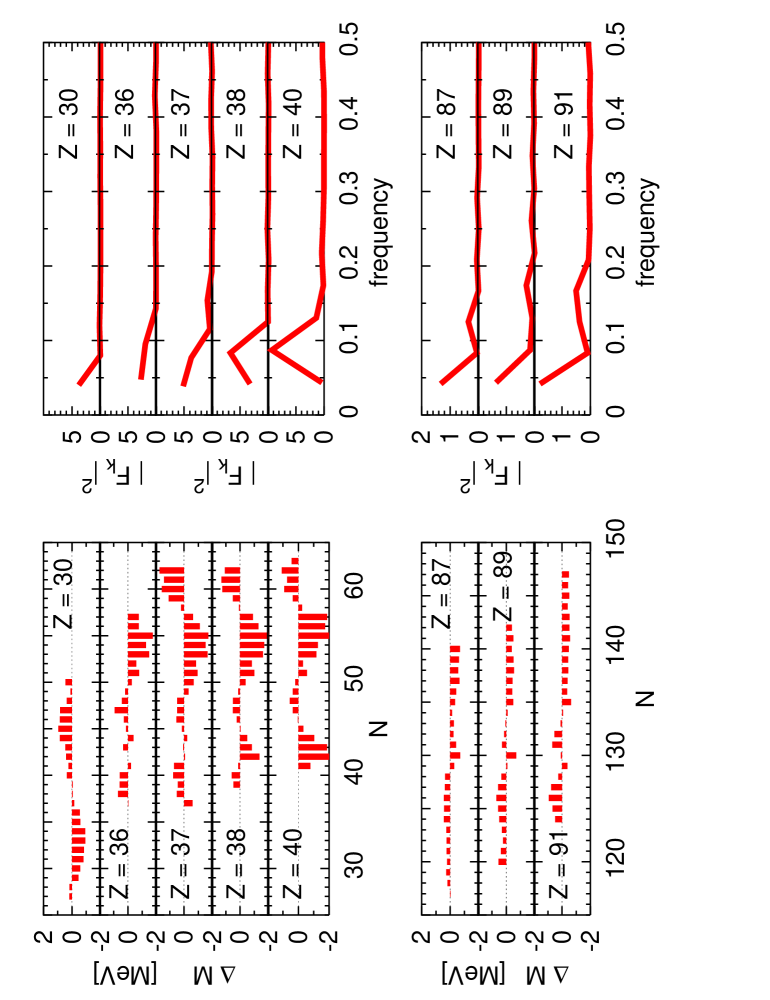
Fig. 3 displays the mass errors for the isotope chains Z = 30,36, 37, 38, 40, 87, 89, 91, and their Fourier analysis.
When the squared Fourier amplitudes are plotted as functions of the frequency using a log-log scale, the corresponding spectral distributions can then be fitted to a power law of the form . For the 18 chains listed, the fitted slopes are
| (1) |
They give values close to -1.2 in the FRDM data and around -0.7 for the deviations found by DZ. The former is consistent with a frequency dependence of characteristic of quantum chaos Rel02 , while the latter suggest a tendency towards a more random behavior characteristic of white noise.
3 The boustrophedon line
Plotting the mass differences for different Z, Fig. 4 top, and for different N, Fig. 4 bottom, is very common in mass calculations. Both plots exhibit some degree of structure. In this way we obtain a plot of mass differences as a function of Z, with all the isotopes plotted along the same vertical line, see Fig. 4. The difficulty in quantifying these regularities lies in the simple fact that the are many nuclei with a given N or Z. For this reason in Hir04 we have analyzed the data using different cuts.
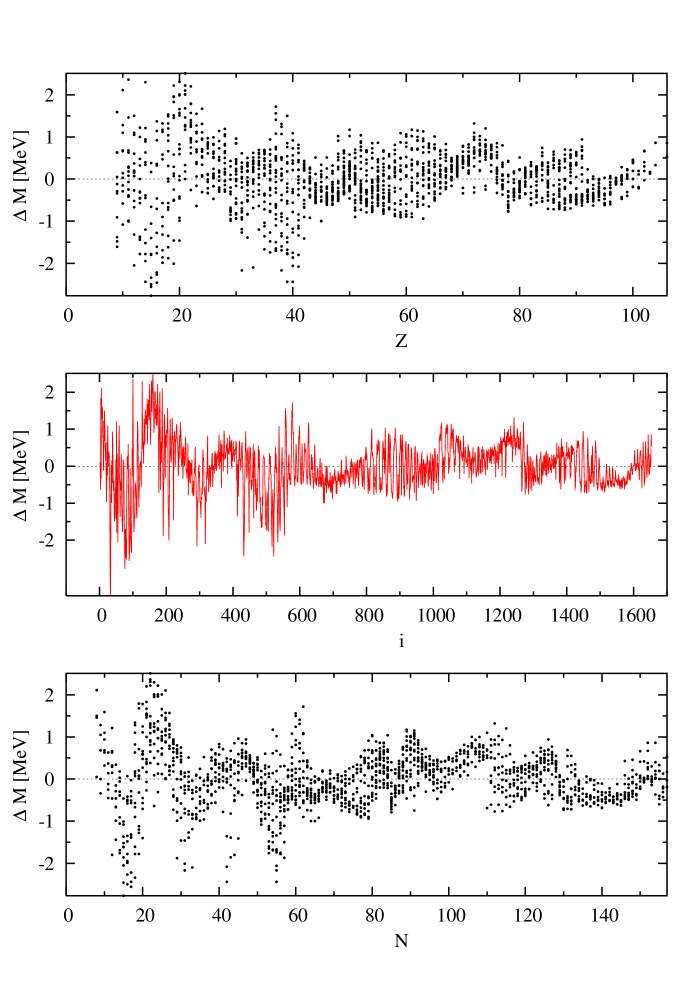
Another way to organize the FRDM mass errors for the 1654 nuclei with measured masses is to order them in a single list, numbered in increasing order. To avoid jumps, we have ordered the isotopes along a (boustrophedon) line Hir04b , which literally means ”in the way the ox ploughs”. Nuclei were ordered in increasing mass order. For a given even A, they were accommodated following the increase in N-Z, and those nuclei with odd A starting from the largest value of N-Z, and going on in decreasing order. The middle panel exhibits the same mass differences plotted against the order number, from 1 to 1654, providing an univalued function,
The presence of strong correlations in the Möller at al mass differences is apparent from the plot. Regions with large positive or negative errors are clearly seen. In contrast, the distribution of errors for the data of Duflo and Zuker (not shown, see Ref. Hir04a ) is closer to the horizontal axis, and the correlations are less pronounced, although not completely absent.
The ordering provides a single-valued function, whose Fourier transform can be calculated. The squared amplitudes are presented in Fig. 5.
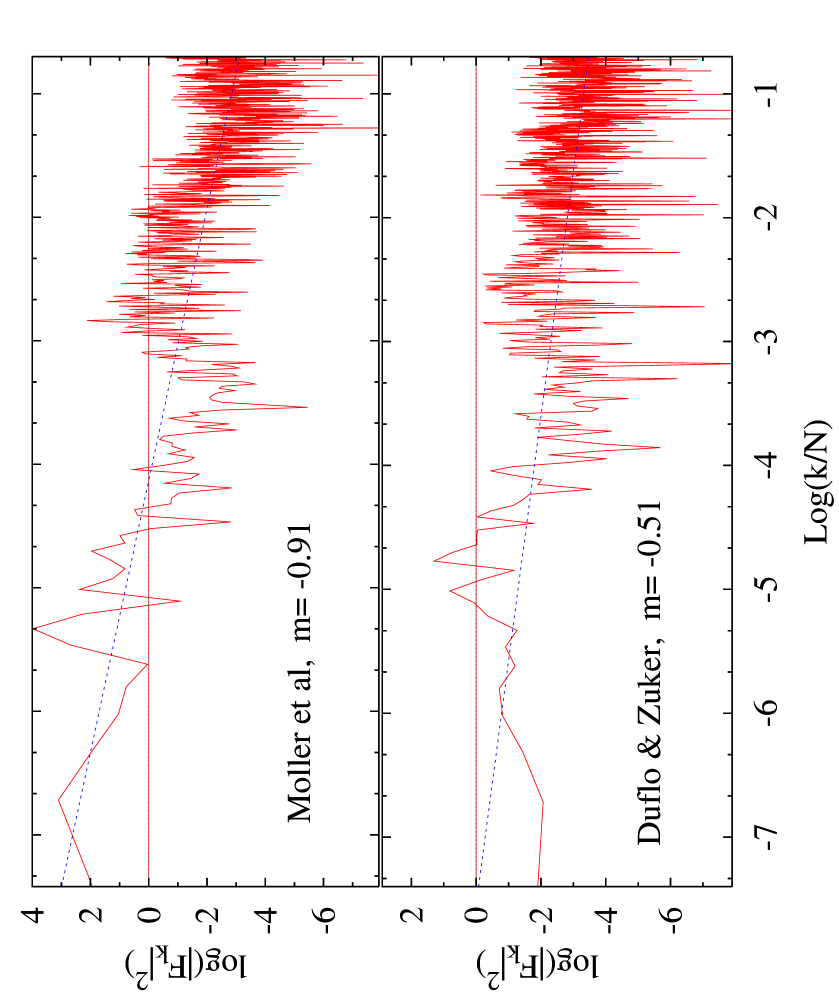
The slopes are
| (2) |
for the FRDM and DZ mass differences.
While this ordering is quite different from the chains along N and Z, the slopes are very similar.
To understand the possible origin of these spectral distributions, it is worth recalling that, while the FRDM calculations involve a liquid droplet model plus mean field corrections, including deformed single particle energies through the Strutinsky method and pairing Moll95 , the DZ calculations depend on the number of valence proton and neutron particles and holes, including quadratic terms motivated by the microscopic Hamiltonian Duf94 .
4 Local analysis of the differences between measured and calculated masses
We apply the GK procedure to all nuclei in the 2003 compilation Aud03 where at least one of the relations
is applicable.
These simple equations are based on the independent-particle shell model and, furthermore, constructed such that neutron-neutron, neutron-proton, and proton-proton interactions cancel. Both GK relations provide an estimate for the mass of a given nucleus in terms of five of its neighbors. This calculation can be done in six different forms, as we can choose any of the six terms in the formula to be evaluated from the others. Using both formulas, we can have a maximum of 12 estimates for the mass of a given nucleus, if the masses of all the required neighboring nuclei are known. Of course, there are cases where only 11 evaluations are possible, and so on. About half of all nuclei with measured masses Aud03 can be estimated in 12 different ways and, in all cases, our estimate corresponds to the average value. To our knowledge, the systematic application of GK relations in this extended fashion Bar04 is new.
Using the GK procedure we obtain a very specific prediction, determined by that of its neighbors. In this procedure there are no free parameters and there is no fit to the data, just a prediction of nuclear masses arising from those of its neighbors. In what follows we compare the mass deviations found in three of the global methods (LDM, FRDM, DZ) and our GK studies. The corresponding deviations, defined as
| (5) |
are displayed in Table 1,
| model | LDM | FRDM | DZ | GK | |
| 3447 | 669 | 346 | 189 | ||
| GK relations | 1-12 | 4-12 | 7-12 | 10-12 | 12 |
| A 16 | 189 | 162 | 117 | 95 | 86 |
| A 60 | 123 | 102 | 87 | 81 | 80 |
where we also include the smaller samples GK-n which involve the application of n or more GK relations, for which the average deviation is also quoted. Note the systematic decrease in the errors as a consequence of a better determination of the masses, proportional to the number of GK relations applied, for each of the four methods employed. In our best scenario, that of GK-12, we find an r.m.s. deviation of 80 keV, almost an order of magnitude smaller than the FDRM one.
5 Conclusions
In summary, a careful use of several global mass formulas and a systematic application of the Garvey-Kelson relations imply that there is no evidence that nuclear masses cannot be calculated with an average accuracy of better than 100 keV. While mass errors in mean-field calculations like the FRDM behave in a manner akin to quantum chaos, with a slope in the power spectrum close to , microscopic models’ results correspond to smaller slopes. Finally, for the local GK relations the remaining mass deviations behave very much like white noise. These results seem to confirm that the chaotic behavior in the fluctuations arises from neglected many-body effects.
In other words, the chaoticity discussed in Boh02 , according to the criteria put forward in Rel02 , seems indeed to be present in the deviations induced by calculations using the Möller et al. liquid droplet mass formula, while it tends to diminish in the microscopically motivated calculations of Duflo and Zucker. While for the liquid droplet model plus shell corrections a quantum chaotic behavior is found, errors in the microscopic mass formula have , closer to white noise. Given that both models attempt to describe the same set of experimental masses, our analysis suggests that quantum fluctuations in the mass differences arising from substraction of the regular behavior provided by the liquid droplet model plus shell corrections, may have their origin in an incomplete consideration of many body quantum correlations, which are partially included in the calculations of Duflo and Zuker.
References
- (1) S. Åberg, Nature 417, 499 (2002).
- (2) O. Bohigas, P. Leboeuf, Phys. Rev. Lett. 88, 92502 (2002).
- (3) C.E. Rolfs and W.S. Rodney, Cauldrons in the Cosmos, University of Chicago Press (1988).
- (4) D. Lunney, J.M. Pearson, and C. Thibault, Rev. Mod. Phys. 75, 1021 (2003).
- (5) P. Möller, J.R. Nix, W.D. Myers, W.J. Swiatecki, At. Data Nucl. Data Tables 59, 185 (1995).
- (6) J. Duflo, Nucl. Phys. A 576, 29 (1994); J. Duflo and A. P. Zuker, Phys. Rev. C 52, R23 (1995).
- (7) S. Goriely, F. Tondeur, and J.M. Pearson, Atom. Data Nucl. Data Tables 77, 311 (2001); M.V. Stoitsov, J. Dobaczewski, W. Nazarewicz, S. Pittel, and D.J. Dean, Phys. Rev. C 68, 054312 (2003).
- (8) G.T. Garvey and I. Kelson, Phys. Rev. Lett. 16, 197 (1966); G.T. Garvey, W.J. Gerace, R.L. Jaffe, I. Talmi, and I. Kelson, Rev. Mod. Phys. 41, S1 (1969).
- (9) Víctor Velázquez, Jorge G. Hirsch, and Alejandro Frank, Rev. Mex. Fís. 49 S. 4 (2003) 34.
- (10) J.G. Hirsch, A. Frank, and V. Velázquez, Phys. Rev. C 69, 37304 (2004).
- (11) J.G. Hirsch, V. Velázquez, and A. Frank, Rev. Mex. Fís. 50 Sup 2 (2004), 40.
- (12) J.G. Hirsch, V. Velázquez, and A. Frank, Phys. Lett. B 595, 231 (2004).
- (13) J. Barea, A. Frank, J.G. Hirsch,and P. van Isacker, Phys. Rev. Lett. in press; arXiv:nucl-th/0502038.
- (14) A. Relaño, J.M.G. Gómez, R.A. Molina, J. Retamosa and E. Faleiro, Phys. Rev. Lett. 89 (2002) 244102.
- (15) G. Audi, A.H. Wapstra, and C. Thibault, Nucl. Phys. A 729, 337 (2003).