Trajectory analysis for fusion path in superheavy-mass region
Abstract
We propose an effective method for the precise investigation of the fusion-fission mechanism in the superheavy-mass region, using the fluctuation-dissipation model. The trajectory calculation with friction is performed in the nuclear deformation space using the Langevin equation. In the reaction 48Ca+244Pu, the trajectories are classified into the fusion-fission process, the quasi-fission process and the deep quasi-fission process. By analyzing the time evolution of each trajectory, the mechanism of each process is clearly revealed, i.e., it is explained why a trajectory takes a characteristic path in this model. We discuss, in particular, the condition under which the fusion path is followed, which is crucial in the discussion of the possibility of synthesizing superheavy elements.
keywords:
superheavy elements, fluctuation-dissipation dynamics, fusion-fission process, quasi-fission process1 Introduction
Experiments on the synthesis of superheavy elements using heavy ion collisions have recently been successful in finding several new elements, and the known area in the nuclear chart is approaching the ’Island of Stability’ step by step ogan991 ; ogan01 ; ogan04 ; hofm00 ; mori03 ; mori04 .
In theoretical work, the dynamical aspects of the fusion-fission mechanism have been investigated as a time evolution of the nuclear shape with friction. In the 1980’s, for the heavy ion fusion reaction, the trajectory calculation in the nuclear deformation space using a stochastic equation was performed by Swiatecki et al swia81 ; bloc86 . They investigated the fusion process by using the mean trajectory and discussed a dynamical hindrance. As the degree of freedom of the nuclear shape, the center of mass distance, mass asymmetry and neck diameter were employed.
In the superheavy-mass region, however, even when substantial extra push energy is supplied, it is very difficult for the mean trajectory to reach the spherical region due to the strong Coulomb repulsion force and strong dissipation force. Only the fluctuation around the mean trajectory can reach the spherical region. Therefore, in order to estimate the fusion probability, we must introduce the dynamical model based on fluctuation-dissipation theory. We have developed the model to apply the dynamical process in the superheavy-mass region ari97 .
In the superheavy-mass region, due to the strong Coulomb repulsion force, the nuclear shape is easily deformed in the fusion-fission process. Therefore, it is extremely important to take into account the deformation of the fragments in the trajectory calculation ari04 . Consequently, as nuclear shape parameters, we employ the center of mass distance, deformation of fragments and mass asymmetry in the framework of two-center parameterization maru72 ; sato78 .
Moreover, although in their previous calculation Swiatecki et al. swia81 ; bloc86 used only the liquid drop model potential energy surface, in the superheavy-mass region, the shell correction energy plays a very important role armb99 ; moll97 . It influences not only the fission process but also the fusion process. In our model, the shell correction energy is taken into account in the dynamical calculation.
To estimate the fusion probability precisely, we analyzed the time evolution of the trajectory in the deformation space and investigated whether the trajectory enters the fusion box, which is a limited area in which the deformation space corresponds to spherical nuclei ari04 . In our previous work ari04 , we have compared our calculation with experimental data. In the reaction 48Ca+244Pu, we showed the calculations of the mass distribution of fission fragments agree with the experimental data. Also the experimental data of the cross section derived by counting mass symmetric fission events were reproduced by our model. By analyzing the trajectories, we classified them into the fusion-fission process (FF), the quasi-fission process (QF) and the deep quasi-fission process (DQF) in the reaction ari04 .
On the basis of the results of our previous studies, we investigate the essential factors for determining the trajectory’s behavior. The main purpose of the present work is to clarify the mechanism of whole fusion-fission dynamics by analyzing the time evolution of the trajectory for each process more precisely. As discussed in reference ari04 , the difference between the QF and DQF process is the mass asymmetry of the fission fragments. However, in the previous work, the origin of the mass asymmetry of the fission fragments in the both processes never have been discussed. It should be discussed what is a necessary condition for the trajectory to take the fusion path.
We aim to clarify the following points: (i) the mechanism that controls each path, (ii) the conditions governing the different paths, (iii) the conditions necessary to follow the fusion path. The last item is strongly related to attempts to synthesize new superheavy elements.
In section 2, we explain the framework of our study and the model used. We discuss the fusion mechanism in the reaction 48Ca+208Pb in section 3. In section 4, we analyze the trajectory in reaction 48Ca+244Pu precisely. We clarify the mechanism for each process. The origins of the FF, DQF and QF processes are discussed in section 5. We also analyze the processes in terms of the nuclear shape for each path in section 6. In section 7, the dependence of the trajectory on incident energy is investigated. We present a summary and further discussion in section 8.
2 Model
Using the same procedure as described in reference ari04 to investigate the fusion-fission process dynamically, we use the fluctuation-dissipation model and employ the Langevin equation. We adopt the three-dimensional nuclear deformation space given by two-center parameterization maru72 ; sato78 . The three collective parameters involved in the Langevin equation are as follows: (distance between two potential centers), (deformation of fragments) and (mass asymmetry of the colliding nuclei); , where and denote the mass numbers of the target and the projectile, respectively. In two-center shell model, it is difficult to express the realistic nuclear shape with the approximately . In sections 3 and 6 below, this difficulty is mentioned.
The parameter is defined as , where and denote the half length of the axes of ellipse in the and directions, respectively as expressed in Fig. 1 in reference maru72 . We assume that each fragment has the same deformations as the first approximation. The neck parameter is the ratio of the smoothed potential height to the original one where two harmonic oscillator potentials cross each other. It is defined in the same manner as reference maru72 . In the present calculation, is fixed to be 1.0, so as to retain the contact-like configuration more realistically for two-nucleus collision.
The multidimensional Langevin equation is given as
| (1) |
where a summation over repeated indices is assumed. denotes the deformation coordinate specified by , and . is the conjugate momentum of . is the potential energy, and and are the shape-dependent collective inertia parameter and dissipation tensor, respectively. A hydrodynamical inertia tensor is adopted in the Werner-Wheeler approximation for the velocity field, and the wall-and-window one-body dissipation is adopted for the dissipation tensor bloc78 ; nix84 ; feld87 . The normalized random force is assumed to be white noise, i.e., =0 and . The strength of random force is given by , where is the temperature of the compound nucleus calculated from the intrinsic energy of the composite system as , with denoting the level density parameter. The temperature-dependent potential energy is defined as
| (2) |
| (3) |
where is the moment of inertia of a rigid body at deformation , is the shell correction energy at , and is the potential energy of the finite-range liquid drop model. and denote a generalized surface energy krap79 and Coulomb energy, respectively. The centrifugal energy arising from the angular momentum of the rigid body is also considered. The temperature-dependent factor is parameterized as exp following the work of Ignatyuk et al. ign75 . The shell dumping energy is chosen to be 20 MeV. The intrinsic energy of the composite system is calculated for each trajectory as
| (4) |
where denotes the excitation energy of the compound nucleus, and is given by with and denoting the value of the reaction and the incident energy in the center-of-mass frame, respectively.
Also, we take into account the neutron emission in the Langevin calculation during the fusion-fission process, in the same manner as reference frob96 .
3 Fusion mechanism in the reaction 48Ca+208Pb
In our first attempt, we investigate the reaction 48Ca+208Pb, in which the FF process is dominant, as shown in reference ari04 . In this reference, we have already compared the calculation with the experimental data of the mass distribution of fission fragments and fusion-fission cross section, and the calculation shows a good agreement with the experimental data. We took into account the contribution of various angular momentum in reference ari04 . Here, in order to investigate the behavior of the trajectory in the dynamical process, we mainly discuss for zero angular momentum case.
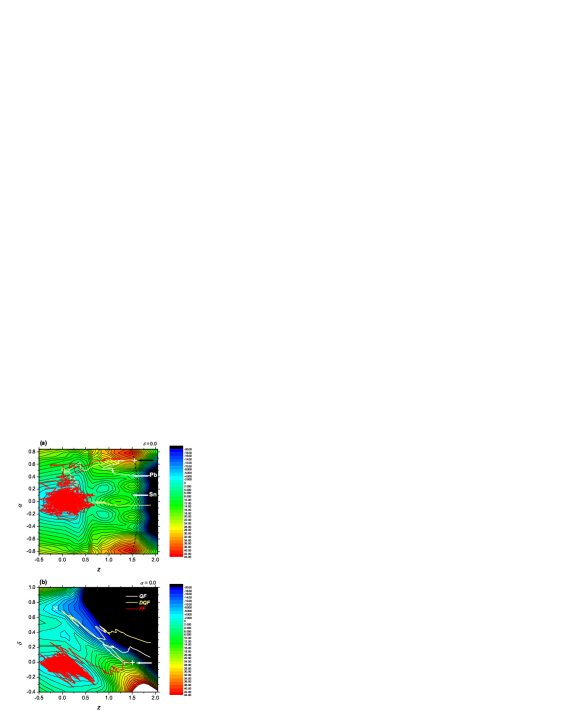
Figure 1 shows the potential energy surface of the liquid drop model with the shell correction energy for 256No on the ) plane, for the case of . This potential energy surface is calculated using the two-center shell model code suek74 ; iwam76 . The contour lines of the potential energy surface are drawn in steps of 2 MeV. Like the deformation parameters of nuclear shape described in reference ari04 , is defined as , where denotes the radius of the spherical compound nucleus. Parameter is defined as .
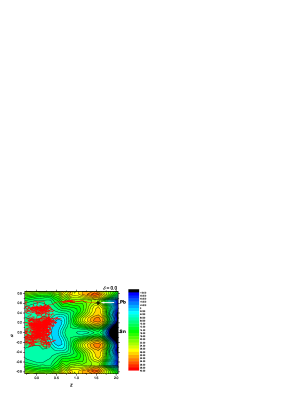
In Fig. 1, the position at corresponds to a spherical compound nucleus. The injection point of this system is indicated by the arrow. The (+) denotes the point of contact in the system. We start to calculate the three-dimensional Langevin equation at the point of contact located at . All trajectories start at this point with the momentum in the initial channel.
Due to the shell structure of the nucleus, we can see a valley in the potential energy surface near Pb and Sn fragments, as indicated in Fig. 1. The valley leads to the spherical region from the point of contact. Therefore, as shown in Fig. 1, most trajectories travel down along the valley and reach the spherical region. The red line in Fig. 1 denotes a sample trajectory of the fusion process at the incident energy corresponding to the excitation energy of the compound nucleus MeV, which is projected onto the () plane. The trajectories of the FF process make up 96.2 % of all trajectories.
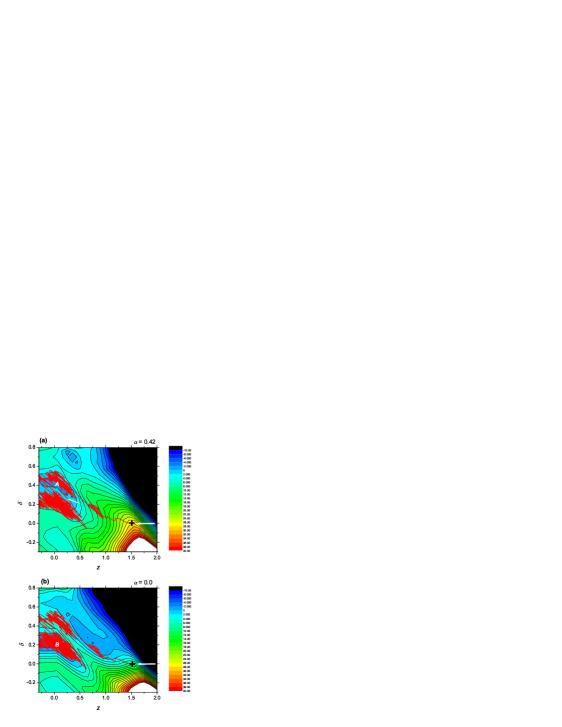
However, when we plot the trajectory on the plane, the process seems not so simple. Figure 2 shows the potential energy surface on the plane. We can see the steep descending slope in the direction near the point of contact in the system. The same trajectory shown in Fig. 1 is plotted on the different two planes. The trajectory flows down along the slope in the direction.
Figures 2(a) and (b) show the potential energy surface on the plane at and , respectively. In Fig. 2(a), this trajectory is trapped in the pocket located at (indicated by ). This pocket is produced by the shell effect of the deformed nucleus. Here, we call this pocket the subpocket. Then, the trajectory moves to another pocket located near the spherical region (indicated by ) in Fig. 2(b), and is trapped there. We call this pocket the main pocket. It is very interesting that, in this reaction, the fusion process proceeds in two steps, that is, the trajectory is trapped in the subpocket first and then moves to the main pocket associated with the process of relaxation of mass asymmetry. In Fig. 2(a), the yellow arrow denotes the transition process from the subpocket with the deformed shape to the main pocket of the spherical shape.
As discussed in reference ari04 , the trajectory is prevented from going to the fusion area by the steep slope in the direction. However, in this case, there is a pocket in the large area, as shown in Fig. 2(a). Trajectories flowing to the direction are trapped in the subpocket for a moment and are blocked from going to the fission area. We prepare 1,000 trajectories in this calculation, and find that all trajectories of the FF process are this type of trajectory.
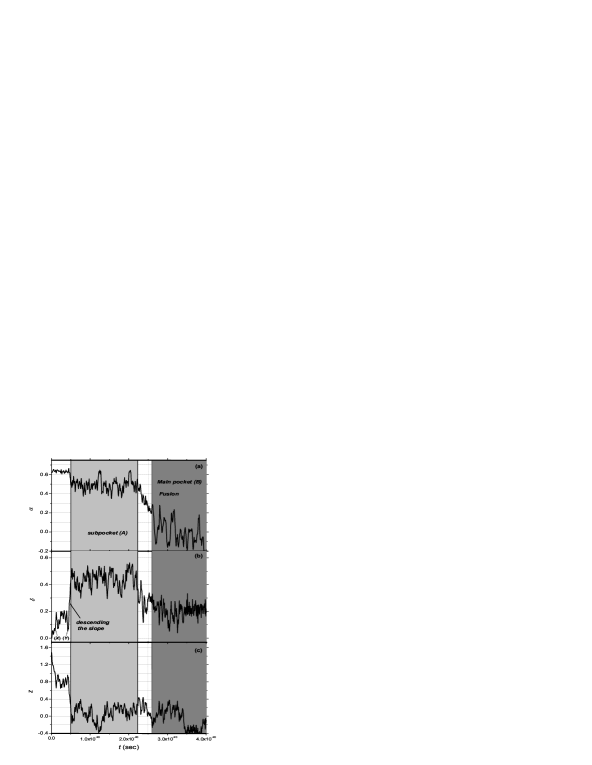
As mentioned above, we assume that kinetic energy does not dissipate during the approaching process. At the point of contact, we start the Langevin calculation. Due to the strong friction, all kinetic energy dissipates in a very short time scale, that is, by sec. The time evolutions of parameters and for the sample trajectory in Fig. 1 are shown in Figs. 3(a), (b) and (c), respectively. The periods when the trajectory is trapped in the subpocket and the main pocket are presented by the light gray and gray areas, respectively. It is clearly shown that the fusion trajectory is trapped by the subpocket (staying for a time interval of sec) and then moves to the main pocket. In Fig. 3(c), until all the kinetic energy dissipates, parameter moves with very high speed in the direction, because it has initial momentum in this direction. After it reaches , the trajectory begins to descend along the steep slope in the direction (indicated by in Fig. 3(b)). After sec, it quickly descends the slope at very high speed (indicated by in Fig. 3(b)). At sec, the trajectory reaches the subpocket and is trapped. During the stay in the pocket, the mass-asymmetry parameter fluctuates around , and it is relaxed quickly when the trajectory begins to move to the main pocket. At the same time, the value of decreases, and due to the relaxation of , the main pocket becomes larger and deeper. Therefore, the trajectory is trapped in it for a long time. At sec, it enters the main pocket, which is regarded as the accomplishment of fusion.
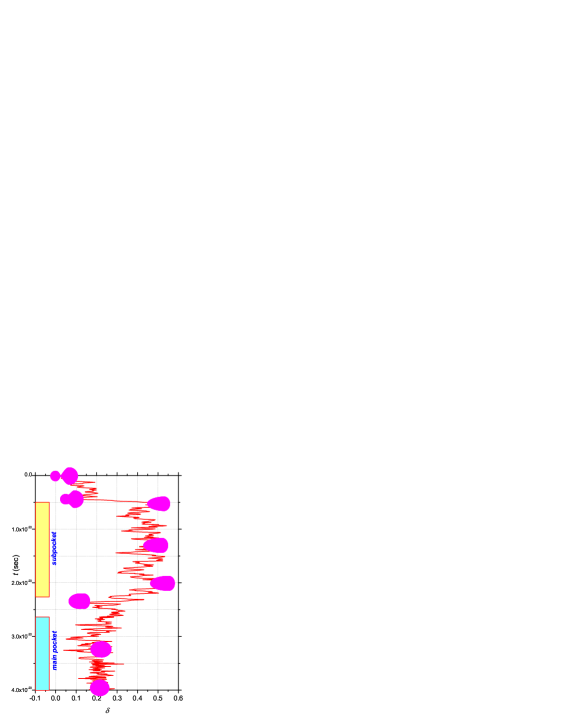
Figure 4 shows the time evolution of parameter and the nuclear shape at each specific point for the sample trajectory shown in Fig. 1. These shapes are presented using the two-center shell model parameterization. As mentioned in the previous section, due to the difficulty with the parametrization with the approximately , the nuclear shape is not exactly spherical-spherical at the point of the contact ().
At sec, by increasing the value of and decreasing quickly, the neck of the nuclear shape disappears. We can see that the shape is stabilized by the shell structure of the deformed nucleus in this case. Then, at , the trajectory moves to the main pocket, which fusion time corresponds to that calculated by Blocki et. al. bloc86 . The shape in the pocket is more compact, and this nucleus is considered to be a compound nucleus. Thus, in this reaction, the parameter plays a very important role in the fusion reaction.
In this analysis, we reveal the fusion mechanism in this reaction. Such a mechanism cannot be revealed by analyzing only the process on the plane.
4 Behavior of each path in the reaction 48Ca+244Pu
In our previous work ari04 , we have presented that the good agreements of the calculation with the experimental cross section derived by the mass symmetric fission events in the reaction 48Ca+244Pu. Also we classified the dynamical process on the basis of the features of the trajectory corresponding to the characteristic physical phenomena. They are the QF, DQF and FF processes. Within the model, here we analyze these different trajectories more precisely and reveal the mechanism by which the trajectory chooses its characteristic path. We investigate the time evolution for each trajectory and try to find the condition under which the trajectory takes the fusion path. In particular, the required conditions for inducing the fusion path are one of the important factors in the synthesis of superheavy elements. In order to discuss the dynamical process, we mainly focus on zero angular momentum case. The main mechanism of fusion-fission process can be explained by the trajectory’s behavior on the potential landscape. For each angular momentum, the potential landscape changes but the mechanism of the process essentially does not change.
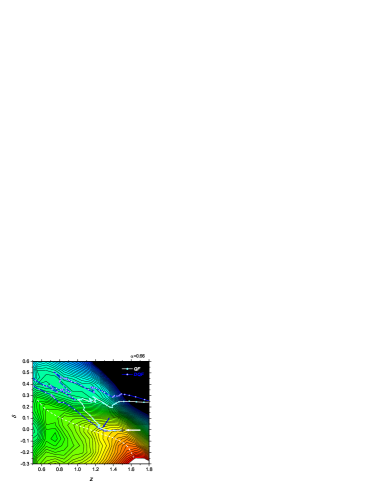
Figure 5 shows the potential energy surface of the liquid drop model with shell correction energy for on the plane (a) and the plane (b) in the case of . The white, yellow and red lines denote sample trajectories of the QF, DQF and FF processes, respectively, in the reaction 48Ca+244Pu at the incident energy corresponding to the excitation energy of the compound nucleus MeV. These trajectories are projected onto the () plane and () plane, as shown in Fig. 5(a) and (b), respectively.
In this case, most of the trajectories enter into the fission area by passing along the QF path, thus, the QF process is dominant. One of the fission fragments is distributed around Pb, which is marked in Fig. 5(a) with the white arrow. In this calculation, we assume that the shapes of both the target and the projectile are spherical at the point of contact of the colliding system, even though 244Pu is a deformed nucleus. We define the fusion box as the inside of the fission saddle point on each axis, ari04 . The injection point of this system is indicated by the black arrow in Fig. 5(a) and the white arrow in Fig. 5(b). We start to calculate the three-dimensional Langevin equation at the point of contact marked by (+), which is located at .
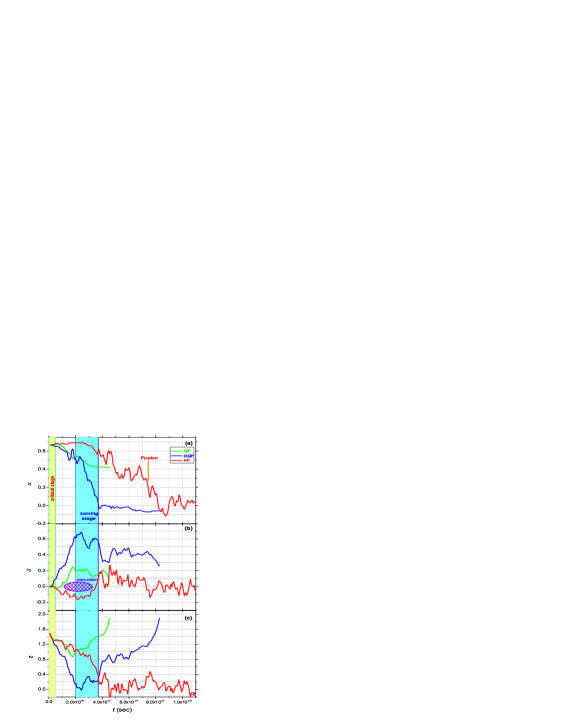
Figure 6 shows the time dependence of each deformation parameter for the sample trajectories shown in Fig. 5. The time evolutions of parameters and are shown in (a),(b) and (c), respectively. In each figure, the green, blue and red lines denote the QF, DQF and FF processes, respectively.
By analyzing the time evolution of each parameter and the relationships among them, we can see the characteristic behavior of each path. As explained in the following subsection, we found that the most important stage in determining the process is the stage from the point of contact to just before the ridge line on the plane indicated by the white broken line in Fig. 5(b). Here, we call this stage the critical stage. First, we discuss the feature of each path by analyzing the trajectories in Fig. 5, and then we discuss this critical stage in the next section.
4.1 Fusion-fission path
As discussed in the previous section, we assume that the kinetic energy does not dissipate during the approaching process. The initial velocity is directed in only the direction, and the two components of the initial velocities along the and directions are assumed to be zero. Hence, first, all trajectories move in the direction and overcome the ridge near on the plane, as shown in Fig. 5(a).
After overcoming the ridge, at sec, the trajectories approach to the ridge on the plane denoted by the white broken line in Fig. 5(b). The momentum of this trajectory is decreased already due to strong friction. Then, by random force perpendicular to the ridge line, the trajectory overcomes the ridge. Overcoming the ridge is the key to whether the trajectory follows the fusion process.
Once the trajectory overcomes the ridge on the plane, it descends along the valley to the spherical area. This valley is located in the region, so that the trajectory is blocked by a mountain from going to the direction which leads to the fission area, as shown in Fig. 6(b).
The trajectory goes along the valley until sec, and reaches which is the border of the fusion box on the coordinate. During this process, the mass-asymmetry parameter does not change very much, as shown in Figs. 6(a). Parameter also does not change very much during this time, because the trajectory descends along the valley which is located in the region.
After the trajectory enters the area, the mass asymmetry begins to relax and the trajectory enters the fusion box at sec, indicated by the arrow in Fig. 6(a). Here, the important point is that the mass asymmetry relaxes after becomes sufficiently small. The trajectory is trapped in the pocket near the spherical region.
4.2 Deep quasi-fission path
The trajectory of the DQF process, after starting at the point of contact, also first overcomes the ridge on the plane. Immediately afterwards, the trajectory begins to avoids the ridge on the plane. In this case, the momentum in the direction of the trajectory is not lost so much and the trajectory slips through the lower foot of the ridge on the plane at a high speed and descends the steep slope in the direction. Due to the momentum being in the direction, parameter also decreases quickly. This high-speed process proceeds until sec, as shown in Figs. 6(b) and (c). The value of becomes almost zero during this time and the deformation of fragments occurs up to .
Finally the trajectory reaches the area where the potential energy surface becomes gentle, as indicated by in Fig. 5(b). In this area, the trajectory speed in the and directions decreases and becomes almost zero on the plane. The movement of the trajectory undergoes a change to the direction. During the time taken for this turning process, the mass asymmetry is drastically relaxed, as shown in Fig. 6(a). The time taken for this process is sec. We call this period the turning stage which is shown in Fig. 6. On the other hand, neither parameter nor changes very much during this time. We can say that the turning point of the DQF path exists at .
After the trajectory completes its change of direction to , it travels down along the steep slope in the direction. In this fission process, the trajectory goes out of the fission area with a large value of .
4.3 Quasi-fission path
The trajectory of the QF path is the same as that of the FF path, up to sec. That is to say, the trajectory travels in the direction with substantial momentum and overcomes the ridge on the plane. Then, the trajectory reaches the point near the ridge on the plane, which is the same point as that in the FF path. Due to the strong friction, the momentum of this trajectory is lost during this process. As shown in Fig. 6(c), the trajectory almost stops at this moment. The decrease of saturates.
Subsequently, random force controls the future behavior of the trajectory. Different from the FF case, the trajectory is proceeded by random forces whose direction has a low angle with respect to the ridge line or are orienting to the opposite side of the ridge. It does not overcome the ridge line, and falters and descends quickly along the steep slope in the direction. During this short process, there is not sufficient time for the relaxation of the mass-asymmetry parameter . During the fission process, does not change greatly and retains the value of .
5 Key factor in each process
In this section, we discuss the mechanism of the path separation. We investigate the origin of the QF, DQF and FF paths. By analyzing the trajectories in the previous sections, all processes are found to easily overcome the ridge on the plane, which we call the first ridge. We found that the most important stage (critical stage) in deciding the branch of the path is the process from the point of contact to the next ridge on the plane, which we call the second ridge. This critical stage is shown in Fig. 6.

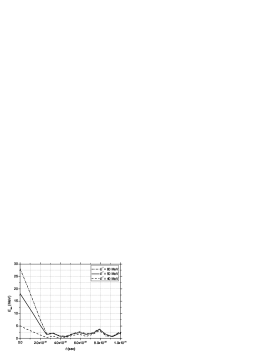
Figure 7 shows the samples of the time evolution of the kinetic energy of the relative motion for a trajectory in this reaction. The solid line denotes the case of MeV. The kinetic energy dissipates at sec. Up to this time, the trajectory advances in the direction and overcomes the first ridge on the plane at a location very near the point of contact.
After overcoming this barrier, the next process is very important in deciding the bifurcation. The trajectories of the FF and QF paths advance toward the point near the second ridge line on the plane. Figure 8 shows each trajectory near the point of contact. These trajectories are plotted on the plane . The QF, DQF and FF processes are denoted by the white, blue and red lines, respectively. The open circles on each trajectory denote the time step. The interval of two circles mark corresponds to the time step of sec. The white dashed line denotes the second ridge line. In Fig. 8, the positions at which all the kinetic energy dissipates are marked by the blue arrows.
The trajectories of the FF and QF paths lose all the kinetic energy near the second ridge on the plane. At these points, random force determines whether the trajectory overcomes the the second ridge. By random force, if trajectory overcomes the second ridge, it is the FF process. The trajectory of the DQF path begins to avoid the lower foot of the second ridge on the plane just after overcoming the first ridge with momentum in the direction.
The process is mainly decided in the critical stage. Therefore, it is worth to remark that the effective fusion barrier is considered to be the second ridge on the plane and not the first ridge near the point of contact. Even if the trajectory overcomes the first ridge, it does not mean that it enters the fusion area. We can say that if the trajectory overcomes the second ridge line, it will enter the fusion region. This is the necessary condition for the trajectory to enter the fusion area in the superheavy-mass region.
Actually, in the three-dimensional coordinate space, the process of the trajectory has already been decided near the point of contact. In the early stages, the trajectory is separated into the FF, DQF and QF processes. The first ridge line is related to the deep inelastic collision (DIC) process. When the trajectory cannot overcome the first ridge line, it is recognized as a DIC process.
6 Time evolution of the nuclear shape in each process
In this section, we investigate the different paths from the viewpoint of nuclear shape. We compare the time evolutions of the nuclear shapes in different paths, keeping in mind the discussion in the previous section.
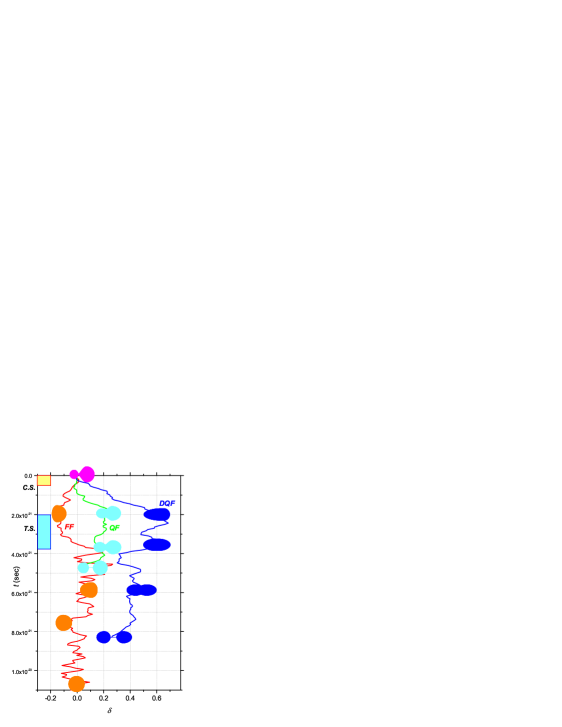
Figure 9 shows the time evolution of parameter of each path with the nuclear shapes at several deformation points for the same trajectories in Fig. 5. As mentioned above, because of the difficulty with the parametrization with the approximately , the nuclear shape is not realistic near the point of the contact (). However, in the sets of our parameters, the potential energy at the point of the contact is consistent with that calculated by the Bass model bass741 . The red, blue and green lines denote the FF, DQF and QF processes, respectively. The blocked areas indicated by and are the critical stage and the turning stage, respectively, corresponding to those in Fig. 6. After passing the critical stage, each process takes a different value of . Only the trajectory of the FF process takes a negative value of , and it is very important for the fusion process to maintain the oblate fragment deformation until the relaxation of , as mentioned in the previous section. In the FF process, up to sec, parameter approaches , so that the shape at this point is very compact even if the mass asymmetry is large. This is one of the restrictions of the two-center shell model parameterization. Subsequently, in the FF process, the nuclear shape fluctuates around a sphere due to the thermal fluctuation.
In the QF process, at sec, parameter is about , as shown in Fig. 6, and this value is similar that in the FF process. Since the value of the parameter , the nuclear shape has a neck, as shown at this point in Fig. 9. This neck is considered to contribute to faster fission compared with the DQF process, which does not have a neck at this time. Therefore, the trajectory progresses to fission keeping its mass asymmetry.
Regarding the DQF process, at sec, due to the large value of and the small value of , the neck disappears and the nuclear shape resembles a mononucleus. From this shape, it appears to be easy to change to the mass-symmetric shape. During the turning stage, the mass asymmetry of this nucleus is relaxed completely. The time interval of this process is about sec. Due to large deformation, even if the mass asymmetry is relaxed, the trajectory cannot reach the fusion area. In this case, the mass-symmetric fission occurs without forming a compound nucleus.
7 Dependence of incident energy
In this section, we discuss how the contribution from each process changes depending on the incident energy in the reaction 48Ca+244Pu.
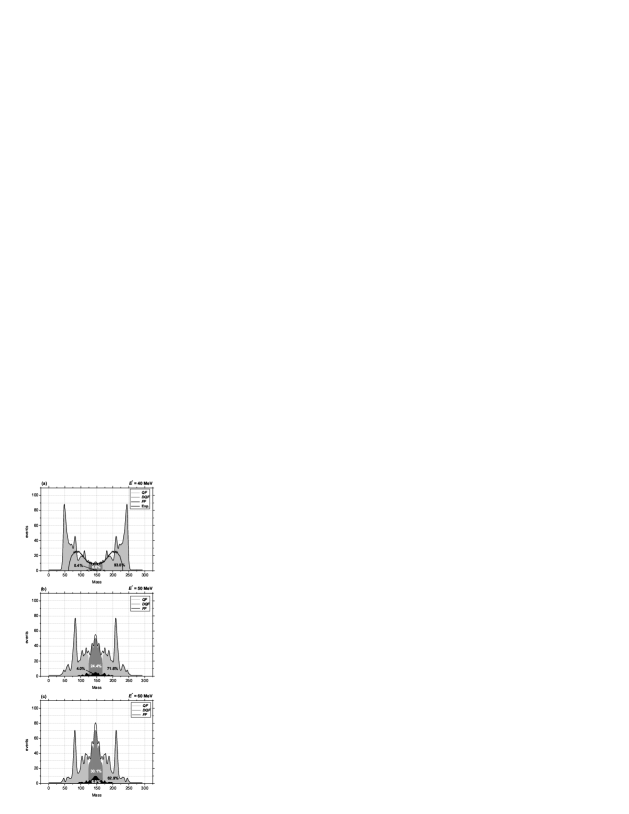
Figure 10 shows the mass distributions of fission fragments which are distinctive for each process. The fission fragments from the QF, DQF and FF processes are presented by the light gray, gray and black shadings, respectively. In our calculation, the events of QF in Fig. 10 include some events of the DIC process. The thin black line denotes the total process. Figures denote the probability of each process, which are given in %. Three panels (a),(b) and (c) show the distribution of fission fragments for the incident energy corresponding to the excitation energy of the compound nucleus and 60 MeV, respectively.
At MeV, the mass-asymmetric fission events are dominant. The experimental data of the mass distribution of fission events for the QF process is denoted by the thick black line in Fig. 10(a) mate02 . In the calculation, the peaks located at and 244 correspond to a reaction similar to the DIC process. That is to say, due to the low incident energy, the colliding system reseparates like a projectile and a target. The trajectory cannot overcome the first ridge on the plane, and goes back to the direction while maintaining the initial mass asymmetry .
With increasing incident energy, the trajectory overcomes the first ridge on the plane and the events of the DIC process decrease. Mass-symmetric fission events become dominant. In Figs. 10(b) and (c), the peaks at grow. These peaks originate from the QF process which goes down the valley leading to the Pb like fragment, after overcoming the first ridge on the plane. The QF process, which progresses to mass-asymmetric fission events, decreases as a whole whereas the FF process increases when incident energy increases.

Next, we discuss further the critical stage. Figure 7 shows the samples of the time evolutions of the kinetic energy of the relative motion in the reaction 48Ca+244Pu at and 60 MeV, which are denoted by the dashed, solid and dashed-dotted lines, respectively. We can see that the kinetic energy in the incident channel dissipates within sec independent of the incident energy. We denote this dissipation time as . After this time, the trajectory is controlled by random force and the landscape of the potential energy surface.
Figures 11 and 12 show the trajectory near the point of contact in the reaction 48Ca+244Pu at and 60 MeV, respectively. The QF and DQF processes are denoted by the white and blue lines, respectively. The white arrow indicates the injection direction and the point of contact is marked by +. By investigating the trajectory of the FF process at and 60 MeV, we found that the trajectory of the FF process follows almost the same path as that for MeV. In contrast, the trajectories of the DQF and QF processes show the characteristic behaviors at each incident energy. In Figs. 11 and 12, the interval between adjacent circles on the trajectory corresponds to sec, in the same manner as in Fig. 8.
At MeV, because of the low incident energy, the initial trajectory speed is low. Until , the trajectory leaves only from near the point of contact. The position at is denoted by the blue arrows in Fig. 11. As a result, the trajectory travels down the steep slope in the direction. Due to random force applied during the decent down the slope, the trajectory is separated into the DQF and QF processes.
In the case of MeV, because of the high incident energy, the initial trajectory speed is high, and all trajectories advance toward the second ridge in the direction. As shown in Fig. 12, the trajectory approaches to the second ridge at , as denoted by the blue arrows. After this point, the trajectory is controlled by random force and the landscape of the potential energy surface. The trajectory that cannot overcome the second ridge descends the steep slope in the direction. It also is separated into the DQF and QF processes by random force during the descent down the slope.
We have discussed the mechanism of the dynamical process in the case of zero angular momentum. When the system has an angular momentum, the potential landscape changes. That means the relation between the ridge line and the point at changes. As discussed above, the behavior of the trajectory mainly is controlled by this relation and random force. This main mechanism can be applied to the any angular momentum cases.
8 Summary
The fusion-fission process in the superheavy-mass region was studied on the basis of fluctuation-dissipation dynamics. The trajectory calculation with friction has been performed.
In our previous work ari04 , we have compared our calculation with experimental data of the mass distribution of fission fragments and the cross section derived by counting mass symmetric fission events. On the basis of our previous studies, we investigated why the trajectory chooses a different path corresponding to the different process. By analyzing the time evolution of the trajectory, we clarify the mechanism of whole fusion-fission dynamics. To find the condition to follow the fusion path, it is strongly related to attempts to synthesize new superheavy elements.
In the reaction 48Ca+208Pb at MeV, the fusion-fission process is dominant. The mechanism of this FF process was clarified. The trajectory of the FF process is trapped in the subpocket located at the intermediate deformed system, and then moves to the main pocket located at the spherical nucleus. It is found that trapping in the subpocket prevents the trajectory from going to the fission region. We also investigated the time evolution of the nuclear shape. We found that mass asymmetry is rapidly relaxed when the trajectory moves quickly from the subpocket to the main pocket.
In the reaction 48Ca+244Pu, the dynamical process is classified into the FF, DQF and QF processes. We investigated the origin of each path by analyzing the time evolution of each parameter. Under the assumption that the kinetic energy does not dissipate during the approaching process, the time up to sec, which is called the critical stage, is very important for separating each path. It roughly corresponds to the time at which all the kinetic energy dissipates. During this critical stage, the point reached by the trajectory governs the process after this stage. Then, the behavior of the trajectory is controlled by random force and the landscape of the potential energy surface. The trajectory of the FF process overcomes the second ridge line on the plane, when the random force applied in the direction of and almost perpendicular to the ridge. This is the key point for the FF process. The difference between the origins of the DQF and QF processes was also discussed.
The time evolution of the nuclear shape for each process was discussed. The critical point of the difference between the QDF and QF processes is the neck shape of the nucleus at the end of the critical stage. While the nuclear shape in the QF process has a neck at this time, the shape in the DQF process does not, because of the large value of and the small value of . In the latter case, it is easy to form a mononucleus and thereby easy to relax the mass-asymmetric parameter. Consequently, we can see the mass-symmetric fission events in the DQF process.
From the investigation of the incident energy dependence of the dynamical process, we can say that the position of the trajectory at depends on the incident energy and the position decides the way of future dynamical path separation.
We believe that this study yields an effective method of investigating the whole fusion-fission process in the superheavy-mass region. For the synthesis of superheavy elements, it is very important to know the mechanism of the fusion process precisely.
The authors are grateful to Professor Yu. Ts. Oganessian, Professor M.G. Itkis, Professor V.I. Zagrebaev and Professor F. Hanappe for their helpful suggestions and valuable discussion throughout the present work. The authors thank Dr. S. Yamaji and his collaborators, who developed the calculation code for potential energy with two-center parameterization. This work has been in part supported by INTAS projects 03-01-6417.
References
- (1) Yu.Ts. Oganessian et al., Nature 400 (1999) 242 ; Yu.Ts. Oganessian et al., Phys. Rev. Lett. 83 (1999) 3154.
- (2) Yu.Ts. Oganessian et al., Phys. Rev. C 63 (2001) 011301(R).
- (3) Yu.Ts. Oganessian et al., Phys. Rev. C 69 (2004) 021601(R).
- (4) S. Hofmann and G. Munzenberg, Rev. Mod. Phys. 72 (2000) 733; S. Hofmann et al., Eur. Phys. J. A 14 (2002) 147.
- (5) K. Morita et al., Nucl Phys, A 734 (2004) 101.
- (6) K. Morita et al., Journal of the Physical Society of Japan , 73 (2004) 2593.
- (7) W.J. Swiatecki, Physica Scripa, 24 (1981) 113.
- (8) J.P. Blocki, H. Feldmeier and W.J. Swiatecki, Nucl. Phys. A459 (1986) 145.
- (9) Y. Aritomo, T. Wada, M. Ohta and Y. Abe, Phys. Rev. C 55 (1997) R1011; Y. Aritomo, T. Wada, M. Ohta and Y. Abe, Phys. Rev. C 59 (1999) 796.
- (10) Y. Aritomo and M. Ohta, Nucl. Phys, A744 (2004) 3.
- (11) J. Maruhn and W. Greiner, Z. Phys. 251 (1972) 431.
- (12) K. Sato, A. Iwamoto, K. Harada, S. Yamaji, and S. Yoshida, Z. Phys. A 288 (1978) 383.
- (13) P. Armbruster, Rep. Prog. Phys., 62 (1999) 465.
- (14) P. Moller, J.R. Nix, P. Armbruster, S. Hofmann, G. Munzenberg, Z. Phys. A356 (1997) 251.
- (15) J. Blocki, Y. Boneh, J.R. Nix, J. Randrup, M. Robel, A.J. Sierk and W.J. Swiatecki, Ann. Phys. 113 (1978) 330.
- (16) J.R. Nix and A.J. Sierk, Nucl. Phys. A 428 (1984) 161c.
- (17) H. Feldmeier, Rep. Prog. Phys. 50 (1987) 915.
- (18) H.J. Krappe, J.R. Nix, and A.J. Sierk, Phys. Rev. C20 (1979) 992.
- (19) A.V. Ignatyuk, G.N. Smirenkin, and A.S. Tishin, Sov. J. Nucl. Phys. 21 (1975) 255.
- (20) P. Fröbrich and R. Lippenheide, Theory of Nucler Reactions, Clarendon Press, Oxfors, 1996, p. 447.
- (21) S. Suekane, A. Iwamoto, S. Yamaji and K. Harada, JAERI-memo, (1974) 5918.
- (22) A. Iwamoto, S. Yamaji, S. Suekane and K. Harada, Prog. Theor. Phys. 55 (1976) 115. 18
- (23) R. Bass, Nucl. Phys. A231 (1974) 45.
- (24) T. Materna, Ph. D. Thesis, Universite Libre de Bruxelles, 2002-2003.