Nonequilibrium Models of Relativistic Heavy-Ion Collisions
Abstract
We review the results from the various hydrodynamical and transport models on the collective flow observables from AGS to RHIC energies. A critical discussion of the present status of the CERN experiments on hadron collective flow is given. We emphasize the importance of the flow excitation function from 1 to 50 AGeV: here the hydrodynamic model has predicted the collapse of the -flow and of the -flow at AGeV; at 40 AGeV it has been recently observed by the NA49 collaboration. Since hadronic rescattering models predict much larger flow than observed at this energy we interpret this observation as evidence for a first order phase transition at high baryon density . Moreover, the connection of the elliptic flow to jet suppression is examined. It is proven experimentally that the collective flow is not faked by minijet fragmentation. Additionally, detailed transport studies show that the away-side jet suppression can only partially ( 50%) be due to hadronic rescattering. Furthermore, the change in sign of closer to beam rapidity is related to the occurence of a high density first order phase transition in the RHIC data at 62.5, 130 and 200 AGeV.
pacs:
25.75.-q, 25.75.Ld1 Introduction: Old and new observables for the QGP phase transition
Lattice QCD results [1, 2] show a crossing, but no first order phase transition to the QGP for vanishing or small chemical potentials , i.e. at the conditions accessible at central rapidities at RHIC full energies. A first order phase transition does occur according to the QCD lattice calculations [1, 2] only at high baryochemical potentials or densities, i.e. at SIS-300 and lower SPS energies and in the fragmentation region of RHIC, [3, 4]. The critical baryochemical potential is predicted [1, 2] to be and the critical temperature MeV. We do expect a phase transition also at finite strangeness. Predictions for the phase diagram of strongly interacting matter for realistic non-vanishing net strangeness are urgently needed to obtain a comprehensive picture of the QCD phase structure. Multi-Strangeness degrees of freedom are very promising probes for the properties of the dense and hot matter [5]. The strangeness distillation process [6, 7] predicts dynamical de-admixture of and quarks, which yields unique signatures for QGP creation: high multistrange hyperon-/-matter production, strangelet formation and unusual antibaryon to baryon ratios .
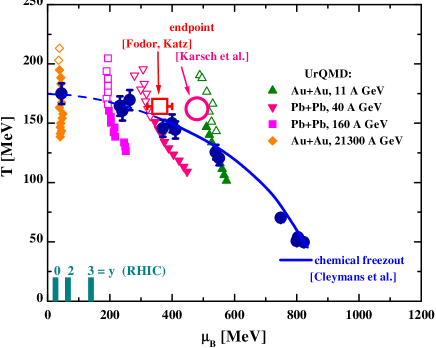
A comparison of the thermodynamic parameters and extracted from the UrQMD-transport model in the central overlap regime of Au+Au collisions [9] with the QCD predictions is shown in Fig 1, where the full dots with errorbars denote the ’experimental’ chemical freeze-out parameters – determined from fits to the experimental yields – taken from Ref. [10]. The triangular and quadratic symbols (time-ordered in vertical sequence) stand for temperatures and chemical potentials extracted from UrQMD transport calculations in central Au+Au (Pb+Pb) collisions at RHIC (21.3 ATeV), 160, 40 and 11 AGeV [8] as a function of the reaction time (separated by 1 fm/c steps from top to bottom). The open symbols denote nonequilibrium configurations and correspond to parameters extracted from the transverse momentum distributions, whereas the full symbols denote configurations in approximate pressure equilibrium in longitudinal and transverse direction.
During the nonequilibrium phase (open symbols) the transport calculations show much higher temperatures (or energy densities) than the ’experimental’ chemical freeze-out configurations at all bombarding energies ( 11 AGeV). These numbers are also higher than the critical point (circle) of (2+1) flavor - Lattice QCD calculations by the Bielefeld-Swansea-collaboration [2] (large open circle) and by the Wuppertal-Budapest-collaboration [1]. The energy density at is in the order of 1 GeV/fm3 (or slightly below). At RHIC energies a cross-over is expected at midrapidity, when stepping down in temperature during the expansion phase of the ’hot fireball’. The baryon chemical potential for different rapidity intervals at RHIC energies has been obtained from a statistical model analysis by the BRAHMS Collaboration based on measured antihadron to hadron yield ratios [11]. For midrapidity one finds , whereas for forward rapidities increases up to MeV at . Thus, only extended forward rapidity measurement ( will allow to probe large at RHIC. The detectors at RHIC at present offer only a limited chemical potential range. This situation changes at lower SPS (and top AGS) as well as at the future GSI SIS-300 energies: sufficiently large chemical potentials should allow for a first order phase transition [12] (to the right of the critical point in the () plane). The transport calculations show high temperatures (high energy densities) in the very early phase of the collisions, only. Here, hadronic interactions are weak due to formation time effects and yield little pressure. Diquark, quark and gluon interactions should cure this problem.
2 Directed and elliptic flow
2.1 General considiration
Hydrodynamic flow and shock formation has been proposed early [13, 14] as the key mechanism for the creation of hot and dense matter during relativistic heavy-ion collisions. The full three-dimensional hydrodynamical flow problem is much more complicated than the one-dimensional Landau model [15]: the 3-dimensional compression and expansion dynamics yields complex triple differential cross-sections, which provide quite accurate spectroscopic handles on the equation of state. The bounce-off, the squeeze-out and the antiflow [16, 17, 18, 19, 20] (third flow component [21, 22]) serve as differential barometers for the properties of compressed, dense matter from SIS to RHIC. Presently, the most employed flow observables are [23]:
| (1) |
Here, denotes the momentum in -direction, i.e. the transversal momentum within the reaction plane and the transversal momentum out of the reaction plane. The total transverse momentum is given as ; the -axis is in the beam direction. Thus, measures the ”bounce-off”, i.e. the strength of the directed flow in the reaction plane, and gives the strength of the second moment of the azimuthal particle emission distribution, i.e. ”squeeze-out” for [13, 14, 16, 17, 18, 19, 20]. In particular, it has been shown [14, 16, 17, 18, 19, 20] that the disappearence or ”collapse” of flow is a direct result of a first order phase transition.
Several hydrodynamic models have been used in the past, starting with the one-fluid ideal hydrodynamic approach. It is well known that the latter model predicts far too large flow effects. To obtain a better description of the dynamics, viscous fluid models have been developed [24, 25, 26]. In parallel, so-called three-fluid models, which distinguish between projectile, target and the fireball fluids, have been considered [29, 30]. Here viscosity effects appear only between the different fluids, but not inside the individual fluids. The aim is to have at our disposal a reliable, three-dimensional, relativistic three-fluid model including viscosity [25, 26].
Flow can be described very elegantly in hydrodynamics (cf. Refs. [31, 32, 33, 34]) by a proper choice of initial conditions which have very strong influence on the final results. In this respect, it is important to consider also microscopic multicomponent (pre-) hadron transport theory, e.g. models like qMD [35], IQMD [36], RQMD [37], UrQMD [38] or HSD [39], as control models for viscous hydro and as background models to subtract interesting non-hadronic effects from data. If Hydro with and without quark matter EoS, hadronic transport models without quark matter – but with strings – are compared to data, can we learn whether quark matter has been formed? What degree of equilibration has been reached? What does the equation of state look like? How are the particle properties, self energies, cross sections changed?
To estimate systematic model uncertainties, the results of the different microscopic transport models also have to be carefully compared. The two robust hadron/string based models, HSD and UrQMD, are considered in the following.
2.2 Review of AGS and SPS results
Microscopic (pre-)hadronic transport models describe the formation and distributions of many hadronic particles at AGS and SPS rather well [40]. Furthermore, the nuclear equation of state has been extracted by comparing to flow data which are described reasonably well up to AGS energies [41, 42, 43, 21, 44, 45]. Ideal hydro calculations, on the other hand, predict far too much flow at these energies [24]. Thus, viscosity effects have to be taken into account in hydrodynamics.
In particular, ideal hydro calculations are factors of two higher than the measured sideward flow at SIS [24] and AGS, while the directed flow measurement of the E895 collaboration shows that the and data are reproduced reasonably well [43] in UrQMD, i.e. in a hadronic transport theory with reasonable cross-sections, i.e. realistic mean-free-path of the constituents.
Only ideal hydro calculations predict, however, the appearance of a so-called ”third flow component” [21] or ”antiflow” [46] in central collisions. We stress that this only holds if the matter undergoes a first order phase transition to the QGP. The signal is that around midrapidity the directed flow, , of protons develops a negative slope! In contrast, a hadronic EoS without QGP phase transition does not yield such an exotic ”antiflow” (negative slope) wiggle in the proton flow .
The ideal hydrodynamic directed proton flow (Fig. 2) shows even negative values between 8 and 20 AGeV. An increase back to positive flow is predicted with increasing energy, when the compressed QGP phase is probed. But, where is the predicted minimum of the proton flow in the data? The hydro calculations suggest that this ”softest point collapse” is at AGeV. This has not been verified by the AGS data! However, a linear extrapolation of the AGS data indicates a collapse of the directed proton flow at AGeV (Fig. 2).
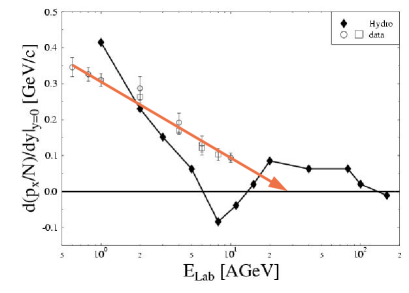
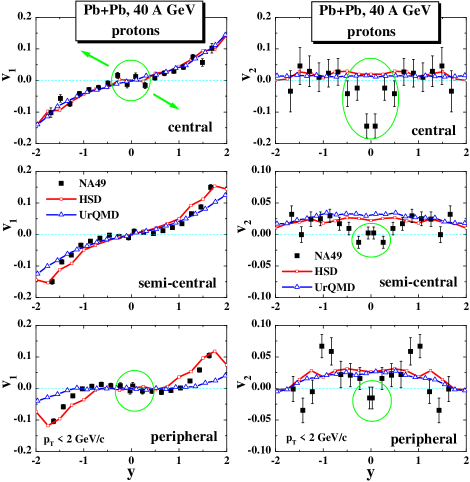
Recently, substantial support for this prediction has been obtained by the low energy 40 AGeV SPS data of the NA49 collaboration [49] (Fig. 3). These data clearly show the first proton ”antiflow” around mid-rapidity, in contrast to the AGS data as well as to the UrQMD and HSD calculations involving no phase transition (Fig. 3, l.h.s.). Thus, at bombarding energies of 30-40 AGeV, a first order phase transition to the baryon rich QGP most likely is already observed; the first order phase transition line is crossed (cf. Fig. 1). This is the energy region where the new FAIR- facility at GSI will operate. There are good prospects that the baryon flow collapses and other first order QGP phase transition signals can be studied at the lowest SPS energies as well as at the RHIC fragmentation region . These experiments will enable a detailed study of the first order phase transition at high and of the properties of the baryon rich QGP.
3 Proton elliptic flow collapse at 40 AGeV - evidence for a first order phase transition at highest net baryon densities
At SIS energies microscopic transport models reproduce the data on the excitation function of the proton elliptic flow quite well: A soft, momentum-dependent equation of state [50, 51, 52] seems to account for the data. The observed proton flow below 5 AGeV is smaller than zero, which corresponds to the squeeze-out predicted by hydrodynamics long ago [13, 14, 16, 17, 18, 19, 20]. The AGS data exhibit a transition from squeeze-out to in-plane flow in the midrapidity region. The change in sign of the proton at 4-5 AGeV is in accord with transport calculations – UrQMD [43] and HSD [44, 45]). At higher energies, 10-160 AGeV, a smooth increase of the flow is predicted from the string-hadronic transport models. In fact, the 158 AGeV data of the NA49 Collaboration suggest that this smooth increase proceeds between AGS and SPS as predicted.
This is in strong contrast to recent NA49 data at 40 AGeV (cf. Fig. 3, r.h.s.): A sudden collapse of the proton flow is observed for central, midcentral as well as for peripheral protons. This collapse of for protons around midrapidity at 40 AGeV is very pronounced while it is not observed at 158 AGeV. The UrQMD and HSD calculations, without a phase transition, show a robust, but wrong 3% flow of protons - in strong contrast to the data.
Thus, the collapse of the and flow has been observed by NA49 [49] at the same energy around 40 AGeV. This is the highest energy – according to [1, 2] and Fig. 1 – at which a first order phase transition can be reached at the central rapidities of relativistic heavy-ion collisions. We, therefore, conclude that a first order phase transition at the highest baryon densities accessible in nature has been seen at these energies in Pb+Pb collisions.
3.1 Strong collective flow at RHIC signals a new phase of matter
The rapid thermalization obtained in parton cascade calculations by Xu and Greiner [53] by including three-body processes in leading-order pQCD (besides gluon- and quark- two-body elementary parton-parton scatterings) justifies a posteriori the use of hydrodynamical calculations for the time evolution of the complex four-dimensional expansion of the plasma. However, there is no justification for the use of simple ideal hydrodynamics (i.e. neglecting the important transport coefficients) and simple, smooth initial conditions in hydrodynamics [25, 26, 54]. PHOBOS data at = 130 GeV and 200 GeV suggest energy independent distributions. Furthermore, the observed distribution has a triangular shape in rapidity. This experimental finding is in strong disagreement with Bjorken boost invariant hydro predictions [55, 12], which fit only the midrapidity region.
The predicted average proton -values obtained from the SPHERIO hydro code with NEXUS initial conditons [56]) are by factors of two higher than simple smooth initial state hydrodynamic calculations. This indicates that ideal hydro with naive smooth initial conditions – as used by many authors – do not describe but rather fit the data. Strong viscosity effects can play a role for particles with GeV/c: a decent description of the dynamics requires, however, relativistic viscous hydro simulations [25, 26, 27]. The NexSpherio simulations [56] predict very large event-by-event fluctuations of caused by the strongly fluctuating initial conditions (given by NEXUS). This effect has been also studied in Ref. [28] where the authors found a strong influence of spatial eccentricity fluctuations on the determination of elliptic flow.
Microscopic transport simulations (HSD and UrQMD) of particle yields, distributions, etc. give a reasonable description of the RHIC Au+Au data [9, 57]. The HSD and UrQMD transport approaches are based on string, quark, diquark () as well as hadronic degrees of freedom but lack explicit gluonic degrees of freedom. At RHIC, UrQMD and HSD yield reasonable abundances of light hadrons composed of quarks 111For a more recent survey on hadron rapidity distributions from 2 to 160 AGeV in central nucleus-nucleus collisions within the HSD and UrQMD transport approaches we refer the reader to Ref. [40].. Do they also predict the collective flow properly?
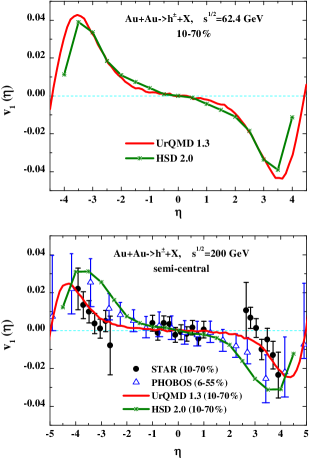
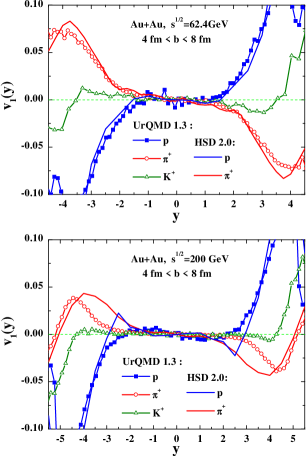
The left part of Fig. 5 shows the UrQMD 1.3 and HSD 2.0 results for the directed flow for charged hadrons from semi-central Au + Au collisions at 200 GeV (left lower plot) versus pseudorapidity in comparison to the data from STAR [66] (10-70% centrality, solid dots) and PHOBOS [67] (6-55% centrality, open triangles) at GeV. The upper left plot in Fig. 5 presents the UrQMD and HSD predictions for 62.4 GeV. UrQMD 1.3 gives a lower as compared to HSD due to the missing jet production in this version. For the UrQMD 2.0 results (which include PYTHIA similar to HSD) we refer to Ref. [68]. The right part of Fig. 5 present the UrQMD 1.3 and HSD 2.0 results for for protons, and from semi-central Au + Au collisions at 62.4 GeV (upper plot) and 200 GeV (lower plot). This shows that the charged particle flow (left part of Fig. 5) can be dominantly attributed to pions. The proton is closer to zero in UrQMD 1.3, while it shows a small ”antiflow” in HSD 2.0. Further high statistics RHIC data will clarify the situation with the directed flow from the experimental side.
The UrQMD prediction for the elliptic flow is clearly not compatible with the measured 6% - it is sizeably underestimated [60]. When shortening the formation time [60] one can get the model results closer to the data, but more additional initial pressure – needed to create the missing extra flow – is not justified in the hadronic transport models.
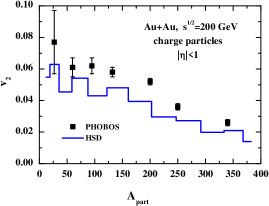
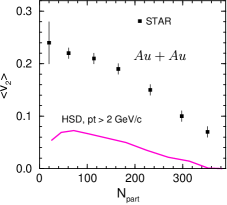
The eliptic flow at low transverse momenta (Fig. 4 l.h.s.) is underestimated in the HSD model by 30% [57]. However, at high transverse momenta ( GeV/c) the -flow is underestimated even by a factor of three (Fig. 4, r.h.s.) in the HSD model [59]. The HSD results are very similar to those of the hadronic rescattering model by Humanic et al. [61, 62] and agree with the calculations by Sahu et al. [63] performed within the hadron-string cascade model JAM [64]. We mention that the microscopic quark-gluon-string model [65] inserts in addition short distance vector repulsion in order to achieve high flow values. Thus, the ”missing” elliptic flow (as well as the inverse slopes [9]) in hadron-string based models indicate that effective partonic degrees of freedom in the initial phase are needed to supply the large pressure and early strong interaction rate.
4 High suppression
4.1 How much quenching of high hadrons is due to (pre-) hadronic final state interactions?
A (mini-)jet at RHIC can produce hard particles, with above 5 GeV/c, but must also form soft particles with around 2 GeV/c. Jets produced in the center of the plasma zone have to pass first through the parton phase at very high temperatures, then through the correlated diquark and constituent quarks and finally through the hadronic phase that has build up preferentially close to the surface of the fireball. Very high jets with materialize only far outside of the plasma. Most of the jets – observed at RHIC – are at GeV/c. More than 50% of the leading jet particles at GeV/c are baryons. Pion jets of 5 GeV have a , i.e., they form far outside the plasma. However, HSD-PYTHIA-calculations [69] show that many pions stem from decaying rho-jets. But, ’s and protons of 5 GeV have . Thus, and p-jets hadronize with roughly 50% probability [59, 70] while passing through the expanding bulk matter. We point out that all partonic and hadronic models have failed by factors of 5-10 to predict the observed high baryon abundance.
The PHENIX [71] and STAR [72] collaborations reported a suppression of meson spectra for transverse momenta above GeV/c. This suppression is not observed in d+Au interactions at the same bombarding energy per nucleon [73, 74] and presents clear evidence for the presence of a new form of matter. However, it is not clear at present how much of the observed suppression can be attributed to (pre-)hadronic interactions (FSI) [59, 70]. (In-)elastic collisions of (pre-)hadronic high momentum states with some of the bulk (pre-)hadrons in the fireball can contribute in particular to the attenuation of GeV/c transverse momentum hadrons at RHIC [69]: Most of the medium momentum (pre-)hadrons from a GeV/c double jet will materialize inside the dense plasma; their transverse momenta being 0-4 GeV/c. The particles are dominantly ’s, K’s and baryons at GeV/c – hence their formation time is fm/c in the plasma rest frame. The time for color neutralization can also be very small [75] for the leading particle due to early gluon emission.
The (pre-)hadronic interactions with the bulk of the (pre-)hadronic comovers then must have clearly an effect: they, too, suppress the -spectrum [59]. (In)elastic reactions of the fragmented (pre-)hadrons with (pre-)hadrons of the bulk system cannot be described by pQCD: The relevant energy scale is a few GeV. Such (in-)elastic collisions are very efficient for energy degradation since many hadrons with lower energies are produced. On the average, 1 to 2 such interactions can account for up to 50% of the attenuation of high hadrons at RHIC [70]. Hence, the hadronic fraction of the jet-attenuation had to be addressed.
Such studies have been carried out in Ref. [59] within the HSD transport approach [39]. Moderate to high transverse momenta ( GeV/c) have been incorporated by a superposition of collisions described via PYTHIA [76]. We point out that in Au+Au collisions the formation of secondary hadrons is not only controlled by the formation time , but also by the energy density in the local rest frame, i.e. hadrons are not allowed to be formed if the energy density is above 1 GeV/fm3222This energy density cut is employed in the default HSD approach.. The interactions of the leading and energetic (pre-)hadrons with the soft hadronic and bulk matter are thus explicitly modeled.
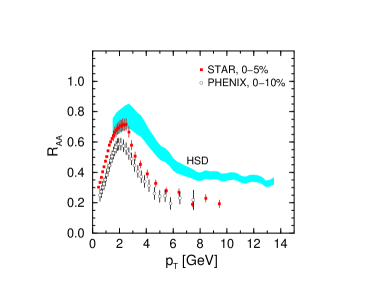
Fig. 6 shows the nuclear modification factor [69]
| (2) |
for the most central (5% centrality) Au+Au collisions at RHIC. The Cronin enhancement is visible at all momenta. Hadron formation time effects do play a substantial role in the few GeV region, since heavier hadrons (K∗’s, ’s, protons) are formed 7 times earlier than the rather light pions in the cms frame at fixed transverse momentum due to the lower Lorentz boost . It was shown in [59] that for transverse momenta GeV/c the interactions of formed hadrons are not able to explain the attenuation observed experimentally. However, the ratio is influenced by interactions of formed (pre-)hadrons in the range [59]; a similar behaviour has also been found in UrQMD simulations [79].
As pointed out before, the suppression seen in the calculation for larger transverse momentum hadrons is due to the interactions of the leading (pre-)hadrons with target/projectile nucleons and the bulk of low momentum hadrons. It is clear that the experimentally observed suppression can not be quantitatively described by the (pre-)hadronic attenuation of the leading particles [59]. The ratio (3) decreases to a value of about at 5 GeV for central collisions, whereas the data are around .
For particles observable with momenta GeV/c, the HSD transport calculation predicts that still 1/3 of the final observed hadrons have suffered one or more interactions, whereas the other 2/3 escape freely, i.e., without any interaction (even for central collisions). This implies that the final high hadrons originate basically from the surface.
4.2 Angular Correlations of Jets – Can jets fake the large -values observed?
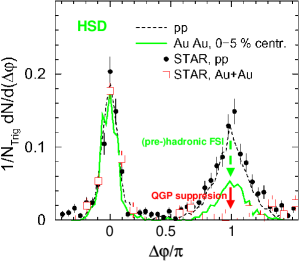
Fig. 7 (l.h.s.) [69] shows the angular correlation of high particles (, , ) for the 5% most central Au+Au collisions at = 200 GeV (solid line) as well as reactions (dashed line) from the HSD model [69] in comparison to the data from STAR for collisions [80]. Gating on high hadrons (in the vacuum) yields ’near–side’ correlations in Au+Au collisions close to the ’near–side’ correlations observed for jet fragmentation in the vacuum (pp). This is in agreement with the experimental observation [80]. However, for the away-side jet correlations, the authors of Ref. [69] get only a 50% reduction, similar to HIJING, which has only parton quenching and neglects hadron rescattering. Clearly, the observed [80] complete disappearance of the away-side jet (Fig. 7) cannot be explained in the HSD (pre-)hadronic cascade even with a small formation time of fm/c. Hence, the correlation data provide another clear proof for the existence of the bulk plasma.
Although (pre-)hadronic final state interactions yield a sizable () contribution to the high suppression effects observed in Au+Au collisions at RHIC, of the jet suppression originates from interactions in the plasma phase. The elliptic flow, , for high transverse momentum particles is underestimated by at least a factor of 3 in the HSD transport calculations [59] (cf. Fig. 4). The experimentally observed proton excess over pions at transverse momenta GeV/c cannot be explained within the CGG approach [59]; in fact, the proton yield at high GeV/c is a factor 5-10 too small. We point out that this also holds for partonic jet-quenching models.
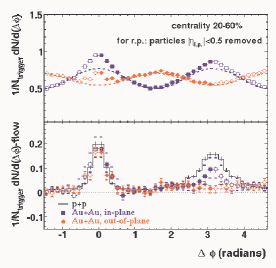
Futhermore, can the attenuation of jets of GeV/c actually fake the observed -values at GeV/c? This question comes about since due to fragmentation and rescattering a lot of momentum-degraded hadrons will propagate in the hemisphere defined by the jets. However, their momentum dispersion perpendicular to the jet direction is so large that it could indeed fake a collective flow that is interpreted as coming from the high pressure early plasma phase (cf. also Ref. [81]).
On first sight, Fig. 7 (r.h.s) shows that this could indeed be the case: the in-plane correlations are aligned with the jet axis, the away-side bump, usually attributed to collective flow (dashed line), could well be rather due to the stopped, fragmented and rescattered away-side jet! However, this argument is falsified by the out-of-plane correlations (circles in r.h.s. Fig. 7). The near-side jet is clearly visible in the valley of the collective flow distribution. Note that peaks atm relative to the jet axis! The away-side jet, on the other hand, has completely vanished in the out-of-plane distribution !
Where are all the jet fragments gone? Why is there no trace left? Even if the away-side jet fragments completely and the fragments get stuck in the plasma, leftovers should be detected at momenta below 2 GeV/c. Hadronic models as well as parton cascades will have a hard time to get a quantitative agreement with these exciting data!
We propose future correlation measurements which can yield spectroscopic information on the plasma:
-
1.
If the plasma is a colorelectric plasma, experiments will - in spite of strong plasma damping - be able to search for wake-riding potential effects. The wake of the leading jet particle can trap comoving companions that move through the plasma in the wake pocket with the same speed () as the leading particle. This can be particular stable for charmed jets due to the deadcone effect as proposed by Kharzeev et al [82], which will guarantee little energy loss, i.e. constant velocity of the leading D-meson. The leading D-meson will practically have very little momentum degradation in the plasma and therefore the wake potential following the D will be able to capture the equal speed companion, which can be detected [83].
-
2.
One may measure the sound velocity of the expanding plasma by the emission pattern of the plasma particles travelling sideways with respect to the jet axis: The dispersive wave generated by the wake of the jet in the plasma yields preferential emission to an angle (relative to the jet axis) which is given by the ratio of the leading jet particles’ velocity, devided by the sound velocity in the hot dense plasma rest frame. The speed of sound for a non-interacting gas of relativistic massless plasma particles is , while for a plasma with strong vector interactions, . Hence, the emission angle measurement can yield information of the interactions in the plasma.
5 Summary
The NA49 collaboration has observed the collapse of both, - and -collective flow of protons, in Pb+Pb collisions at 40 AGeV, which presents first evidence for a first order phase transition in baryon-rich dense matter. It should be possible to study the nature of this transition and the properties of the expected chirally restored and deconfined phase both at the forward fragmentation region at RHIC, with upgraded and/or second generation detectors, and at the new GSI facility FAIR. According to Lattice QCD results [1, 2], the first order phase transition occurs for chemical potentials above 400 GeV. Thus, the observed collapse of flow, as predicted in [13, 14], is a clear signal for a first order phase transition at the highest baryon densities.
A critical discussion of the use of collective flow as a barometer for the equation of state (EoS) of hot dense matter at RHIC showed that hadronic rescattering models can explain of the observed elliptic flow for GeV/c. We interpret this as evidence for the production of superdense matter at RHIC with initial pressure way above hadronic pressure, GeV/fm3.
The fluctuations in the flow, and , should be measured. Ideal Hydrodynamics predicts that they are larger than 50 % due to initial state fluctuations. The QGP coefficient of viscosity may be determined experimentally from the fluctuations observed.
The connection of to jet suppression has been examined. It is proven experimentally that the collective flow is not faked by minijet fragmentation and theoretically that the away-side jet suppression can only partially ( 50%) be due to pre-hadronic or hadronic rescattering.
We propose upgrades and second generation experiments at RHIC, which inspect the first order phase transition in the fragmentation region, i.e. at MeV (), where the collapse of the proton flow – analogous to the 40 AGeV data – should be seen. Furthermore, the study of Jet-Wake-riding potentials and Bow shocks caused by jets in the QGP formed at RHIC can give further clues on the equation of state and transport coefficients of the Quark Gluon Plasma. Moreover, we propose that the change in sign of closer to beam rapidity is related to the occurence of a high density first order phase transition in the RHIC data at 62.5, 130 and 200 AGeV.
We like to thank W. Cassing, A. Dumitru, K. Gallmeister, C. Greiner, K. Paech, A. Tang, N. Xu and Z. Xu for their contributions to this review.
References
References
- [1] Z. Fodor and S. D. Katz, JHEP 0203 (2002) 014; JHEP 0404 (2004) 050.
- [2] F. Karsch, J. Phys. G 30 (2004) S887.
- [3] R. Anishetty, Peter Koehler, and Larry D. McLerran, Phys. Rev. D 22 (1980) 2793.
- [4] S. Date, M. Gyulassy, and H. Sumiyoshi, Phys. Rev. D 32 (1985) 619.
- [5] P. Koch, B. Müller, and J. Rafelski, Phys. Rept. 142 (1986) 167.
- [6] C. Greiner, P. Koch, and H. Stöcker, Phys. Rev. Lett. 58 (1987) 1825.
- [7] C. Greiner, D. Rischke, H. Stöcker, and P. Koch, Phys. Rev. D 38 (1988) 2797.
- [8] L. V. Bravina et al., Phys. Rev. C 60 (1999) 024904; Nucl. Phys. A 698 (2002) 383.
- [9] E. L. Bratkovskaya et al., Phys. Rev. C 69 (2004) 054907.
- [10] J. Cleymans and K. Redlich, Phys. Rev. C60 (1999) 054908.
- [11] I. G. Bearden et al., Phys. Rev. Lett. 90 (2003) 102301.
- [12] E. Shuryak, Nucl. Phys. A 661 (1999) 119.
- [13] J. Hofmann, H. Stöcker, W. Scheid, and W. Greiner, Report of the workshop on BeV/nucleon collisions of heavy ions - how and why, Bear Mountain, New York, Nov. 29 - Dec. 1, 1974 (BNL-AUI 1975).
- [14] J. Hofmann, H. Stöcker, U. W. Heinz, W. Scheid, and W. Greiner, Phys. Rev. Lett. 36 (1976) 88.
- [15] L.D. Landau and E.M. Lifshitz, Fluid Mechanics, Pergamon Press, New York, 1959.
- [16] H. Stöcker, J. Hofmann, J. A. Maruhn, and W. Greiner, Prog. Part. Nucl. Phys. 4 (1980) 133.
- [17] H. Stöcker, J. A. Maruhn, and W. Greiner, Phys. Rev. Lett. 44 (1980) 725.
- [18] H. Stöcker et al., Phys. Rev. Lett. 47 (1981) 1807.
- [19] H. Stöcker et al., Phys. Rev. C 25 (1982) 1873.
- [20] H. Stöcker and W. Greiner. Phys. Rept. 137 (1986) 277.
- [21] L. P. Csernai and D. Rohrich, Phys. Lett. B 458 (1999) 454.
- [22] L. P. Csernai et al., hep-ph/0401005.
- [23] S. Voloshin, Y. Zhang, Z. Phys. C 70 (1996) 665.
- [24] W. Schmidt et al., Phys. Rev. C 47 (1993) 2782.
- [25] A. Muronga, Heavy Ion Phys. 15 (2002) 337.
- [26] A. Muronga, Phys. Rev. C 69 (2004) 034903.
- [27] A. Muronga, Phys. Rev. C 69 (2004) 044901.
- [28] M. Miller and R. Snelling, nucl-ex/0312008.
- [29] J. Brachmann et al., Nucl. Phys. A 619 (1997) 391.
- [30] V.D. Toneev et al., nucl-th/0309008.
- [31] P. F. Kolb et al., Nucl. Phys. A 696 (2001) 197.
- [32] D. Teaney, Phys. Rev. C 68 (2003) 034913.
- [33] E. Shuryak, J. Phys. G 30 (2004) S1221.
- [34] T. Hirano and Y. Nara, nucl-th/0409045.
- [35] M. Hofmann et al., nucl-th/9908031.
- [36] C. Hartnack et al., Nucl. Phys. A 495 (1989) 303c.
- [37] H. Sorge, Phys. Rev. G 52 (1995) 3291.
- [38] S. A. Bass, M. Gyulassy, H. Stöcker, and W. Greiner, J. Phys. G 25 (1999) R1.
- [39] W. Cassing and E. L. Bratkovskaya, Phys. Rept. 308 (1999) 65.
- [40] H. Weber, E. L. Bratkovskaya, W. Cassing, and H. Stöcker, Phys. Rev. C 67 (2003) 014904.
- [41] A. Andronic et al., Phys. Rev. C 67 (2003) 034907.
- [42] A. Andronic et al., Phys. Rev. C 64 (2001) 041604.
- [43] S. Soff, S. A. Bass, M. Bleicher, H. Stöcker, and W. Greiner, nucl-th/9903061.
- [44] P. K. Sahu and W. Cassing, Nucl. Phys. A 672 (2000) 376.
- [45] P. K. Sahu and W. Cassing, Nucl. Phys. A 712 (2002) 357.
- [46] J. Brachmann, PhD thesis, J. W. Goethe Universität Frankfurt am Main, 2000.
- [47] J. Brachmann et al., Phys. Rev. C 61 (2000) 024909.
- [48] K. Paech, M. Reiter, A. Dumitru, H. Stöcker, and W. Greiner, Nucl. Phys. A 681 (2001) 41.
- [49] C. Alt et al., Phys. Rev. C 68 (2003) 034903.
- [50] A. Andronic et al., Nucl. Phys. A 679 (2001) 765.
- [51] A. Andronic, Nucl. Phys. A 661 (1999) 333.
- [52] A. Larionov et al., Phys. Rev. C 62 (2000) 064611.
- [53] Z. Xu and C. Greiner, hep-ph/0406278.
- [54] D. A. Teaney, J. Phys. G 30 (2004) S1247.
- [55] U. Heinz and P. F. Kolb, J. Phys. G 30 (2004) S1229.
- [56] C. E. Aguiar, Y. Hama, T. Kodama, and T. Osada, Nucl. Phys. A 698 (2002) 639.
- [57] E. L. Bratkovskaya, W. Cassing, and H. Stöcker, Phys. Rev. C 67 (2003) 054905.
- [58] S. Manly et al., Nucl. Phys. A 715 (2003) 611.
- [59] W. Cassing, K. Gallmeister, and C. Greiner, Nucl. Phys. A 735 (2004) 277.
- [60] M. Bleicher and H. Stöcker, Phys. Lett. B 526 (2002) 309.
- [61] T. J. Humanic, nucl-th/0203004.
- [62] R. Bellwied, H. Caines, and T. J. Humanic, Phys. Rev. C 62 (2000) 054906.
- [63] P. K. Sahu, N. Otuka, and A. Ohnishi, nucl-th/0206010.
- [64] Y. Nara, N. Otuka, A. Ohnishi, K. Niita, and S. Chiba, Phys. Rev. C 61 (2000) 024901.
- [65] E. Zabrodin, L. Bravina, C. Fuchs, and A. Faessler, Prog. Part. Nucl. Phys. 53 (2004) 183.
- [66] An Tai et al., STAR Collaboration, J. Phys. G 30 (2004) S809.
- [67] S. Manly et al., PHOBOS Collaboration, nucl-ex/0405029.
- [68] M. Bleicher et al., this proceedings.
- [69] W. Cassing, K. Gallmeister, and C. Greiner. J. Phys. G 30 (2004) S801.
- [70] K. Gallmeister, C. Greiner, and Z. Xu. Phys. Rev. C 67 (2003) 044905.
- [71] S. S. Adler et al., Phys. Rev. C 69 (2004) 034910.
- [72] J. Adams et al., Phys. Rev. Lett. 91 (2003) 172302.
- [73] S. S. Adler et al., Phys. Rev. Lett. 91 (2003) 072303.
- [74] J. Adams et al., Phys. Rev. Lett. 91 (2003) 072304.
- [75] B. Z. Kopeliovich, J. Nemchik, E. Predazzi, and A. Hayashigaki, Nucl. Phys. A 740 (2004) 211.
- [76] T. Sjostrand et al., Comput. Phys. Commun. 135 (2001) 238.
- [77] J. L. Nagle, Nucl. Phys. A 715 (2003) 252.
- [78] C. Adler et al., Phys. Rev. Lett. 87 (2001) 262302.
- [79] S. A. Bass et al., Nucl. Phys. A 661 (1999) 205.
- [80] C. Adler et al., Phys. Rev. Lett. 90 (2003) 082302.
- [81] Yu. V. Kovchegov and K. L. Tuchin Nucl.Phys. A 708 (2002) 413.
- [82] D. Kharzeev, private communication.
- [83] W. Schäfer, H. Stöcker, B. Müller, and W. Greiner, Z. Phys. A 288 (1978) 349.