Resonance decay effects on anisotropy parameters
Abstract
We present the elliptic flow of pions produced from resonance decays. The transverse momentum spectra of the parent particles are taken from thermal model fits and their are fit under the assumption that they follow a number-of-constituent-quark (NCQ) scaling law expected from quark-coalescence models. The of pions from resonance particle decays is found to be similar to the measured pion . We also propose the measurement of electron as a means to extract open-charm and investigate whether a thermalized system of quasi-free quarks and gluons (a quark-gluon plasma) is created in collisions of Au nuclei at RHIC.
keywords:
elliptic flow , resonance decays , coalescencePACS:
25.75.LdIntroduction.—One of the surprising observations made at RHIC is the measurement of a number-of-constituent-quark (NCQ) dependence for both elliptic flow and the nuclear modification factor at intermediate ( GeV/c) [1]. Models of hadron formation by constituent-quark coalescence provide a viable explanation for these observations whereas expectations based on conventional fragmentation approaches are inconsistent with the data [2, 3, 4]. In coalescence models an NCQ-scaling of arises as a consequence of hadrons coalescing out of a thermal distribution of partons and reveals the flow developed during a partonic epoch at RHIC. Pion , however, appears to violate NCQ-scaling. In this paper, we study the effect of resonance decays on pion . We show that when decays are taken into account, the measured pion may become consistent with the NCQ-scaling demonstrated by kaon (), proton, , and [1, 5].
The particle azimuthal distribution with respect to the reaction plane at rapidity can be described by a Fourier expansion:
| (1) |
where is the difference in azimuth angle between the particle and the reaction plane. The first and second Fourier coefficients, and , historically are called directed and elliptic flow, respectively. All coefficients can be calculated from the relation: .
As the volume of the system created in an off-axis nucleus-nucleus collision expands, its spatial anisotropy quenches. The momentum-space anisotropies represented by the Fourier coefficients preserve information about the early collision dynamics when the spatial anisotropy was largest [2, 6, 7, 8]. Since the initial overlap region is elliptical in shape, the second harmonic coefficient is the largest and most studied.
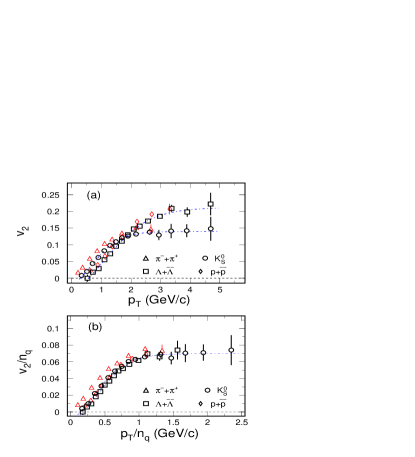
NCQ-scaling of .—Fig. 1 shows the , , , and from minimum-bias collisions at = 200 GeV [1, 5]. In the lower region ( GeV/c), the values of are lower for higher mass hadrons. Hydrodynamic calculations [9] predict the observed mass dependence of –perhaps implying that a thermalized system has been created in collisions at RHIC energy. At higher ( GeV/c), the measurements saturate at values below the hydrodynamic model predictions. The saturated value of and the scale where the saturation sets in depends on the particle-type: the baryon saturates at higher and at larger values than that of mesons.
According to coalescence models [4], after scaling both and with the number of the constituent quarks (NCQ) in the corresponding hadron, all particles at intermediate should fall onto one universal curve. The NCQ-scaled measurements in Fig. 1-(b) show that ()/ for GeV/c is similar for all particles except pions. This observation, coupled with the NCQ-dependence observed at intermediate in the nuclear modification factor is evidence of hadron formation by coalescence or recombination. In this case, ()/ represents a constituent quark momentum-space anisotropy that arises as a consequence of collectivity in a partonic stage. Based on coalescence models, NCQ-scaling suggests the creation of a quark-gluon plasma (QGP) with characterizing the properties of the QGP. For this reason, understanding the source of the discrepancy in the NCQ-scaled pion is imperative.
With this goal in mind, we study the effect of secondary pions (from particle decays) on the measured pion . We assume that NCQ scaling is valid for all hadrons other than pions and use the published measurements [1, 5] to parameterize ()/. The distributions are assumed to follow an exponential form with slope parameters taken from measurements when available. We use chemical fits to fix the relative hadron abundances [10, 11]. Since the pion mass is much smaller than the sum of its constituent quarks masses, direct pions are not necessarily assumed to follow the scaling predicted from coalescence models. As such, we do not consider direct pions, and instead choose to study the of the secondary pions. Given the model uncertainties, extraction of the direct pion is difficult and remains an open question. Finally we will discuss how to extract open-charm based on the decayed electrons.
Simulation results.—The values of the simulated resonances are parameterized by fitting and [1] with the equation:
| (2) |
where and are the fit parameters, is the constituent-quark number, and is in the unit of GeV/c. The fit results are shown as dot-dashed lines in Fig. 1, where the fitting parameters are , , and . The NCQ-scaling of works well for kaons, protons and Lambdas within GeV/c whereas pion deviates from NCQ scaling for all . The parameters from chemical fits are listed in Table 1.
| T1 | T2 | T3 | Fraction (%) | |
|---|---|---|---|---|
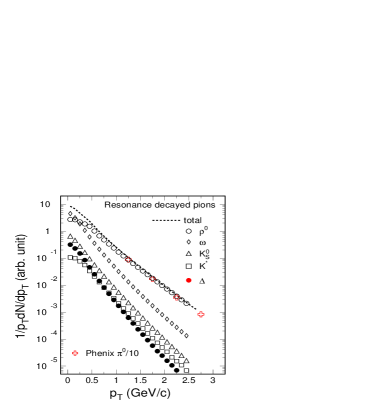
In high-energy collisions, a large fraction of hadrons are produced through resonance decays. This is particularly true for pions in high-energy heavy-ion collisions. At mid-rapidity, in collisions at RHIC, as many as 80% of pions are from resonance decays [12]. The dominant decays are , , , and . With such a potentially large fraction of pions arising from decays, accounting for their effect on the observed pion is very important.
The distributions of pions from resonance decays are shown in Fig. 2. Many pions at low are generated from resonances at larger where presumably the parent particle is larger. As a result the decayed pions take on a relatively large value. The decays from the - and -mesons dominate the secondary pion spectrum. In this plot, a slope parameter of T = 0.4 GeV is used for the distributions. In peripheral collisions, the STAR measured slope parameter is 319(stat.) (syst.) MeV [13]. The simulated results are in a good agreement with the PHENIX data from minimum bias collisions [14].
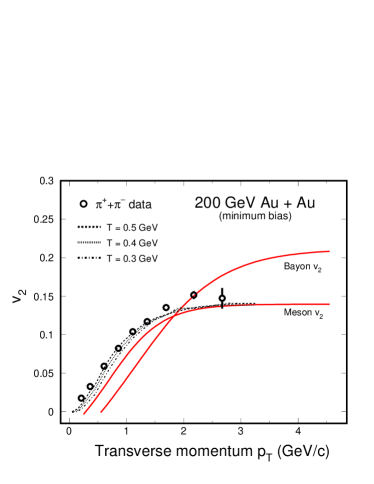
In Fig. 3, the values for the simulated decay pions are shown as dashed-lines. The resonances included in this study are the , , , and . The decay with a 100% branching ratio dominates the production of secondary-pions. The simulated resonance particles are restricted to mid-rapidity . Increasing the rapidity window does not change the results. The pion in the region GeV/c is sensitive to the shape of the spectrum. Dashed-, dotted-, and dot-dashed-lines correspond to the results from the different slope parameters listed in Table 1. For the smaller slope parameter T = 300 MeV, the decayed pion is below the data, leaving room for other contributions [15].
The effects of resonance decays on proton and kaon were also investigated. As in Ref. [15], they were found to increase the observed above the assumed NCQ-scaled input but by a much smaller degree than that of pions. Since the of kaons is used in our fits, resonance decays can change our assumed input . These changes, however, will be small. In this paper we concentrate on the pion .
D-meson .—NCQ scaling suggests that hadrons at intermediate are formed from a thermal partonic phase created in heavy-ion collisions at RHIC. In this system, the high initial matter density gradient and copious interactions among partons leads to a collective motion. The large values measured for multi-strange hadrons also indicate that partonic collectivity develops in collisions at RHIC [16]. The demonstration of collectivity is necessary but not sufficient to show that local thermal equilibrium is established. If collectivity is developed by much heavier charm quarks, however, it suggests that interactions between charm quarks and -, -, or -quarks must have been frequent enough and strong enough for the lighter quarks to have thermalized. For this reason, the measurement of heavy flavor (open-charm) can probe the degree to which the lighter -, -, and -quarks thermalize.
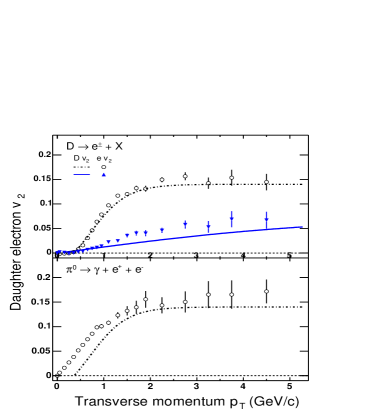
Since a large fraction of heavy-flavor hadrons decay through leptonic modes, electron measurements may offer a convenient way to study open-charm . In Fig. 4-(top), the for electrons from D-meson decays is shown. Dot-dashed lines represent the of the parent meson taken from our fit to the NCQ-scaled and . The solid line represents a D-meson where D-mesons are assumed to coalesce from light quarks with and charm quarks with [17]. We simulate the D-meson distribution using the PYTHIA event generator [18]. The shape of the calculated spectrum is well represented by a power-law function. Approximately 50 M D-meson events are used in this simulation. For electron GeV/c, and a saturated at higher the of electrons from D-meson decays becomes similar to the parent D-meson . The decay electron is found to be sensitive to changes in the assumed D-meson . As such, the measurement of electron can distinguish between and . The degree of heavy flavor thermal equilibrium can be assessed by measuring electron within GeV/c, a region which corresponds to GeV/c. The authors of Ref. [19] come to a similar conclusion but do not evaluate background contributions to the electron spectrum.
Neutral pion decays are the dominant source of “background” electrons. While the two-photon decay process,
can be identified by its decay topology [20], the pion Dalitz decay can only be subtracted statistically. In Fig. 4-(b) we show the of electrons from simulated pion Dalitz decays. The pion distribution can be obtained from measurements at RHIC [14]. For these simulations a 100% conversion probability is assumed. In STAR, however, the probability is closer to 5%. The decayed electrons predominantly have 0.5 GeV/c [20].
Electrons from heavy flavor decays begin to dominate the electron spectrum above GeV/c. With knowledge of the pion yield, D-meson yield, the pion , and the electron it will be possible to extract the D-meson . These measurements can be made by both the PHENIX and STAR collaborations at RHIC. Direct photon can also be measured with this method.
Summary.—We have studied the effect of resonance decays on the pion in Au+Au collisions at RHIC. When the values for resonances are assumed to follow NCQ scaling, the pions generated in their decays take on values similar to those measured at RHIC. The dominant source of secondary pions is decays. We have shown that when decays are accounted for, the measured pion values may become consistent with the NCQ scaling law that suggests the development of partonic collectivity in collisions at RHIC. Model uncertainties, however, make it difficult to extract the direct pion . In addition, we propose the measurement of electron as a means to study open-charm and hence the degree of thermalization reached at RHIC.
Acknowledgements: We appreciate fruitful discussions with V. Greco, P. Huovinen, C. Ko, H.G. Ritter, E.V. Shuryak and S. Voloshin. This work was supported in part by the NSFC under the Project No. 10275027 and the U.S. Department of Energy under Contract No. DE-AC03-76SF00098.
References
- [1] J. Adams et al. [STAR Collaboration], Phys. Rev. Lett. 92, 052302 (2004).
- [2] S. A. Voloshin, Nucl. Phys. A 715, 379 (2003).
- [3] R. J. Fries, B. Muller, C. Nonaka and S. A. Bass, Phys. Rev. C 68, 044902 (2003).
- [4] Z. w. Lin and C. M. Ko, Phys. Rev. Lett. 89, 202302 (2002); R. J. Fries, B. Muller, C. Nonaka and S. A. Bass, Phys. Rev. Lett. 90, 202303 (2003); D. Molnar and S. A. Voloshin, Phys. Rev. Lett. 91, 092301 (2003).
- [5] S. S. Adler et al. [PHENIX Collaboration], Phys. Rev. Lett. 91, 182301 (2003).
- [6] H. Sorge, Phys. Lett. B 402, 251 (1997).
- [7] J. Y. Ollitrault, Phys. Rev. D 46, 229 (1992).
- [8] N. Xu and Z. b. Xu, Nucl. Phys. A 715, 587 (2003).
- [9] P. Huovinen, P. F. Kolb and U. W. Heinz, Nucl. Phys. A 698, 475 (2002); P. Huovinen, P. F. Kolb, U. W. Heinz, P. V. Ruuskanen and S. A. Voloshin, Phys. Lett. B 503, 58 (2001).
- [10] P. Braun-Munzinger, K. Redlich and J. Stachel, arXiv:nucl-th/0304013 and references therein.
- [11] N. Xu and M. Kaneta, Nucl. Phys. A 698, 306 (2002).
- [12] Z. b. Xu, J. Phys. G 30, S325 (2004).
- [13] J. Adams et al. [STAR Collaboration], Phys. Rev. Lett. 92, 092301 (2004).
- [14] S. S. Adler et al. [PHENIX Collaboration], Phys. Rev. Lett. 91, 172301 (2003).
- [15] V. Greco and C. M. Ko, arXiv:nucl-th/0402020.
- [16] J. Adams et al. [STAR Collaboration], Phys. Rev. Lett. 92, 182301 (2004).
- [17] Z. w. Lin and D. Molnar, Phys. Rev. C 68, 044901 (2003).
- [18] T. Sjöstrand, L. Lönnblad and S. Mrenna, arXiv:hep-ph/0108264 and references therein.
- [19] V. Greco, C. M. Ko and R. Rapp, arXiv:nucl-th/0312100.
- [20] I. J. Johnson [STAR Collaboration], Nucl. Phys. A 715, 691 (2003); J. Adams et al. [STAR Collaboration], arXiv:nucl-ex/0401008.