Probing the densities of the Sn isotopes
Abstract
Proton and neutron densities have been obtained for the even-even isotopes of Sn from 100Sn to 176Sn using a Hartree-Fock-Bogoliubov model with a Skyrme interaction. The matter densities so defined have been used with realistic nucleon-nucleon interactions in a folding model to specify optical potentials for the elastic scattering of protons with energies in the range 40 to 200 MeV. Those potentials have been used to make predictions of the differential cross sections and spin observables for proton scattering. As the target mass increases, the emergence of the neutron skin in the Sn isotopes is revealed by marked effects in the differential cross section. Comparisons with available data show how similar scattering data for the neutron-rich isotopes may provide constraints for the model structures.
pacs:
21.10.Gv,24.10.Ht,25.40.CmI introduction
One of the goals of modern nuclear physics is to understand the structures of nuclei far from the line of stability and at extremes of isospin. Thus far such studies have largely dealt with the light nuclei for which radioactive beams have been available at facilities such as TRIUMF/ISAC, NSCL, RIKEN, and CERN/ISOLDE. Early experiments have led to the identification of novel structures of which the halo Hansen et al. (1995) is the best known after its identification in 11Li. In light of projected experimental facilities using radioactive ion beams to extend such investigations to heavy nuclei, there have been advances in the theoretical study of neutron rich nuclei across the whole mass range (see refs. Hansen et al. (1995); Roeckl (1992); Mueller and Sherrill (1993); Riisager (1994); Dobaczewski and Nazarewicz (1998) for reviews). Studies of such nuclei have topical interest since nuclei far from stability play an important role in nucleo-synthesis with short-lived species formed as part of the - and - processes. Notably the structure of such nuclei determine the rates at which - and nucleon-capture reactions proceed against the interplay of weak decays and photo-disintegration; key elements in the determination of the abundances of nuclei in the universe.
Of course, these exotic systems are of interest in their own right given that they may exhibit forms of nuclear matter quite different from those of stable isotopes. Of particular interest are the separate density distributions of proton and neutrons. As well as halos, heavier systems may lead to the identification of pronounced neutron skins Mizutori et al. (2000) and/or to dramatic changes in nuclear shell structure Dobaczewski et al. (1994).
An important quantity by which the model structures are tested is the ground state density. For stable nuclei, one usually seeks information about that from the elastic scattering of electrons. The electron scattering form factors so determined are measures of the charge and current densities of the nucleus. Complementing that information, which primarily focuses on the proton density itself, are analyses of data from the elastic scattering of nucleons. Nucleon scattering probes the matter density of the nucleus and, at the energies we consider of the neutron matter distribution in particular. That is so since the effective nucleon-nucleon () interaction is strongest in the isoscalar channel Amos et al. (2000). Of course there are non-negligible contributions to proton scattering from their interactions with the bound protons and such are included in all calculations we have made. But as evident from the recent study Karataglidis et al. (2002) of proton and neutron elastic scattering at the same energies from 208Pb, the differential cross sections from proton (neutron) scattering do reflect changes primarily made in the distributions of neutron (proton) matter distributions of the target. Indeed they did so sufficiently well that cross section data could be used to estimate the neutron skin thickness of 208Pb. For radioactive nuclei, the only available equivalent measure of the ground state density comes from the scattering of nuclei from hydrogen which, in the inverse kinematics, corresponds to proton scattering from the nucleus as target.
For nuclei above the -shell, mean-field models of structure are at the forefront of current studies of the ground state densities. Usually those calculations are made in a relativistic Hartree or Hartree-Fock model Serot and Walecka (1986); Celenza and Shakin (1986); Nikolaus et al. (1992); Ring (1996); Bürvenich et al. (2002) or a non-relativistic Skyrme-Hartree-Fock-Bogoliubov model Ring and Schuck (1980); Brown (2000); Dobaczewski et al. (2001); Bender et al. (2003). This mean-field approach works as the ground state properties for heavy nuclei arise more generally from the bulk properties of the density as opposed to single particle (SP) properties. As one approaches the drip lines, however, surface properties become more important and, in concert, so do SP densities.
As noted above, a test case has been to use nucleon elastic scattering to determine/extract the neutron skin thickness in 208Pb. Karataglidis et al. Karataglidis et al. (2002) have shown that the differential cross sections from the elastic scattering of 200 MeV protons from 208Pb suggests a neutron skin thickness in 208Pb of fm; a result that has been confirmed recently Clark et al. (2003). More importantly, the study by Karataglidis et al. Karataglidis et al. (2002) also showed that such scattering analyses could select between disparate model structures that have the same root mean square (rms) radii. By itself, the rms radius is not an adequate indicator of the validity of a model structure. To use the scattering data to differentiate between models of structure, a predictive theory of nucleon-nucleus () scattering was needed, and such has been developed in the past decade Amos et al. (2000). That theory is direct in that all quantities required are defined a priori with no a posteriori adjustment of results. With the nucleus viewed as a system of nucleons, scattering is determined by an optical potential formed by a folding process. Such microscopic approaches defining the optical potential have been quite successful in predicting both angle-dependent and integral observables of elastic scattering Amos et al. (2000); Deb et al. (2001). It is important to note that distinction in scattering cross sections resulting from use of different “sensible” models of structure, are in the details and particularly it seems with results in the region of 1 to 2.5 fm-1 momentum transfer values. Thus one needs as complete a calculation of the optical potentials as possible and to use it with no further approximation if possible. The contribution to scattering of the knock-out exchange amplitudes for all energies are such that it is not wise to use an equivalent localization of the associated nonlocal terms. We do not and so solve the nonlocal Schrödinger equations directly. However, that also means that we must have the single particle bound state wave functions (or equivalently the complete one body density matrix elements) and not just the matter densities from structure.
The Sn isotopes are of interest for current structure studies. First many of the set that span the quite extensive range of mass between the nucleon drip lines can be formed as radioactive ions with some in numbers sufficient to perform scattering experiments. Measurements of proton scattering from 114,116,118,120,122,124Sn have been reported for many energies and most recently at an energy of MeV Takeda et al. (2003); Terashima et al. (2003). Using a relativistic impulse approximation with model (sum of Gaussians) matter densities, analyses Terashima et al. (2003) of the 295 MeV (preliminary) data indicated Terashima et al. (2003) that the isotopes from mass 120 on had a noticeable effect from neutron occupancies of the shell. Their analyses also indicated that scattering data revealed a gradual change in neutron densities as the mass of the isotope increased. Matching the data needed inclusion of nuclear medium effects on the () coupling constants and exchanged meson masses altering them from those of free scattering. Not only are those data preliminary, but the energy is on the high side of the range for which we are confident that our current non-relativistic, -folding method of defining optical potentials microscopically is valid. Notably we believe that the method by which we define effective interactions at and above 295 MeV may need correction. Thus we have made calculations of scattering of protons from many Sn isotopes at lower energies using the program DWBA98 Raynal (1998) that forms -folding optical potentials Amos et al. (2000). The same program then solves the associated nonlocal Schrödinger equations. Specifically we have calculated cross sections for the scattering of all the even mass isotopes 100-176Sn from hydrogen at an energy of MeV. The relevant optical potentials were formed by folding realistic effective interactions with the details of densities of those nuclei given by the mean-field models of their structure. With optical potentials so formed previously, differential cross sections and spin observables for proton scattering (and at 200 MeV specifically) from diverse targets ranging from 3He to 238U have been predicted and found to agree very well with data; providing that the structure with which the effective interactions are folded is appropriate. The effective interactions were determined from matrices [solutions of Bruckner-Bethe-Goldstone (BBG) equations for nuclear matter] found from realistic free forces. Details of the specifications of those effective interactions, of the folding process that gives the optical potential, and of the successful predictions of differential cross sections and analyzing powers from the scattering of protons at diverse energies and from diverse mass targets, have been summarized before Amos et al. (2000) and so are not repeated herein. However of note is that with confidence in the chosen effective interactions and in the applicability of the -folding method, the evaluations when compared with data serve as a test of the putative model structures. Hence a prime purpose of these studies has been to note characteristics in scattering predictions linked to isotope change in the Sn nuclei if they are described appropriately by the Hartree-Fock-Bogoliubov model with a Skyrme interaction. Of course, only access to appropriate data will allow any critique on the specific mean-field structures of the Sn isotopes.
In the next section, we outline the structure models used in our scattering calculations and present details of the resulting proton and neutron matter distributions. In Section IV we show the results found using those structures and an established effective force in nuclear matter in generating -folding optical potentials for a wide range of Sn isotopes scattering from hydrogen. An energy of MeV has been used. In Section V application of structure and scattering models is made for a number of cases for which proton elastic scattering data are available. Conclusions are presented in Section VI.
II Models of structure of the Sn isotopes
In the present study, the properties of even-even Sn isotopes (masses 100 to 176) are described using the spherical mean-field Hartree-Fock-Bruckner model Ring and Schuck (1980). Two Skyrme interactions have been used. As details of the method have been given in detail elsewhere Dobaczewski et al. (1984, 1996, 2001), only features pertaining to the particular calculations made and used herein are given. We have used two parameterizations of the Skyrme force, SkP Dobaczewski et al. (1984) and SLy4 Chabanat et al. (1997), which, in the past, have given appropriate descriptions of bulk nuclear properties. They differ by the input values of the nuclear-matter effective mass, being and 0.7 respectively. The zero-range density-dependent pairing force was used in the particle-particle channel and with the form that is intermediate between volume and surface attraction Dobaczewski et al. (2001). A large positive energy phase space of 60 MeV was taken for which the pairing-force strengths of and MeV fm-3 were obtained in the SkP and SLy4 cases respectively. Those strengths result from using a standard adjustment Dobaczewski et al. (1995) of the neutron pairing gap in 120Sn.
Both model structures give good agreement with the two-neutron separation energies and neutron pairing gaps extracted from data from even mass Sn isotopes having neutron numbers between the magic numbers and . At the magic numbers, the calculated gaps vanish due to the known effect of an unphysical, too sudden, pairing phase transition. The size of the jump of at is slightly underestimated (overestimated) by the SkP (SLy4) model. That is an effect of the different values of the effective mass. Nevertheless, the overall quality of agreement between theory and experiment suffices for us to consider the two models to be useful for extrapolations to describe unknown heavy Sn isotopes. Within the two models, the heaviest two-neutron-bound isotope is predicted to be mass 172(174) for SkP(Sly4).
Spatial properties of neutron and proton density distributions are of special interest in a number of contexts. In the form of one body density matrix elements (OBDME) and the nucleon SP wave functions, they are central aspects of a predictive method of calculating their scattering from Hydrogen targets. Of course, geometric aspects of nuclei, and of the Sn isotopes in particular, have been found in various ways the past Mizutori et al. (2000). Often they have been defined by using the Helm model and the locations of maxima and minima of associated form factors. Also bulk density values sometimes have assessed from averaging density functions from the structure models. Therefore care need be exercised in equating radii and other bulk properties of the same nucleus from different studies to ensure that they do refer to the same quantity. Trends of geometries with mass may be equated nonetheless.
With increasing number of neutrons, from past Mizutori et al. (2000) as well as these studies, the neutron and proton radii of the Sn isotopes increase at different rates with the neutron radii increasing the faster. As a result there is a gradual increase in the size of the neutron skin; an increase that is almost linear with neutron number. At the same time the neutron and proton bulk densities increase and decrease, respectively. The balance between the bulk and surface increase of the neutron distribution is governed by the volume and surface attractions between neutrons and protons and hence is fixed by the principal features of the volume and surface terms in nuclear masses. That is evident from the actual density profiles deduced from the shell occupancies and associated canonical wave functions of the mean-field model results. Such complete density distributions for all of the even mass Sn isotopes resulting from the SLy4 and SkP models of their structure are so shown in Figs. 1 through 4. The normalization of the neutron densities we show is
| (1) |
There is a similar form for the protons.
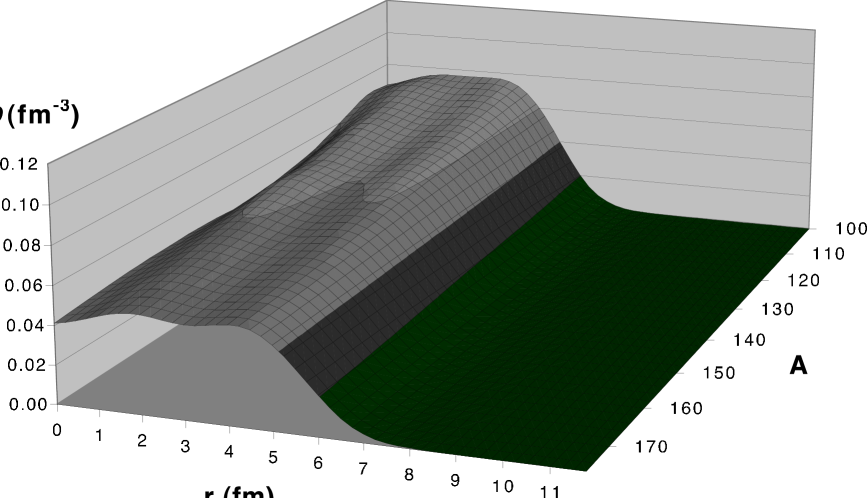
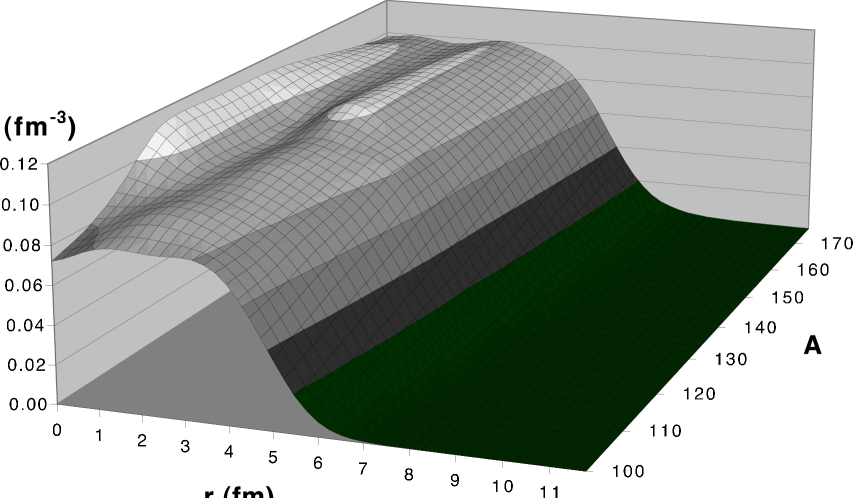
Using the SLy4 force, the proton and neutron matter distributions for all even mass Sn isotopes resulting from the mean-field calculations are displayed in Figs. 1 and 2 respectively. The proton (neutron) distributions are plotted with nuclear mass decreasing (increasing) into the page. By that means the variations to those densities are best portrayed in block form. In these figures we display lines of equal radii and use different shadings to designate regions over which the density changes by 0.02 fm-3. The proton number of course is fixed at 50 and so as the neutron number increases, and concomitantly the neutron volume increases, those 50 protons extend over an increasing volume. As noted above that is due to the strong attractive neutron-proton interactions. In concert, the central charge density must, and does, decrease. However, and as will be seen more clearly in Fig. 3 below, the charge distributions do not become significantly more diffuse. The prime effect is the increase in the charge volume.
The neutron densities structure variation with increasing mass is quite different from that of the protons. Such is not unexpected as the proton number is fixed at 50 with the neutron number increasing to give the mass range. The general trend that the neutron rms radii increase is evident as the half central density is reached at radii ranging from fm in 100Sn to fm for 170Sn. The increase of the neutron surface diffuseness is observed readily in this figure by noting the changes along the lines of fixed radius. We note also that a strong oscillation develops in the central density, which on average also increases from neutrons/fm3 in 100Sn to neutrons/fm3 for 170Sn.
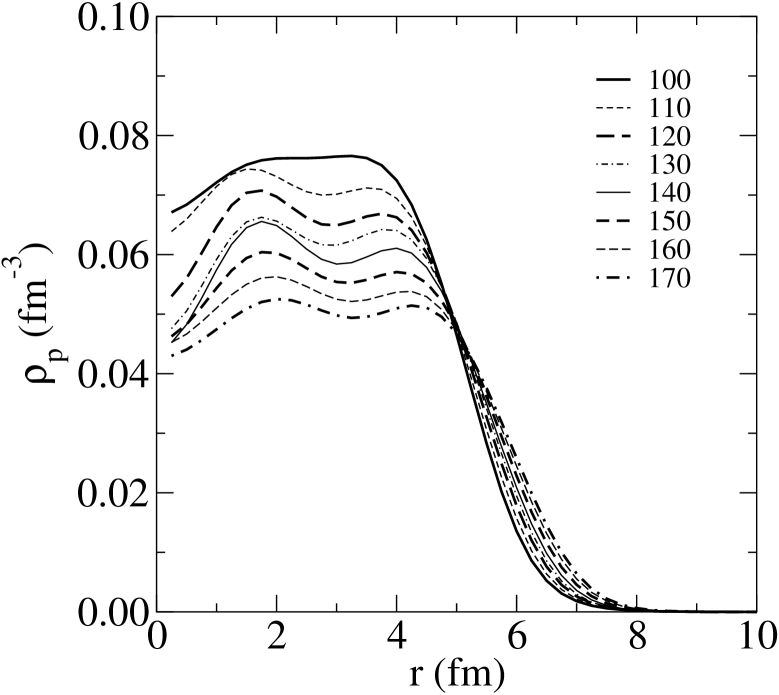
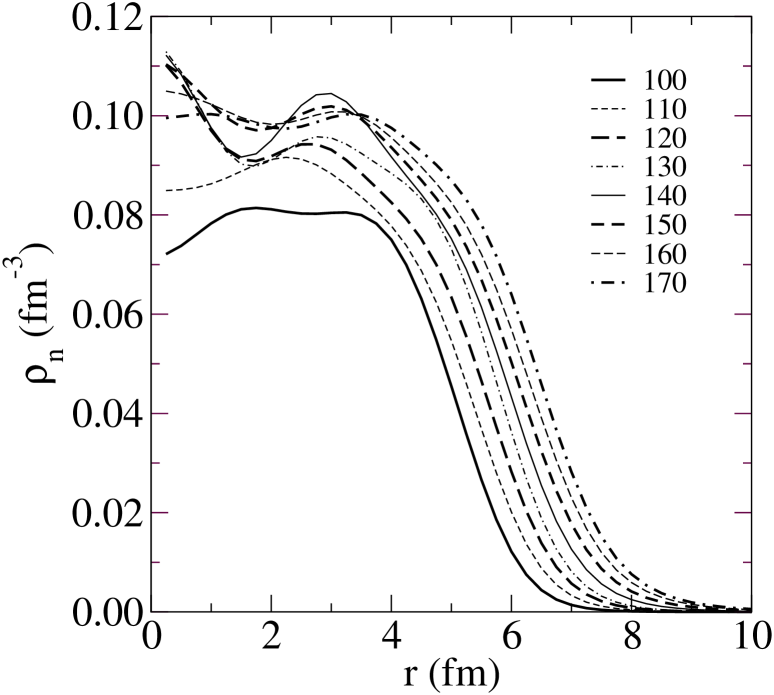
The mass variations of densities are evident also in Figs. 3 and 4 wherein the proton and neutron densities respectively for the Sn isotopes calculated using the SkP model are given for a select set of 8 nuclei having masses spaced evenly between 100 and 170. With the SLy4 force the mass trends are very similar with differences occurring in fine details.
While a few of these densities have been depicted before Mizutori et al. (2000) not only do we extend the set to a wider mass range and fill in previous gaps but we highlight features that should most readily relate to effects in predictions of scattering. In Fig. 3 it is evident that the 50 protons are rearranged to be more extensive as one increases mass. Note that the half-density radius ranges from fm for 100Sn to fm in 170Sn. However the proton surface diffuseness remains essentially unchanged. The distance over which the charge density falls from 90% to 10% of its central value is fm in all nuclei. That is also the case for the neutron distributions. There is a gradual development of a neutron skin to the Sn isotopes, for while with 100Sn the 50 protons and 50 neutrons have essentially the same distribution (solid dark lines in the figures), the two density profiles are somewhat disparate in 170Sn. Not only does the neutron central density increase by from its value in 100Sn while the proton central density value decreases by , but the skin, in this case , varies from 0 to fm as noted previously from the definition in the Helm model characterization Mizutori et al. (2000).
It is of note also that the neutron density profiles have a mass variation through the inner region ( 4 fm) that is not as smooth a progression as that in the outer radial region (beyond 4 fm). Those changes in shape for masses in the vicinity of 150 we expect to reflect as variations in cross section properties for momentum transfer values 1 to 2 fm-1 (at least for 200 MeV scattering) as such did for analyses of data from 200 MeV proton scattering from 208Pb Karataglidis et al. (2002).
III Mass variation of single particle level properties
III.1 The protons in the Sn isotopes
To a very high degree, the SLy4 and SkP models give the same closed orbit proton configuration for the 50 protons in all of the Sn isotopes, i.e.
| (2) |
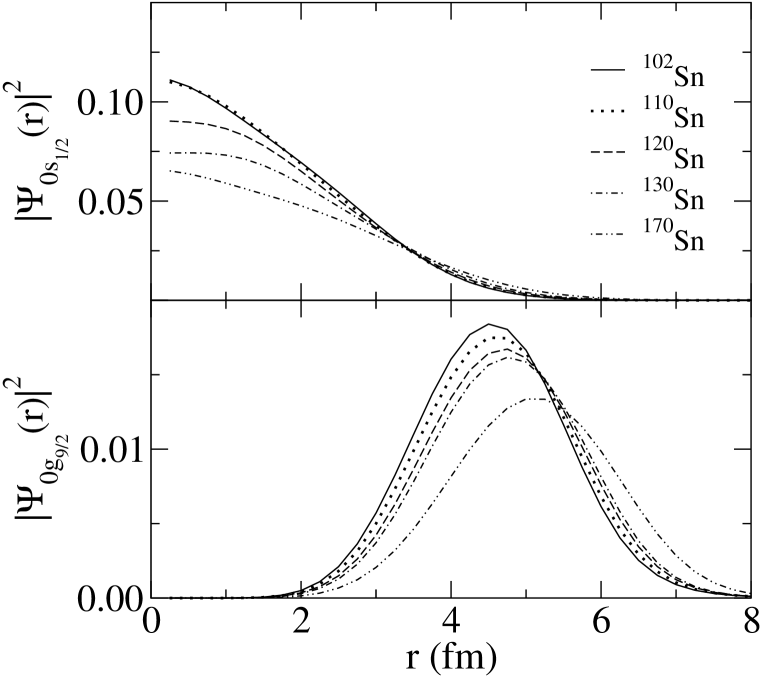
However, the associated single proton wave functions vary with the mass of the isotope reflecting the expected expansion of the charge density as the neutron numbers, and in concert the nuclear skin, increases. That variation is depicted in Fig. 5. Therein are shown the changes that occur over the mass range in the modulus square of the , the most bound of single particle states, and in that of the orbit, the latter being a dominant element in defining the charge properties near and in the nuclear surface. Clearly these wave functions extend as the neutron number increases, as do those of all of the other occupied orbitals. But since the number of protons is fixed at 50, the charge density then gradually decreases in the nuclear center while at long range that becomes more diffuse. This behavior, which is in stark contrast to that of the neutron density, should be clearly evident if ever longitudinal form factors of these isotopes from electron scattering can be measured.
III.2 The neutrons in the Sn isotopes
Neutron orbit occupancies that result from the SLy4 model calculations are presented in Tables 1, 2, and 3. They give the occupancies for orbits that are partially filled for each isotope of Sn. Orbits that have occupancies for all the nuclei in each table that is less than 0.03 are not listed.
Three of the isotopes have neutron orbits with complete occupancy. They are 100,132,176Sn of which only 176Sn is listed in the tables. The tables segment the mass range of the Sn isotopes with the neutron orbit occupancies for the set 102-130Sn given in Table 1. That ranges between the two isotopes having closed shell occupancies in the SLy4 model. These lighter mass isotopes also have a neutron core basically the same as for the protons [Eq. (2)] though there is a small percentage breaking of full occupancy of the neutron orbit as shown by the first line in Table 1.
| Orbit | 102 | 104 | 106 | 108 | 110 | 112 | 114 | 116 | 118 | 120 | 122 | 124 | 126 | 128 | 130 |
|---|---|---|---|---|---|---|---|---|---|---|---|---|---|---|---|
| 9.95 | 9.93 | 9.92 | 9.91 | 9.90 | 9.91 | 9.92 | 9.93 | 9.94 | 9.94 | 9.95 | 9.96 | 9.96 | 9.97 | 10.0 | |
| 1.65 | 3.21 | 4.44 | 4.97 | 5.22 | 5.39 | 5.54 | 5.66 | 5.75 | 5.82 | 5.86 | 5.89 | 5.92 | 5.95 | 5.97 | |
| 0.03 | 0.07 | 0.13 | 0.26 | 0.42 | 0.62 | 0.86 | 1.14 | 1.43 | 1.65 | 1.78 | 1.86 | 1.91 | 1.94 | 1.97 | |
| 0.06 | 0.11 | 0.18 | 0.32 | 0.49 | 0.71 | 1.01 | 1.45 | 2.07 | 2.73 | 3.22 | 3.52 | 3.70 | 3.82 | 3.92 | |
| 0.21 | 0.49 | 1.04 | 2.05 | 3.27 | 4.48 | 5.58 | 6.44 | 7.01 | 7.35 | 7.55 | 7.68 | 7.78 | 7.86 | 7.93 | |
| 0.07 | 0.14 | 0.23 | 0.39 | 0.56 | 0.73 | 0.92 | 1.19 | 1.62 | 2.31 | 3.41 | 4.86 | 6.51 | 8.27 | 10.1 | |
| 0.02 | 0.02 | 0.03 | 0.04 | 0.04 | 0.05 | 0.05 | 0.05 | 0.05 | 0.05 | 0.05 | 0.05 | 0.04 | 0.03 | ||
| 0.01 | 0.02 | 0.02 | 0.03 | 0.03 | 0.04 | 0.04 | 0.04 | 0.04 | 0.05 | 0.05 | 0.05 | 0.04 | 0.03 | ||
| 0.01 | 0.02 | 0.02 | 0.03 | 0.04 | 0.04 | 0.04 | 0.04 | 0.04 | 0.05 | 0.05 | 0.05 | 0.04 | 0.03 |
As neutrons are added pairwise to 100Sn to reach mass 110, this model suggests that they primarily occupy the orbit with some partial occupancy of both the and orbits. As mass then increases to reach 120Sn, the latter two orbits increase in occupancy to 80-90% while the and orbits fill to 68% and 20% closure respectively and at approximately the same rate. With the set of isotopes 122-132Sn, the major effect is in the filling of the orbit. Higher shell states for all of these isotopes account for less than a percent of the neutron numbers. Of importance however, is that, with the SLy4 model, filling of the four important valence orbits is far from that one would guess with the simplest of shell schemes.
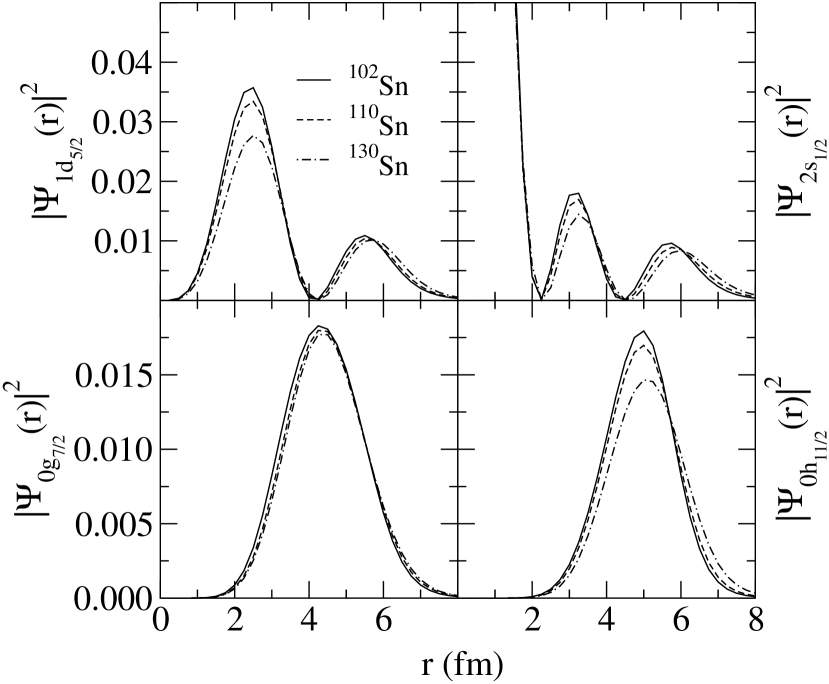
But once again the valence orbitals vary as the mass increases. That variation is illustrated in Fig. 6 where the four important valence orbital single particle densities are shown for three isotopes, 102,110.130Sn. In this case we display just the changes wrought between 102-130Sn since for this range of nuclei essentially those four orbits are being filled with neutrons. Across this range of isotopes each valence orbit gradually extends in space. The related neutron densities then increase in size as neutrons are added to form a neutron skin. But such a skin is not due simply to an increase in neutron occupancy of orbits with high angular momentum. Each orbit’s extension as the mass increases plays a role.
In Tables 2 and 3 respectively, the extra core neutron orbit occupancies for the isotopes 134-158Sn and 160-176Sn are given. For all of those isotopes the neutron core essentially has 62 neutrons. The 12 neutrons extra to the 50 in the configuration of Eq. (2) closes the - shell.
| Orbit | 134 | 136 | 138 | 140 | 142 | 144 | 146 | 148 | 150 | 152 | 154 | 156 | 158 |
|---|---|---|---|---|---|---|---|---|---|---|---|---|---|
| 8.00 | 8.00 | 8.00 | 8.00 | 8.00 | 7.98 | 7.97 | 7.97 | 7.97 | 7.97 | 7.97 | 7.97 | 7.97 | |
| 11.96 | 11.95 | 11.96 | 11.98 | 11.93 | 11.90 | 11.89 | 11.88 | 11.87 | 11.87 | 11.88 | 11.88 | 11.89 | |
| 1.82 | 3.67 | 5.57 | 7.62 | 7.98 | 7.40 | 7.41 | 7.44 | 7.47 | 7.52 | 7.57 | 7.62 | 7.67 | |
| 0.07 | 0.14 | 0.17 | 0.15 | 0.97 | 1.78 | 2.63 | 3.51 | 4.40 | 5.28 | 6.12 | 6.88 | 7.56 | |
| 0.05 | 0.09 | 0.11 | 0.07 | 0.37 | 0.63 | 0.88 | 1.13 | 1.39 | 1.66 | 1.96 | 2.31 | 2.71 | |
| 0.04 | 0.07 | 0.08 | 0.06 | 0.35 | 0.63 | 0.92 | 1.23 | 1.56 | 1.94 | 2.35 | 2.81 | 3.31 | |
| 0.03 | 0.05 | 0.07 | 0.09 | 0.73 | 1.31 | 1.80 | 2.19 | 2.51 | 2.77 | 3.00 | 3.19 | 3.36 | |
| 0.01 | 0.02 | 0.02 | 0.10 | 0.19 | 0.28 | 0.38 | 0.50 | 0.63 | 0.77 | 0.93 | 1.11 | ||
| 0.01 | 0.01 | 0.03 | 0.03 | 0.04 | 0.05 | 0.06 | 0.07 | 0.08 | 0.09 | 0.09 | 0.10 | ||
| 0.01 | 0.01 | 0.03 | 0.03 | 0.04 | 0.05 | 0.06 | 0.07 | 0.08 | 0.08 | 0.08 | 0.08 | ||
| 0.02 | 0.03 | 0.04 | 0.05 | 0.06 | 0.06 | 0.07 | 0.07 | 0.07 | |||||
| 0.01 | 0.02 | 0.02 | 0.02 | 0.02 | 0.02 | 0.03 | 0.03 | ||||||
| 0.01 | 0.02 | 0.02 | 0.03 | 0.03 | 0.03 | 0.03 | 0.03 | ||||||
| 0.01 | 0.02 | 0.02 | 0.02 | 0.02 | 0.03 | 0.03 | 0.03 |
The Sly4 model neutron orbit occupancies for the isotopes 134-158Sn given in Table 2 reveal that the and orbits are almost fully occupied. Thus in adding neutrons to reach 142Sn, those neutrons almost all go into the orbit, almost filling it completely. As neutrons are added thereafter, that orbit occupancy decreases slightly before slowly regaining to almost full occupancy in 160Sn. Further, in changing from mass 144 to mass 162, the other orbits increase in occupancy, more or less at the same rate to result in 90% full for the and orbits, 70% full for the and orbits, and 30% occupation for the orbit. Higher shells to these again account for less than 1% of the neutron numbers.
As before, as one moves across this range of isotopes, the individual orbit wave functions for the neutrons become more extended. That is shown in Fig. 7 wherein four (valence) orbit functions for 134,144,150,158Sn are displayed.
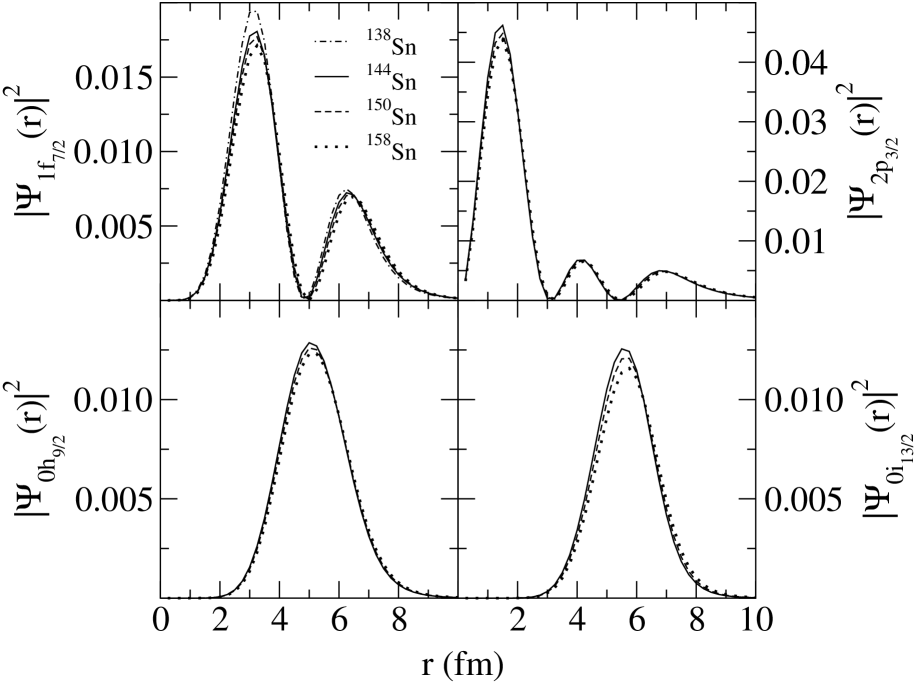
For 138Sn, only the wave function is shown (by the dot-dashed curve) since that is the only valence orbit of the four in that nucleus with a substantial neutron occupancy. However, for all four orbitals, the wave functions determined from the SLy4 calculations are portrayed by the solid, dashed, and dotted curves for 144Sn, 150Sn, and 158Sn respectively. Again these valence orbit wave functions extend to larger radii as the isotope mass increases, but now not as markedly as for the protons or neutron orbits for the lighter mass isotopes. It follows then that the build up of neutron density at the nuclear surface is more influenced now by the increasing occupancies of these orbits.
| Orbit | 160 | 162 | 164 | 166 | 168 | 170 | 172 | 174 | 176 |
|---|---|---|---|---|---|---|---|---|---|
| 7.97 | 7.98 | 7.98 | 7.98 | 7.98 | 8.00 | 8.00 | 8.00 | 8.00 | |
| 11.90 | 11.91 | 11.92 | 11.93 | 11.94 | 11.96 | 11.97 | 11.98 | 12.00 | |
| 7.72 | 7.77 | 7.81 | 7.84 | 5.36 | 7.91 | 7.94 | 7.97 | 8.00 | |
| 8.13 | 8.59 | 8.96 | 9.24 | 9.46 | 9.63 | 9.77 | 9.89 | 10.00 | |
| 3.23 | 3.92 | 4.82 | 5.98 | 7.35 | 8.87 | 10.50 | 12.21 | 14.00 | |
| 3.82 | 4.32 | 4.76 | 5.10 | 5.36 | 5.56 | 5.72 | 5.87 | 6.00 | |
| 3.50 | 3.62 | 3.71 | 3.78 | 3.84 | 3.88 | 3.92 | 3.96 | 4.00 | |
| 1.30 | 1.48 | 1.61 | 1.73 | 1.81 | 1.87 | 1.92 | 1.96 | 2.00 | |
| 0.10 | 0.10 | 0.10 | 0.10 | 0.10 | 0.09 | 0.07 | 0.04 | — | |
| 0.08 | 0.08 | 0.08 | 0.08 | 0.08 | 0.07 | 0.05 | 0.03 | — | |
| 0.07 | 0.07 | 0.07 | 0.07 | 0.07 | 0.06 | 0.05 | 0.03 | — | |
| 0.03 | 0.03 | 0.02 | 0.02 | 0.02 | 0.02 | 0.02 | — | — | |
| 0.03 | 0.03 | 0.03 | 0.03 | 0.03 | 0.02 | 0.02 | 0.01 | — | |
| 0.03 | 0.03 | 0.02 | 0.02 | 0.02 | 0.02 | 0.01 | — | — |
The neutron orbit occupancies given by the SLy4 model for the heaviest Sn isotopes, masses 160 to 176, are given in Table 3. Those trend to a complete shell occupancy for 176Sn. The most obvious change in occupancy over this set of nuclei is that of the orbit (from 3.23 to 14 neutrons). Again the higher orbits are sparsely occupied, and in fact any such occupancy decreases until 176Sn adopts the closed shell character.
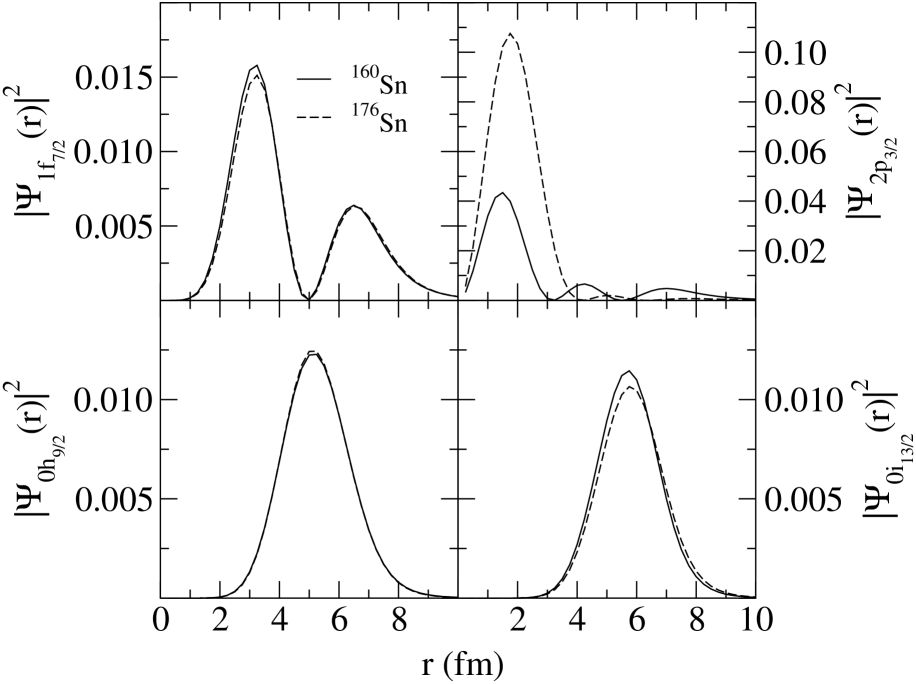
The wave functions for the valence orbitals of importance for the heaviest Sn isotopes are displayed in Fig. 8 where the solid curve are the functions specified for 160Sn and the dashed curves show those for 176Sn.
IV Scattering from Hydrogen – gedanken results
We have used the canonical SP wave functions for all of the Sn isotopes to fold an effective interaction and thus generate optical potentials for use in modified versions of the scattering program DWBA98 Raynal (1998). Those optical potentials are complex and non-local since they can be written in coordinate space with , as
| (3) |
where the direct and non-local exchange terms are
| (4) |
Here and are combinations of the components of the effective interactions, are ground state OBDME, and are nucleon SP states. The OBDME are represented as bound state shell occupancies. All details and the prescription of solution of the associated nonlocal Schrödinger equations are given in the recent review Amos et al. (2000). The results to be discussed herein have been obtained by solving the actual nonlocal Schrödinger equations defined with potentials as given by Eq. (3). For the present calculations, the effective interactions have been defined by their mapping to the BBG matrices of the BonnB interaction Machleidt et al. (1987).
We consider the elastic scattering of 200 MeV protons from each of the even mass Sn isotopes ( to 176). By inverse kinematics the cross sections we determine are also those for the scattering of MeV Sn ions from hydrogen; some of which can be, or may soon be, obtained in sufficient numbers to form a radioactive ion beam for experiment. The choice of 200 MeV was made, not only because the effective force at this energy has been used in many successful predictions of actual scattering data from stable nuclei Amos et al. (2000) but also data at that energy from 208Pb gave a clear signature of its neutron density profile Karataglidis et al. (2002).
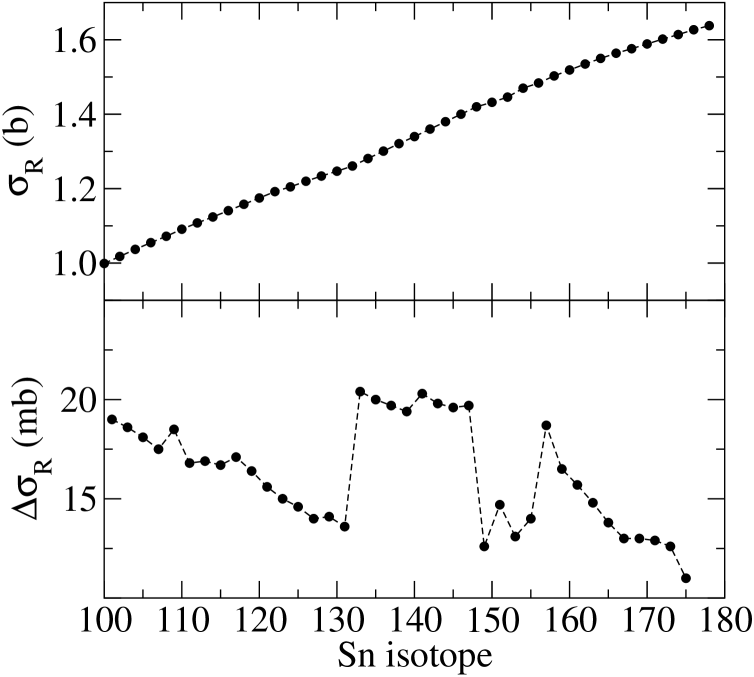
Possibly first measurements with such exotic nuclear projectiles may be of the total reaction cross sections and the SLy4 model predictions for those are shown in the top panel of Fig 9. There is a distinct a mass trend in those results so that total reaction cross section gradually increases with isotope mass from 1 b to 1.63 b for 170Sn. The sums that define the reaction cross sections are dominated by the large partial wave scattering amplitudes Deb and Amos (2002). Also, at much higher energies, those sums are known to equate to the geometric cross section for each nucleus. So reaction cross section values reflect a bulk character of the structure of each nucleus and values of the total reaction cross sections may then be the first obvious evidence of the propriety of any chosen model for the structure of the isotopes. If any such can be measured accurately the differences also may then be a first test of the structure models since, as portrayed in the bottom segment of Fig. 9, there is a noticeable variation of many mb predicted when the SLy4 model structures are used in calculations of the scattering of 200 MeV protons. Notably that the differences show a trend to smaller values with increasing mass save for a “quantum” jump when the neutron number is 82 and for some uniqueness with masses 150 to 156. But any such clear variation will require an accuracy of measurement of a percent or two. Nonetheless the actual value first, and the trend of differences second, may signify propriety of the structures chosen to describe the isotopes.
There appears to be little difference between the cross sections found using the SkP and the SLy4 forces to give the ground state structures. This is shown for a select set of Sn isotopes in Fig. 10.
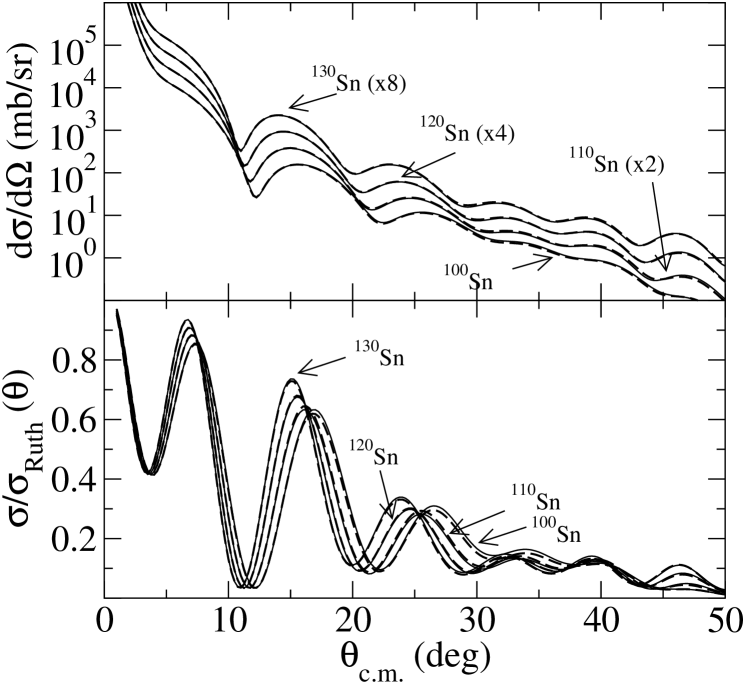
The differential cross sections for 200 MeV proton scattering from 100,110,120,130Sn are shown in the top panel with each scaled by factors of 1, 2, 4, and 8 to distinguish them from one another more clearly. The ratio to Rutherford scattering for these same nuclei and at 200 MeV are displayed in the bottom panel of this figure. The solid (dashed) curves were obtained by using the structure found with the SkP (SLy4) force. On this scale there is little to distinguish between the alternate model results. But the two structure models do predict cross sections that differ in detail and such is shown in Fig. 11 for the set of isotopes 100,110,120,130,140,150,160Sn. Therein the percentage difference,
| (5) |
is plotted for each nucleus as identified.
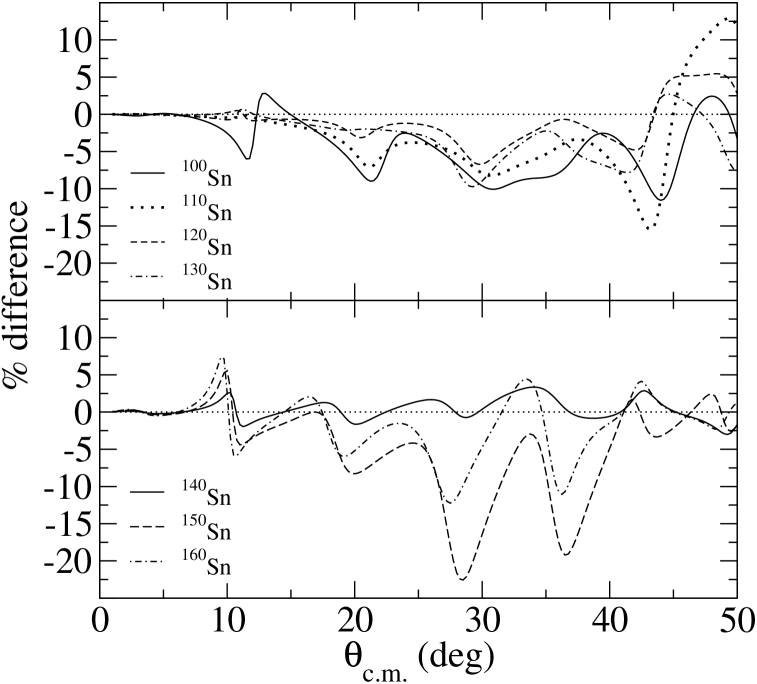
Differences can be large (20%) as with 150Sn coinciding with cross section magnitudes of a few mb/sr at scattering angles . That coincides with momentum transfer values of to 2 fm-1 and are values which might be distinguished by measurement. In the main however, the model differences characteristically are 5 to 10 %, so that at scattering angles of 20∘ where predicted cross sections (for 200 MeV) are about 20 mb/sr, the difference between the model predictions would be about a mb/sr. For larger angle results, where the cross section magnitude is of the order of a mb/sr the differences, mb/sr may not exceed experimental uncertainties. Nonetheless there is a progression in these cross section differences found using the sets of matter densities given by the SkP and SLy4 structure models as one increases the isotope mass and when compared with data, such might suggest preference for one model of structure over the other; presupposing of course that one is indeed a better description of reality. To illustrate this further, in Fig. 12 we show the cross section values at 30∘ and 40∘ scattering that result from using the SLy4 structure model to form -folding optical potentials. The momentum transfers for these scattering angles are and fm-1 respectively. At these momentum transfer values, clearly the variation of the structure details with mass have noticeable effect. There is some evidence for a more packed neutron distribution in the structures at neutron number 82 and some evidence of surface orbit variations with neutron numbers 100, 102, and 104. The latter, however, may simply be an idiosyncrasy of the model calculations. Thus, and as found in a study of scattering from 208Pb Karataglidis et al. (2002), the neutron distribution through the nuclear surface in particular, reflects strongly in the calculated values for elastic scattering cross sections for momentum transfers 1 to 3 fm-1 with cross section values mb/sr.
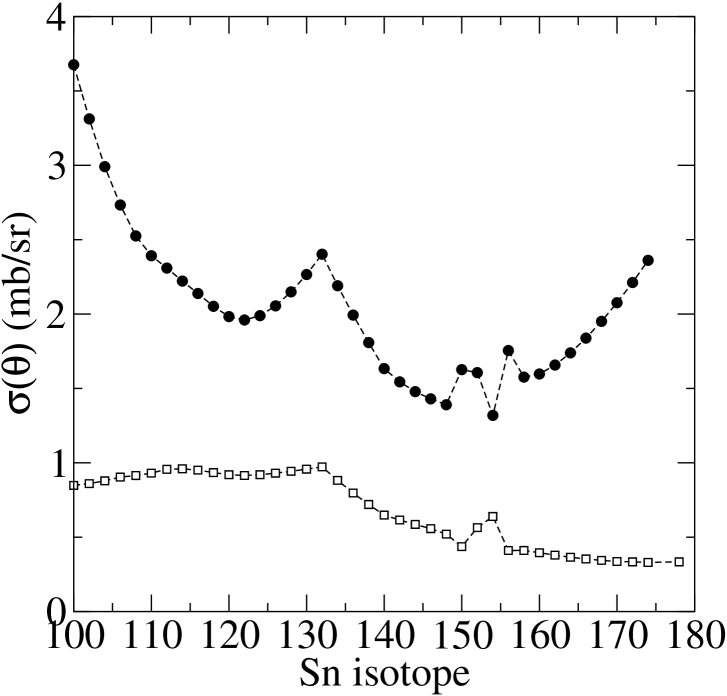
Other properties of the cross sections reflect possible measurable trends. In Fig. 13 diverse variations with mass in the entire set of isotopes are shown. Such are quantities from scattering having analogies with the bulk nuclear properties determined previously from the mean-field matter densities Mizutori et al. (2000).
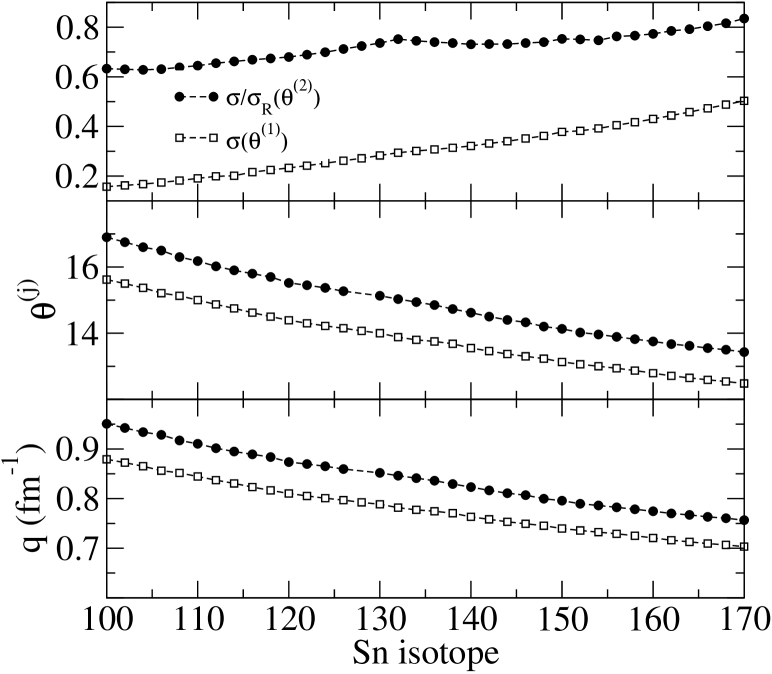
In the top panel the variations with mass of magnitudes of select (low momentum) peaks in the calculated cross sections are shown. The first obvious peak in the differential cross section is displayed by the filled circles. That changes markedly as one progresses from proton to neutron drip lines, from the value of mb/sr for 100Sn to a value of mb/sr for 170Sn as shown and on to mb/sr for 176Sn. As with the total reaction cross section results this variation would be a measurable effect in future scattering experiments, and one that may be an easier characteristic to define than the higher momentum properties we described earlier. The -axis in this case is to be read as b/sr. In the top panel we also display the values of the ratio to Rutherford cross sections found at the scattering angles corresponding to the second peak in those ratios. They are portrayed by the opaque squares with the y-axis now in dimensionless units. Again there is a smooth measurable effect with mass, both in the magnitude of that second ratio to Rutherford peak as well as with the angles at which that peak occurs. We have designated these trends as low momentum properties as specified by the prescriptions. The particular values involved are shown in the middle and bottom panels of this figure. In the middle panel the center of mass scattering angles at which the differential cross sections have their first definite peak are shown by the filled circles while those at which the ratio to Rutherford cross sections have their second peak are displayed once again by the opaque squares. With increasing mass, and for all the isotopes, the first prominent peak of the differential cross sections move inward to smaller values of momentum transfer. Over the entire range, the momentum transfer value at which the first peak occurs changes from 0.88 fm-1 in 100Sn to 0.7 fm-1 in 170Sn.
V Comparison with data
There have been many experimental studies of proton scattering from Sn isotopes. Our literature search on those gave the listing as shown in Table 4. The proton energy was restricted to the range 16 to 200 MeV; a range for which we felt most comfortable about using the -folding method of defining optical potentials, and for which range we are confident about the effective interactions we have defined Amos et al. (2000).
| Energy | Isotopes | References |
| 16.0 | 116, 120, 124 | Boyd et al. (1971), Mani et al. (1971), Abbott et al. (1987) |
| 20.4 | 116, 118, 120, 122, 124 | Wassenaar et al. (1989) |
| 24.5 | 116, 118, 120, 124 | Tarats et al. (1981), Pingzhi (1985), Wassenaar et al. (1989) |
| 30.3 | 112, 114, 116, 118, 120, 122, 124 | Craig et al. (1964), Greenlees et al. (1970), Hnidzo and Lowe (1971), Hardacre et al. (1971), Manweiler (1975) |
| 39.6 | 116, 118, 120, 122, 124 | Fricke et al. (1967), Boyd and Greenlees (1968), Haensel (1975) |
| 49.35 | 112, 114, 118, 120, 124 | Mani et al. (1971) |
| 61.4 - 65 | 118, 120 | Fulmer et al. (1969), Hachenburg et al. (1980), Ma et al. (1988) |
| 100.0 - 104.0 | 120 | Haensel (1975), Kwiatowski and Wall (1978), Schwandt et al. (1982), Kailas et al. (1984) |
| 133.8 | 116 | van der Werf et al. (1987) |
| 156.0 - 160.0 | 116, 118, 120 | Comparat et al. (1974), Sarker et al. (2002) |
| 200 | 120 | Kaki and Toki (2001) |
From that list we have chosen for analysis, some of the data taken at 39.8, 49.35, 65.0, and 200.0 MeV. A complete analysis of all of the available data will be made and reported in some fashion subsequently. In all of the figures to be shown, unless otherwise stated, the calculated results were obtained from optical potentials formed by folding a Melbourne effective interaction Amos et al. (2000) for the relevant incident energy, with the OBDME and SP wave functions determined by the SLy4 model of structure for each and every isotope of Sn. The DWBA98 program Raynal (1998) was used to perform the folding and to find solutions of the relevant Schródinger equations.
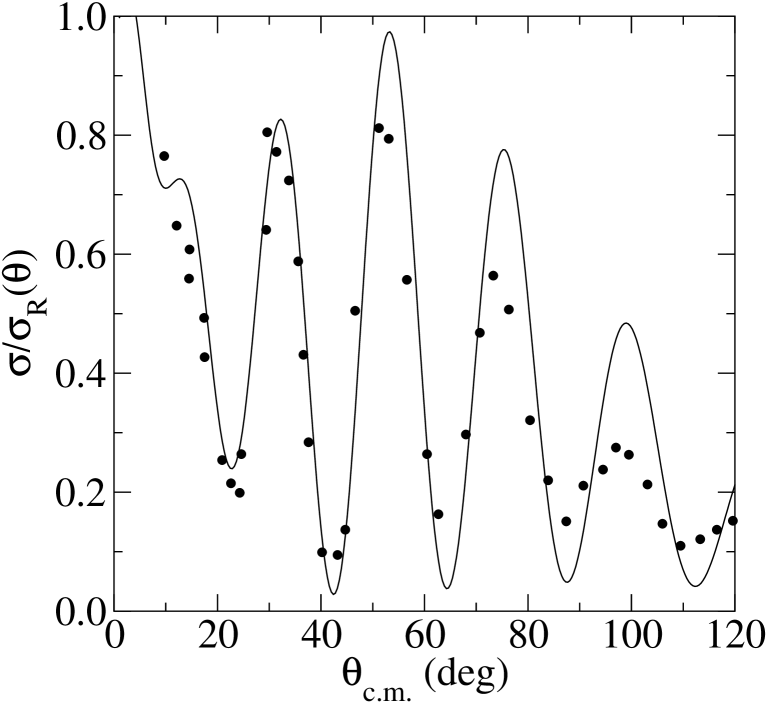
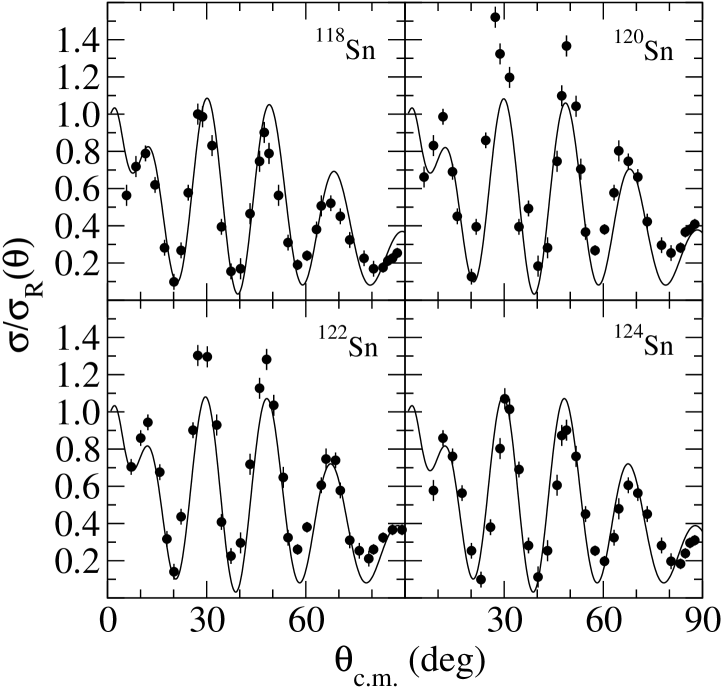
The first result we show is of the scattering of 39.8 MeV protons from 120Sn. In Fig. 14, our calculated cross section as a ratio to Rutherford scattering is compared with data Fricke et al. (1967). Clearly the trend of the data is reproduced by the -folding optical potential calculation and some details are also well matched. Similar quality of matching to data for the set of even mass isotopes, 116-124Sn, is revealed in Fig. 15.
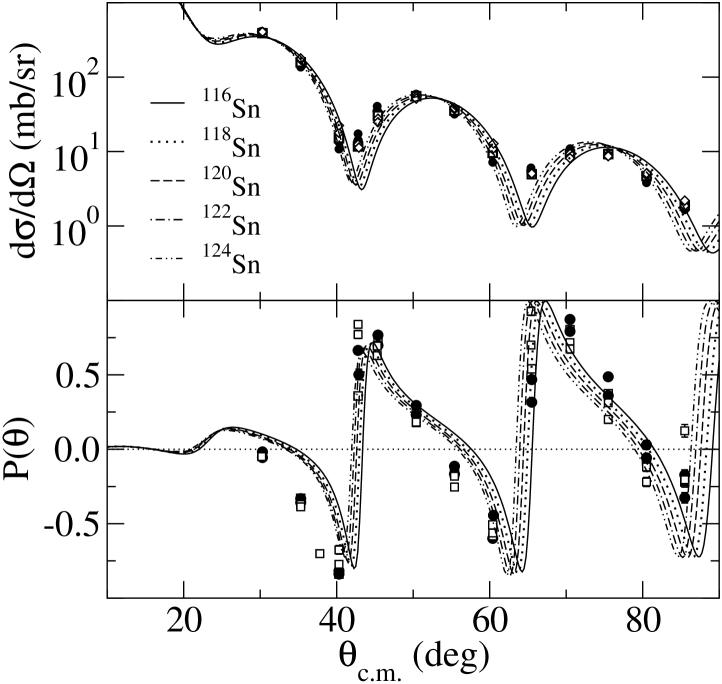
With all data collected in this one figure, and the spread of the calculated values for the five isotopes giving a band of predictions, the trend of data is well reproduced by the predicted values, at least to 90∘. The quality of fit to individual polarizations is presented in Fig. 16.
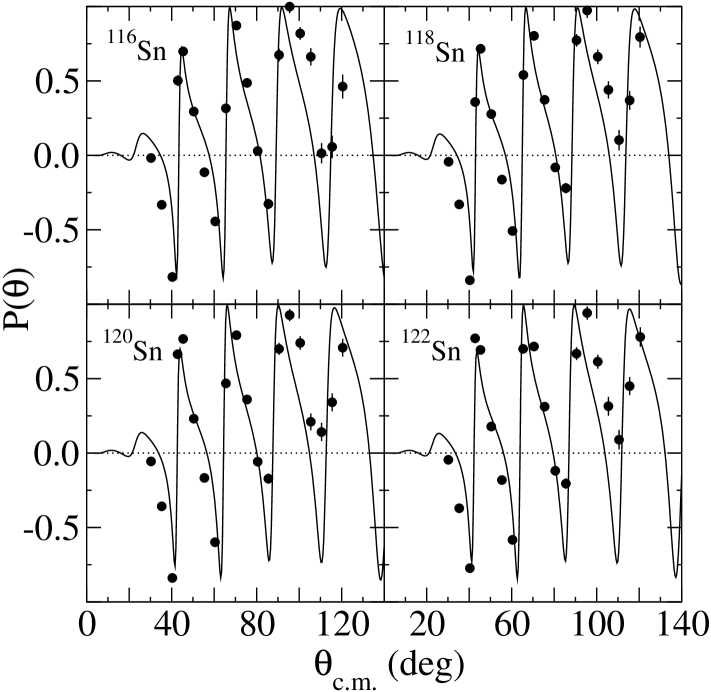
The maxima (positive and negative) values are in good agreement with the characteristic shapes between the sharp rises in values (from negative to positive) being predicted. The variations between data and calculated values are not great and it seems within the realm of possibility that small changes to the chosen structure model can improve the agreement. Such is also the conclusion we may draw from the comparison of results with data taken at 49.3 MeV. Cross sections as ratios to Rutherford are shown in Fig. 17. The data Mani et al. (1971) now display a variation with target mass that is not readily mapped by our calculated results. With 122,124Sn, the peak values of the ratios exceed our predictions by some 30 to 40%. However, the trend of data as well as a number of specific details are well matched and we consider then that the results confirm credibility of the SLy4 structure.
Finally we show results found for the elastic scattering of 65 MeV protons from 118Sn and of 200 MeV protons from 120Sn. At those energies many successful predictions have been made of cross sections for proton scattering from stable nuclei Amos et al. (2000). Included in that set were predictions of scattering from two Sn isotopes of the set considered herein. Those past Sn cross section calculations were made using SP wave functions of HO type determined with an oscillator length given by the rule. So values of 2.215 and 2.221 fm were used as the oscillator lengths for 118Sn and 120Sn respectively. In the following figures, we display cross sections found using those HO model densities by the dot-dashed curves. Those results found using the SLy4 and SkP model densities are shown by the solid and dashed curves respectively.
In Fig. 18 the differential cross sections and analyzing powers for the elastic scattering of 65 MeV protons from 118Sn Yosoi et al. (1985), are compared with our predictions.
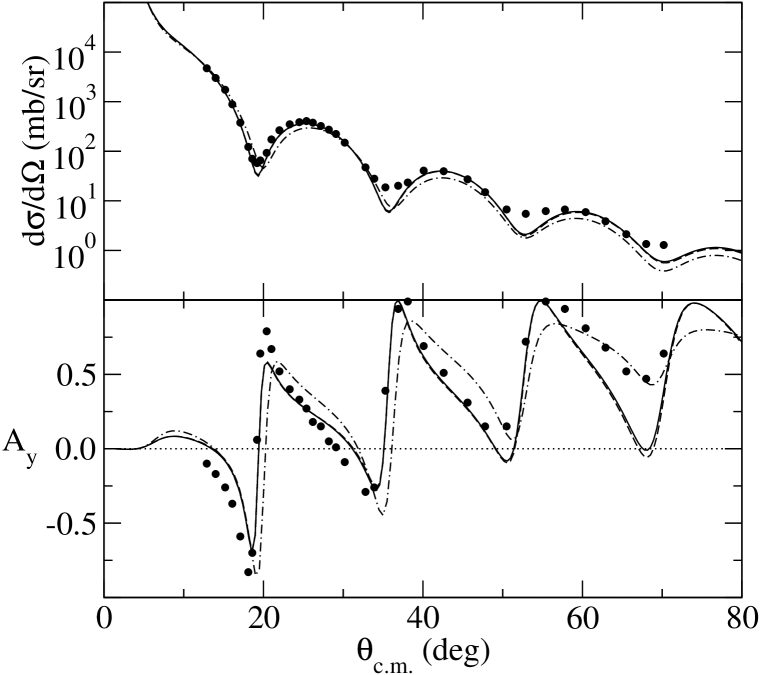
In the case of the differential cross section, there is little difference () between those found using the SLy4 and SkP structures. The calculated results are in good agreement with the structure and magnitude of the data; the SLy4 and SkP model results particularly so. The preference for the SLy4 (SkP) model also is evident with the total reaction cross section. They predict 1.48 b while the HO calculation yields 1.41 b. The measured value Ingemarsson et al. (1999) is b. But it is with the analyzing power at 65 MeV that the SLy4 (SkP) densities give a significantly better result in comparison to the HO model. While the HO result is a fair reproduction of the data structure, the SLy4 (SkP) model result gives not only the correct location of the maxima and minima but also shows the overall trend, seen in the data, of increasingly positive values with increasing angle. They also depict best the marked asymmetric shape of each peak structure of the data.
The 200 MeV scattering results from 120Sn are also quite good, although with the exception of the differential cross section produced using the HO model the reproductions of data obtained with the mean-field model densities are not as good as found at 65 MeV for 118Sn.
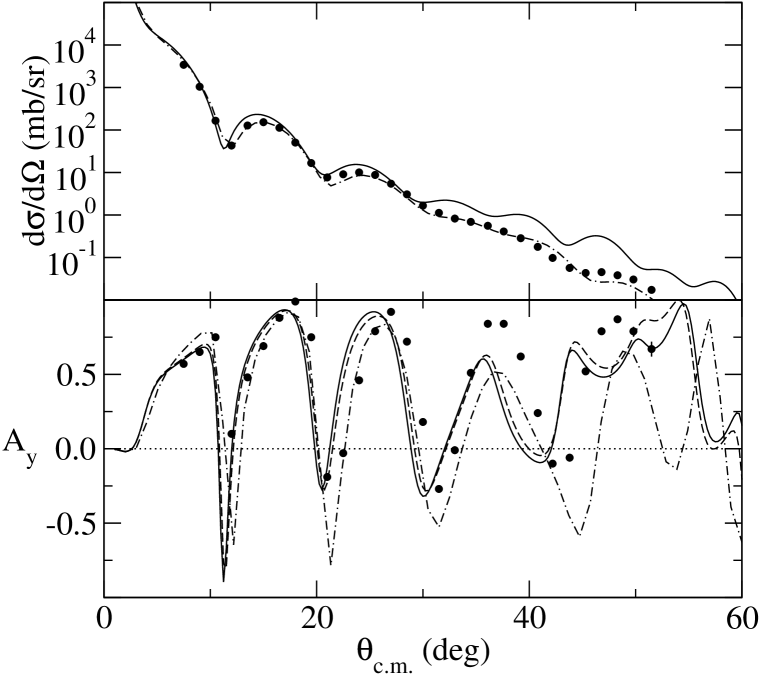
The differential cross sections and analyzing powers are shown in Fig. 19 from which it is clearly evident that the HO model tracks the measured data Sakaguchi et al. (1993) well for all angles shown. The SLy4 model result is not as good, though it agrees with the forward angle () scattering data well enough. The SkP model result is indistinguishable from the SLy4 one on this scale. The actual differences in cross section are less than a percent at most scattering angles. Both the SLy4 and SkP models thus overestimate the cross section and predict some structure not seen in the data for larger scattering angles. Such discrepancies have been seen in other circumstances, notably in a comparative study Karataglidis et al. (2002) of model structures for 208Pb and in identifying 6He and 11Li as nuclei with extended neutron distributions (neutron halos) Lagoyannis et al. (2001); Stepantsov et al. (2002). Further, RIA model results for 200 and 295 MeV scattering Terashima et al. (2003) find likewise predictions that are larger, and have more structure, than the data for scattering angles greater than . It is also of note that the 200 MeV data at scattering angles are smoothly decreasing and so quite unlike the equivalent data at lower energies as well as at 295 MeV Terashima et al. (2003). However, it must be noted that the “problematic” data in this 200 MeV cross section has a magnitude mb/sr; cross section magnitudes for which we have lessened confidence that processes other than inherently considered within the -folding method can be neglected; processes such as may be associated with specific coupled channel for example.
As with the differential cross section results, our predictions for the analyzing powers (shown in the bottom half of Fig. 19) are good but there is room for improvement. The asymmetry seen with the 65 MeV data is less severe at this higher energy but, of course, there are more peaks within the scattering angle range shown. Both features are evident in the HO and SLy4 calculations without the exact angular structures in the data being reproduced. It is notable that the SLy4 and SkP results do match the observed peak magnitudes and valley depths very well and the two densities yield slight but noticeable differences in the spin measurable.
VI Conclusions
We have made predictions of the observables of the elastic scattering of 200 MeV protons from the even-even isotopes of Sn from 100Sn to 176Sn. The model we have used for the structure of the isotopes is a Hartree-Fock-Bogoliubov model using the Skyrme interaction for which two parameterizations have been used. The matter densities obtained from those models show consistent trends. As mass increases from to 176, the neutron central density increases and a neutron skin emerges. Also, as proton number is fixed, the addition of neutrons not only increases the volume but also engenders a dilution of the proton distribution.
The changes in the nucleon densities reflect in the predictions made for the differential cross sections of 200 MeV proton elastic scattering. As neutron number increases, the first three minima tend to lower momentum transfers and the intervening first maximum becomes more pronounced. That effect as the neutron skin becomes more manifest is large enough to be distinguishable in experiment.
For the set of isotopes 116-124Sn cross sections, polarizations and analyzing powers in proton elastic scattering have been measured at various energies. Most of that data compare well with predictions from -folding optical potential calculations when those potentials are defined by folding with the SLy4 model of the structure of the isotopes. However there is little difference between those results and ones obtained by using the SkP model. But both of those models give results that are much better, usually, than those found by using a naive oscillator model of the structure of the isotopes. The fact that there are marked differences between the HO and predictions signifies the value of using proton elastic scattering data in testing model specifications of the ground states of nuclei. The 200 MeV results for the scattering from 120Sn is exceptional. Bearing in mind the effects observed in a recent study Karataglidis et al. (2002) of proton scattering from 208Pb, perhaps the neutron matter distribution through the nuclear surface as determined by either of the calculations needs slight variation.
It is hoped that with the proposed new generation of radioactive beam facilities that data for the elastic scattering of heavy neutron-rich nuclei from hydrogen will be obtained. Despite the close similarity of calculated results for the SLy4 and SkP model prescriptions, the model we have used in obtaining our predictions is sensitive to the major details in the neutron density and serves as an important testing ground for the models being developed to describe exotic nuclei and which inherently give distinctive features such as the neutron rms value.
Acknowledgements.
This work was supported by a grant from the Australian Research Council and by the Polish Committee for Scientific Research (KBN) under Contract No. 5 P03B 014 21. We also gratefully acknowledge the assistance of Mr. Dirk van der Knijff of the Advanced Research Computing group, Information Division, University of Melbourne for use of the high performance computers of that group to find all of the results displayed.References
- Hansen et al. (1995) P. Hansen, A. Jensen, and B. Jonson, Ann. Rev. Nucl. Part. Sci. 45, 591 (1995).
- Roeckl (1992) E. Roeckl, Rep. Prog. Phys. 55, 1661 (1992).
- Mueller and Sherrill (1993) A. Mueller and B. Sherrill, Ann. Rev. Nucl. Part. Sci. 43, 529 (1993).
- Riisager (1994) K. Riisager, Rev. Mod. Phys. 66, 1105 (1994).
- Dobaczewski and Nazarewicz (1998) J. Dobaczewski and W. Nazarewicz, Phil. Trans. Roy. Soc. (London) A 356, 2007 (1998).
- Mizutori et al. (2000) S. Mizutori, J. Dobaczewski, G. Lalazissis, W. Nazarewicz, and P.-G. Reinhard, Phys. Rev. C 61, 044326 (2000).
- Dobaczewski et al. (1994) J. Dobaczewski, I. Hamamoto, W. Nazarewicz, and J. Sheikh, Phys. Rev. Lett. 72, 981 (1994).
- Amos et al. (2000) K. Amos, P. J. Dortmans, H. V. von Geramb, S. Karataglidis, and J. Raynal, Adv. in Nucl. Phys. 25, 275 (2000).
- Karataglidis et al. (2002) S. Karataglidis, K. Amos, B. A. Brown, and P. K. Deb, Phys. Rev. C 65, 044306 (2002).
- Serot and Walecka (1986) B. D. Serot and J. D. Walecka, Adv. in Nucl. Phys. 16, 1 (1986).
- Celenza and Shakin (1986) L. S. Celenza and C. M. Shakin, Relativistic Nuclear Problem (World Scientific, Singapore, 1986).
- Nikolaus et al. (1992) B. A. Nikolaus, T. Hoch, and D. G. Madland, Phys. Rev. C 46, 1757 (1992).
- Ring (1996) P. Ring, Prog. Part. Nucl. Phys. 37, 193 (1996).
- Bürvenich et al. (2002) T. Bürvenich, D. G. Madland, J. A. Maruhn, and P.-G. Reinhard, Phys. Rev. C 65, 044308 (2002).
- Ring and Schuck (1980) P. Ring and P. Schuck, The Nuclear Many-Body Problem (Springer-Verlag, Berlin, 1980).
- Brown (2000) B. A. Brown, Phys. Rev. Lett. 85, 5296 (2000).
- Dobaczewski et al. (2001) J. Dobaczewski, W. Nazarewicz, and P.-G. Reinhard, Nucl. Phys. A693, 361 (2001).
- Bender et al. (2003) M. Bender, P.-H. Heenen, and P.-G. Reinhard, Rev. Mod. Phys. 75, 121 (2003).
- Clark et al. (2003) B. C. Clark, L. J. Kerr, and S. Hama, Phys. Rev. C 67, 54605 (2003).
- Deb et al. (2001) P. K. Deb, K. Amos, S. Karataglidis, M. B. Chadwick, and D. G. Madland, Phys. Rev. Lett. 86, 3248 (2001).
- Takeda et al. (2003) H. Takeda et al., in Proceedings of the Kyudai-RCNP international symposium; Nuclear Many-Body and Medium Effects in Nuclear Interactions and Reactions, edited by K. Hatanaka, T. Noro, K. Sagara, H. Sakaguchi, and H. Sakai (World Scientific, Fukuoka, Japan, 2003), p. 269.
- Terashima et al. (2003) T. Terashima et al. (2003), in RCNP Annual Report, (under construction).
- Raynal (1998) J. Raynal (1998), computer program DWBA98, NEA 1209/05.
- Dobaczewski et al. (1984) J. Dobaczewski, H. Flocard, and J. Treiner, Nucl. Phys. A422, 103 (1984).
- Dobaczewski et al. (1996) J. Dobaczewski, W. Nazarewicz, T. Werner, J.-F. Berger, C. Chinn, and J. Dechargé, Phys. Rev. C 53, 2809 (1996).
- Chabanat et al. (1997) E. Chabanat, P. Bonche, P. Haensel, J. Meyer, and F. Schaeffer, Nucl. Phys. A627, 710 (1997).
- Dobaczewski et al. (1995) J. Dobaczewski, W. Nazarewicz, and T. Werner, Physica Scripta T56, 15 (1995).
- Machleidt et al. (1987) R. Machleidt, K. Holinde, and C. Elster, Phys. Rep. 149, 1 (1987).
- Deb and Amos (2002) P. K. Deb and K. Amos, Phys. Rev. C 66, 24604 (2002).
- Boyd et al. (1971) R. N. Boyd, J. Fenton, M. Williams, T. Kruse, and W. Savin, Nucl. Phys. A162, 497 (1971).
- Mani et al. (1971) G. S. Mani, D. T. Jones, and D. Jacques, Nucl. Phys. A165, 384 (1971).
- Abbott et al. (1987) D. J. Abbott, T. B. Clegg, and J. P. Delaroche, Phys. Rev. C 35, 2028 (1987).
- Wassenaar et al. (1989) S. D. Wassenaar et al., J. Phys. G15, 181 (1989).
- Tarats et al. (1981) A. Tarats, J.-L. Escudie, and I. Brissaud, Nucl. Phys. A362, 128 (1981).
- Pingzhi (1985) N. Pingzhi, Chin. J. Nucl. Phys. 7, 313 (1985).
- Craig et al. (1964) R. M. Craig, J. C. Dore, G. W. Greenlees, L. S. Lilley, and J. Lowe, Nucl. Phys. 58, 515 (1964).
- Greenlees et al. (1970) G. W. Greenlees, V. Hnidzo, O. Karban, J. Lowe, and W. Makofske, Phys. Rev. C 2, 1063 (1970).
- Hnidzo and Lowe (1971) V. Hnidzo and J. Lowe, Phys. Lett. 35B, 311 (1971).
- Hardacre et al. (1971) A. G. Hardacre et al., Nucl. Phys. A173, 436 (1971).
- Manweiler (1975) R. W. Manweiler, Nucl. Phys. A240, 373 (1975).
- Fricke et al. (1967) M. P. Fricke, E. E. G. amd B. J. Morton, and A. Zucker, Phys. Rev. 156, 1207 (1967).
- Boyd and Greenlees (1968) R. N. Boyd and G. W. Greenlees, Phys. Rev. 176, 1394 (1968).
- Haensel (1975) P. Haensel, Nucl. Phys. A245, 29 (1975).
- Fulmer et al. (1969) C. B. Fulmer, J. B. Ball, A. Scott, and M. L. Whitten, Phys. Rev. 181, 1565 (1969).
- Hachenburg et al. (1980) F. Hachenburg, H. C. Chiang, and J. Hufner, Phys. Lett. B97, 183 (1980).
- Ma et al. (1988) Z.-Y. Ma, P. Zhu, Y.-Q. Gu, and Y.-Z. Zhuo, Nucl. Phys. A490, 619 (1988).
- Kwiatowski and Wall (1978) K. Kwiatowski and N. S. Wall, Nucl. Phys. A301, 349 (1978).
- Schwandt et al. (1982) P. Schwandt, others, et al., Phys. Rev. C 26, 55 (1982).
- Kailas et al. (1984) S. Kailas et al., Phys. Rev. C 29, 2075 (1984).
- van der Werf et al. (1987) S. Y. van der Werf et al., Phys. Rev. C 36, 1796 (1987).
- Comparat et al. (1974) V. Comparat, R. Frascaria, N. Marty, M. Morlet, and A. Willis, Nucl. Phys. A221, 403 (1974).
- Sarker et al. (2002) D. R. Sarker, H. Kabir, M. A. Rahman, and H. M. S. Gupta, Int. J. Mod. Phys. E11, 403 (2002).
- Kaki and Toki (2001) K. Kaki and H. Toki, Nucl. Phys. A696, 452 (2001).
- Yosoi et al. (1985) M. Yosoi et al. (1985), in RCNP Annual Report, p. 4.
- Ingemarsson et al. (1999) A. Ingemarsson et al., Nucl. Phys. A653, 341 (1999).
- Sakaguchi et al. (1993) H. Sakaguchi et al. (1993), in RCNP Annual Report, p. 4.
- Lagoyannis et al. (2001) A. Lagoyannis et al., Phys. Lett. B518, 27 (2001).
- Stepantsov et al. (2002) S. Stepantsov et al., Phys. Lett. 542, 35 (2002).